Research Update: Assessing and Predicting Pasture GHG Emissions
At a Glance
ETDS Progress
Research Topic: Assessing and Predicting Greenhouse Gas Emissions form Pasture Fields
PI: Glen Rains
Team: Polycarpe Mizero (MS)
Main Objective: Create a scalable system for greenhouse gas (GHG) assessment in grazing fields.
Motivation
Georgia has about 3.5 million acres of pasture land, making it vital to understand emissions from this land use.
Spatial and temporal variability in emission makes it hard to generalize due to lack of integrated approach to measure greenhouse gas emissions (GHG) from pasture.
Proposed Solution
Using spectrolradiometers to capture spectral signature from different forages and surface types.
Measure GHG emissions at point-scale with portable sensors across pasture, dung, and urine patches.
Use drones to map and scale up point measurements to the field level.
Results to Date
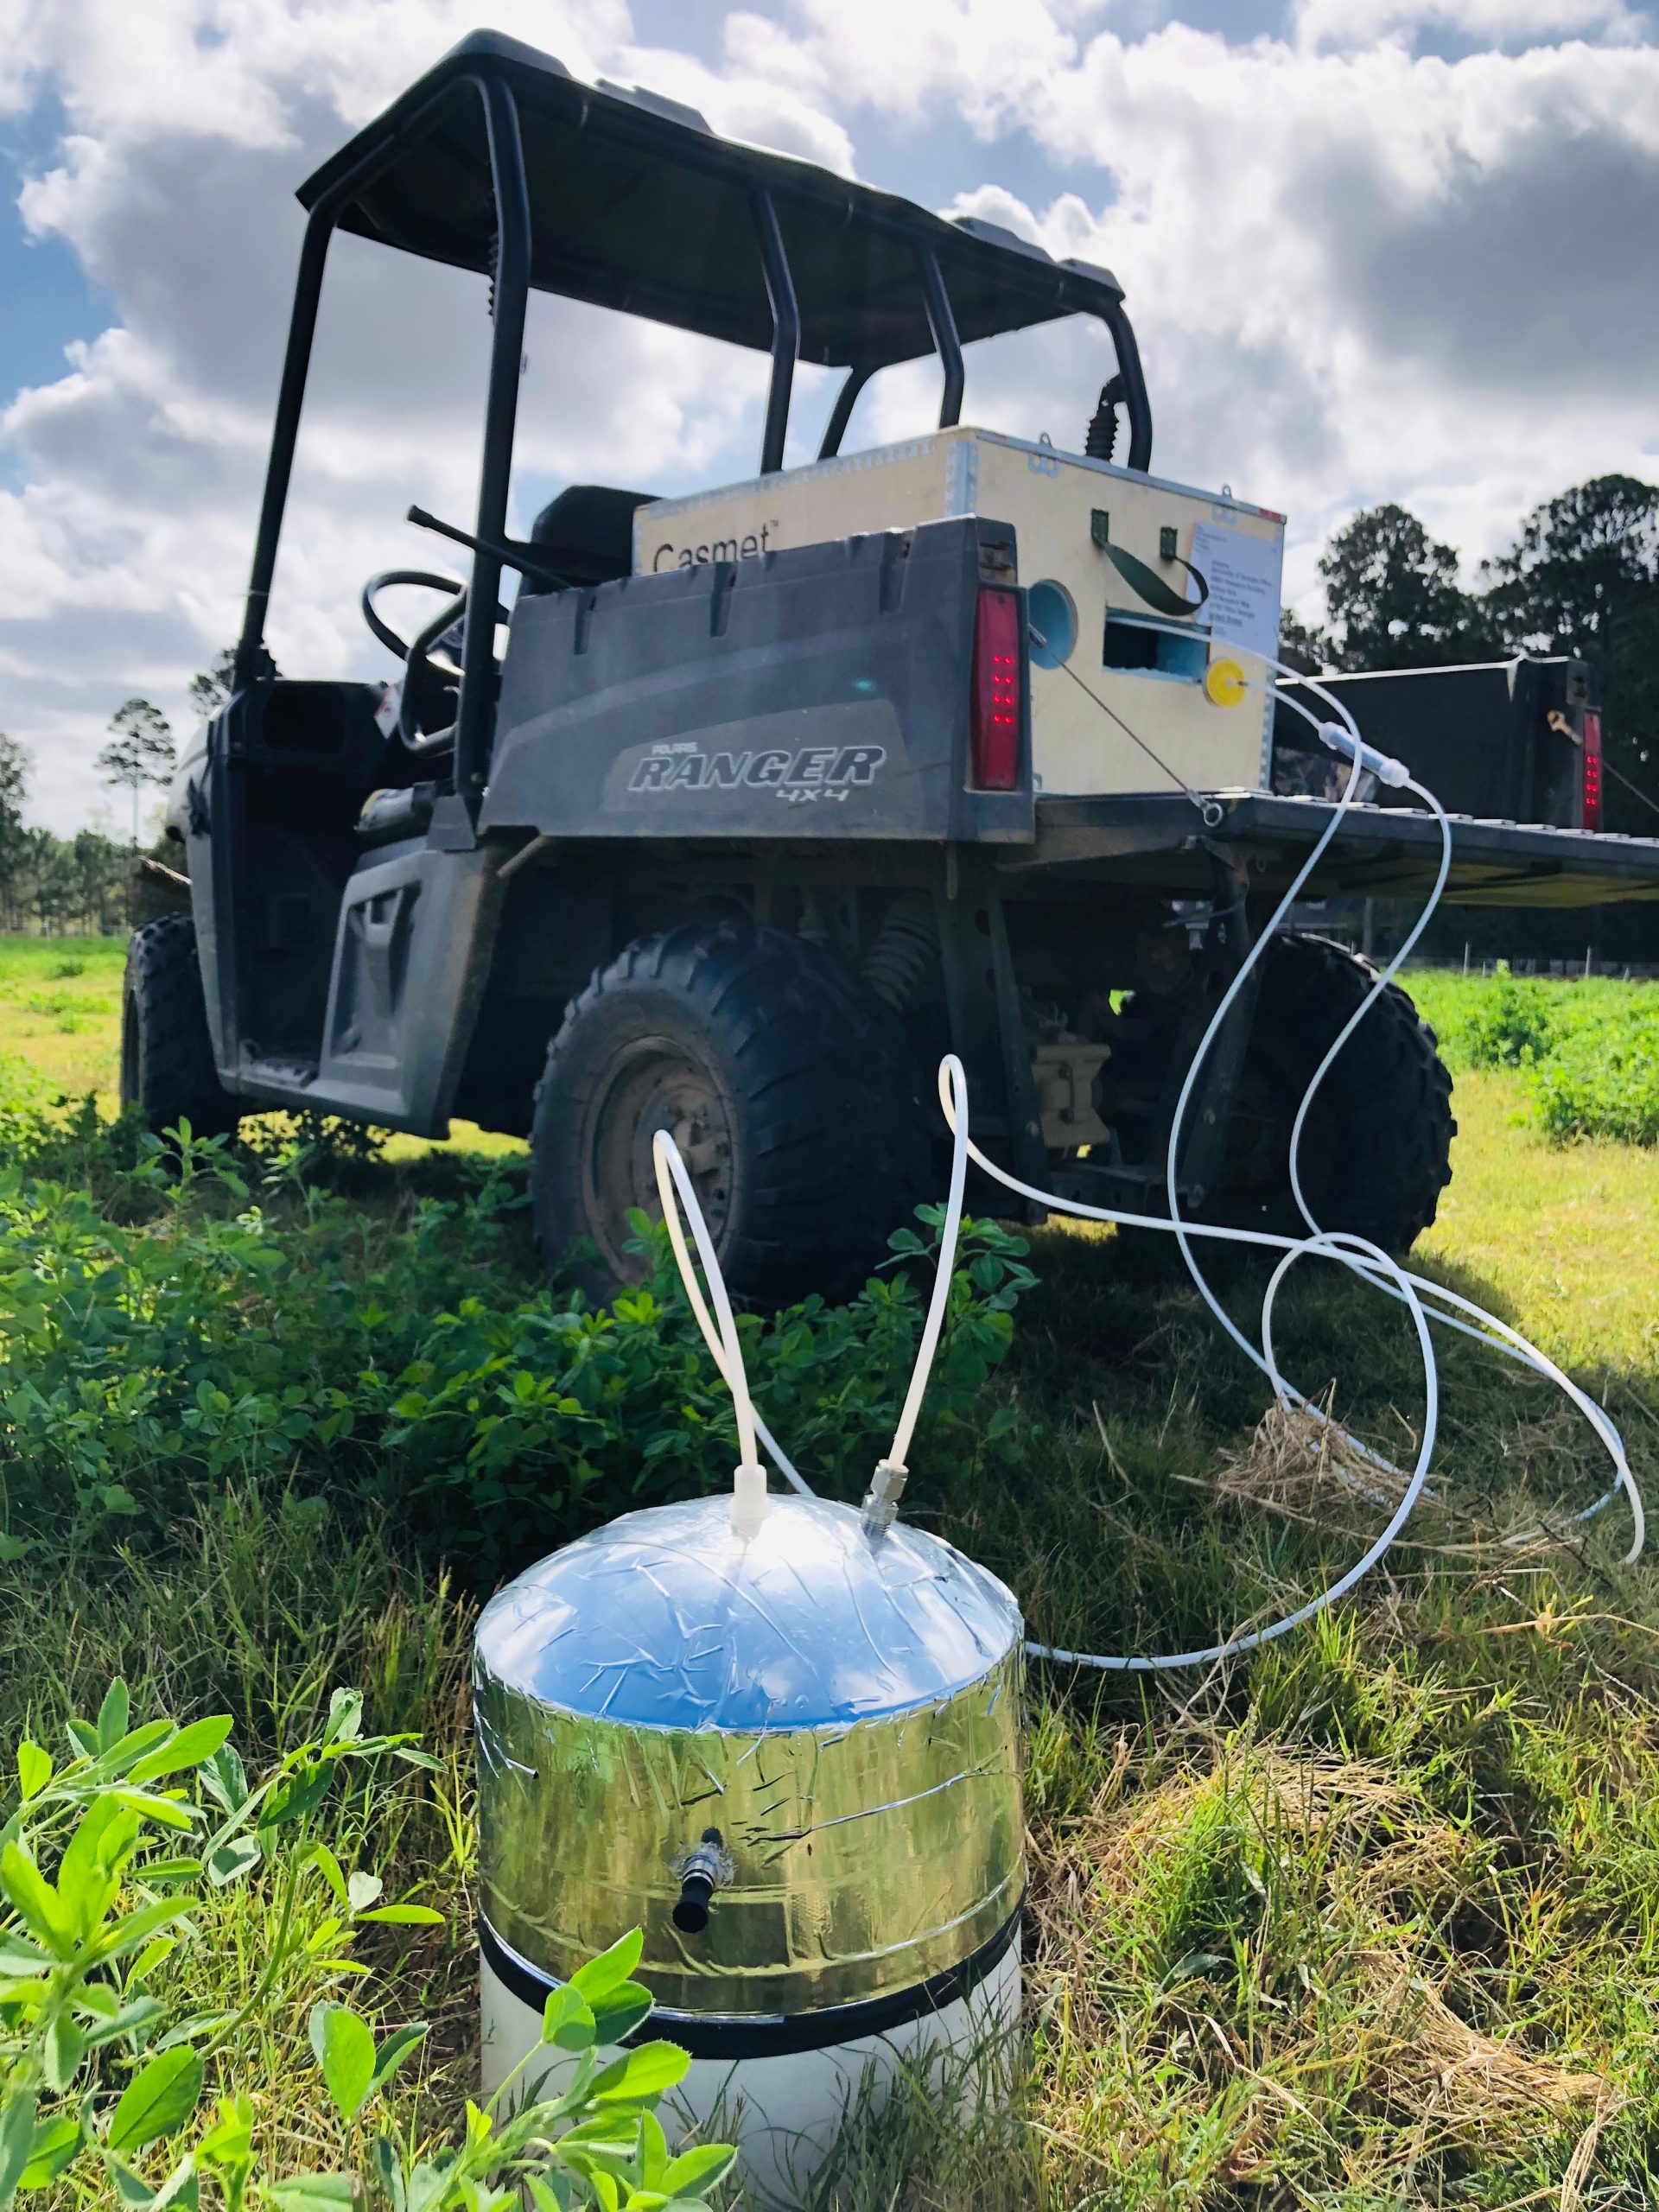
We have collected point-scale greenhouse gas emissions using a Gasmet DX4015 portable gas analyzer for Fall 2024. We also used a spectralradiometer, another type of sensor that collects the spectral signature of different crops.
Collars are PVC pipes that have been placed at specific spots in pasture and are connected to the GHG chamber. A Gasmet sensor measures the quantity of GHG emitted from that precise point via a closed loop.
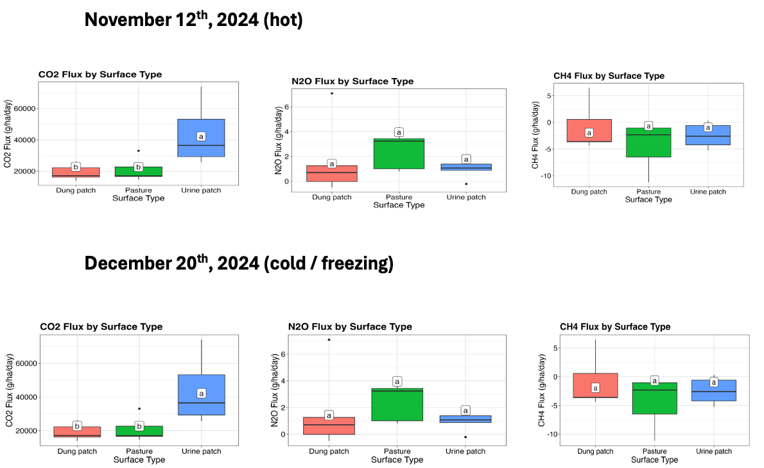
Using this data, we conducted analysis of greenhouse gas flux and imagery for both the hot and cold days (November 12th and December 20th 2024).
GHG flux for 2 different date, Urine patch having the
highest CO2 emission, pasture having the highest
N2O emission, and dung patch having higher CH4
emissions.
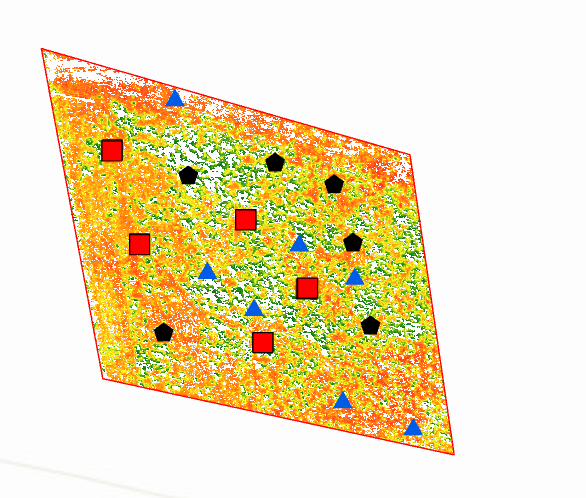
We then produced the vegetation indices map for NDVI and NDRE associated with sampling points.
During summer 2025, we will collect spectral signature of different forages and surface types.
We will collect one more year of data for point-scale GHG emissions (Summer-Fall 2025).
We will finalize analysis of greenhouse gas emissions and imagery for all dates (Fall 2024 and Summer 2025).
We will create an emission prediction model and train it to predict GHG emissions for Fall and Summer.
Citation
Bastos, L. M., et al. (2021). “Untangling soil‐weather drivers of daily N₂O emissions and fertilizer management mitigation strategies in no‐till corn.” Soil Science Society of America Journal85(5): 1437-1447.
Discover more from 4D Farm
Subscribe to get the latest posts sent to your email.
