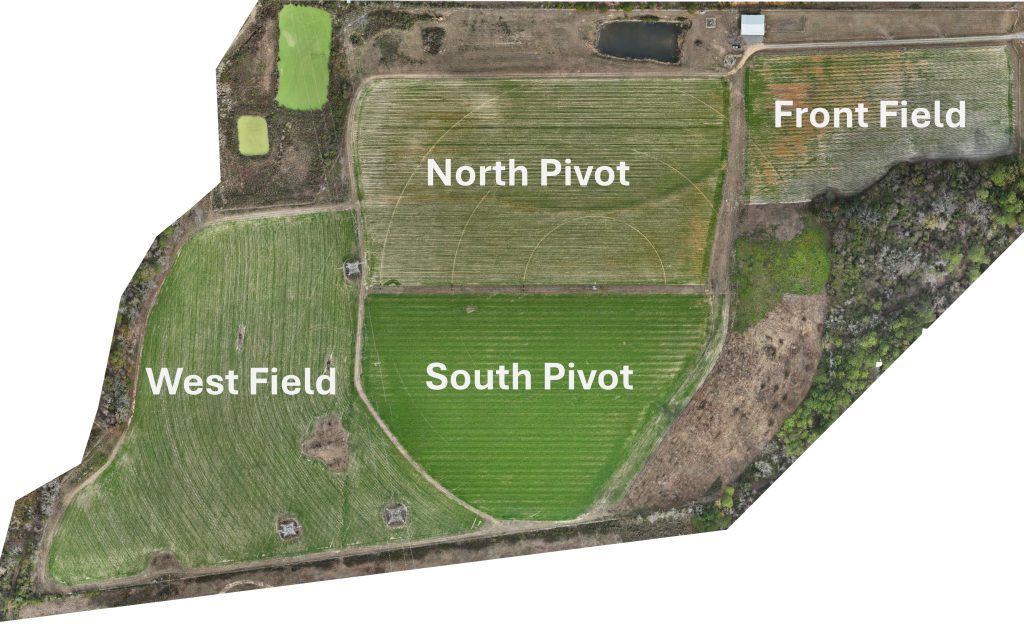
West Field – Cover: Winter Forage Mix, 64 DAP*; 2026 Crop: Dryland Cotton
*As of 1/1/2026
Overview of Activities
The month of December began with much-needed rain at the DATA Farm. Following this rainfall during the first week of the month, the soil contained sufficient moisture for the Veris implement to accurately measure shallow soil Apparent Electrical Conductivity (ECa).
What is Soil ECa, and What Does It Tell Us?
Soil ECa measures the soil’s ability to conduct electrical signals, a property influenced by texture, moisture content, salinity, cation exchange capacity (CEC), temperature, and bulk density. For the 4D Farm project, we are interested in mapping soil texture variability within the fields. Sandy soils have larger pore spaces and lower water-holding capacity; because they contain more air and fewer dissolved ions, they are poor conductors. In contrast, clay soils consist of smaller pore spaces with higher water-holding capacity and greater surface area, making them significantly better conductors of electrical signals.
Methodology and Data Collection
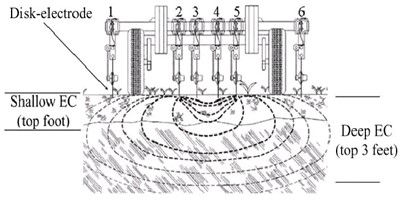
Figure 1. Diagram of the Veris implement showing the coulter-electrodes and electrical field.
Contact electrodes are used to measure soil ECa, a method employed by Veris sensors. The system transmits an electrical signal into the soil via a pair of center-mounted coulters, while a second pair of coulters on the outside receives the signal, as shown in Figure 1. By measuring the voltage drop across these sensors, the system calculates soil conductivity. Data are recorded at one-second intervals and paired with GPS coordinates to generate high-resolution maps of soil variability. These maps are essential for defining management zones and enabling the site-specific application of irrigation.
Figure 1. Diagram of the Veris implement showing the coulter-electrodes and electrical field.
Contact electrodes are used to measure soil ECa, a method employed by Veris sensors. The system transmits an electrical signal into the soil via a pair of center-mounted coulters, while a second pair of coulters on the outside receives the signal, as shown in Figure 1. By measuring the voltage drop across these sensors, the system calculates soil conductivity. Data are recorded at one-second intervals and paired with GPS coordinates to generate high-resolution maps of soil variability. These maps are essential for defining management zones and enabling the site-specific application of nutrients, pesticides, and water.
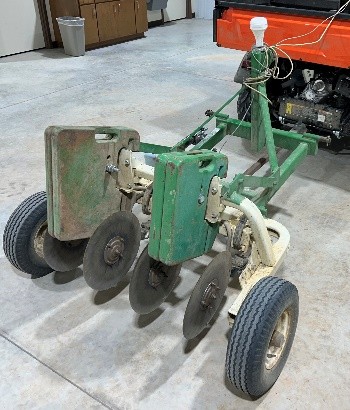
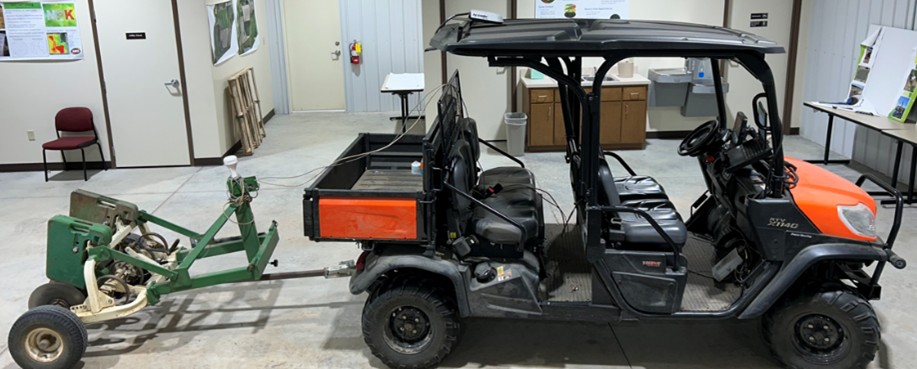
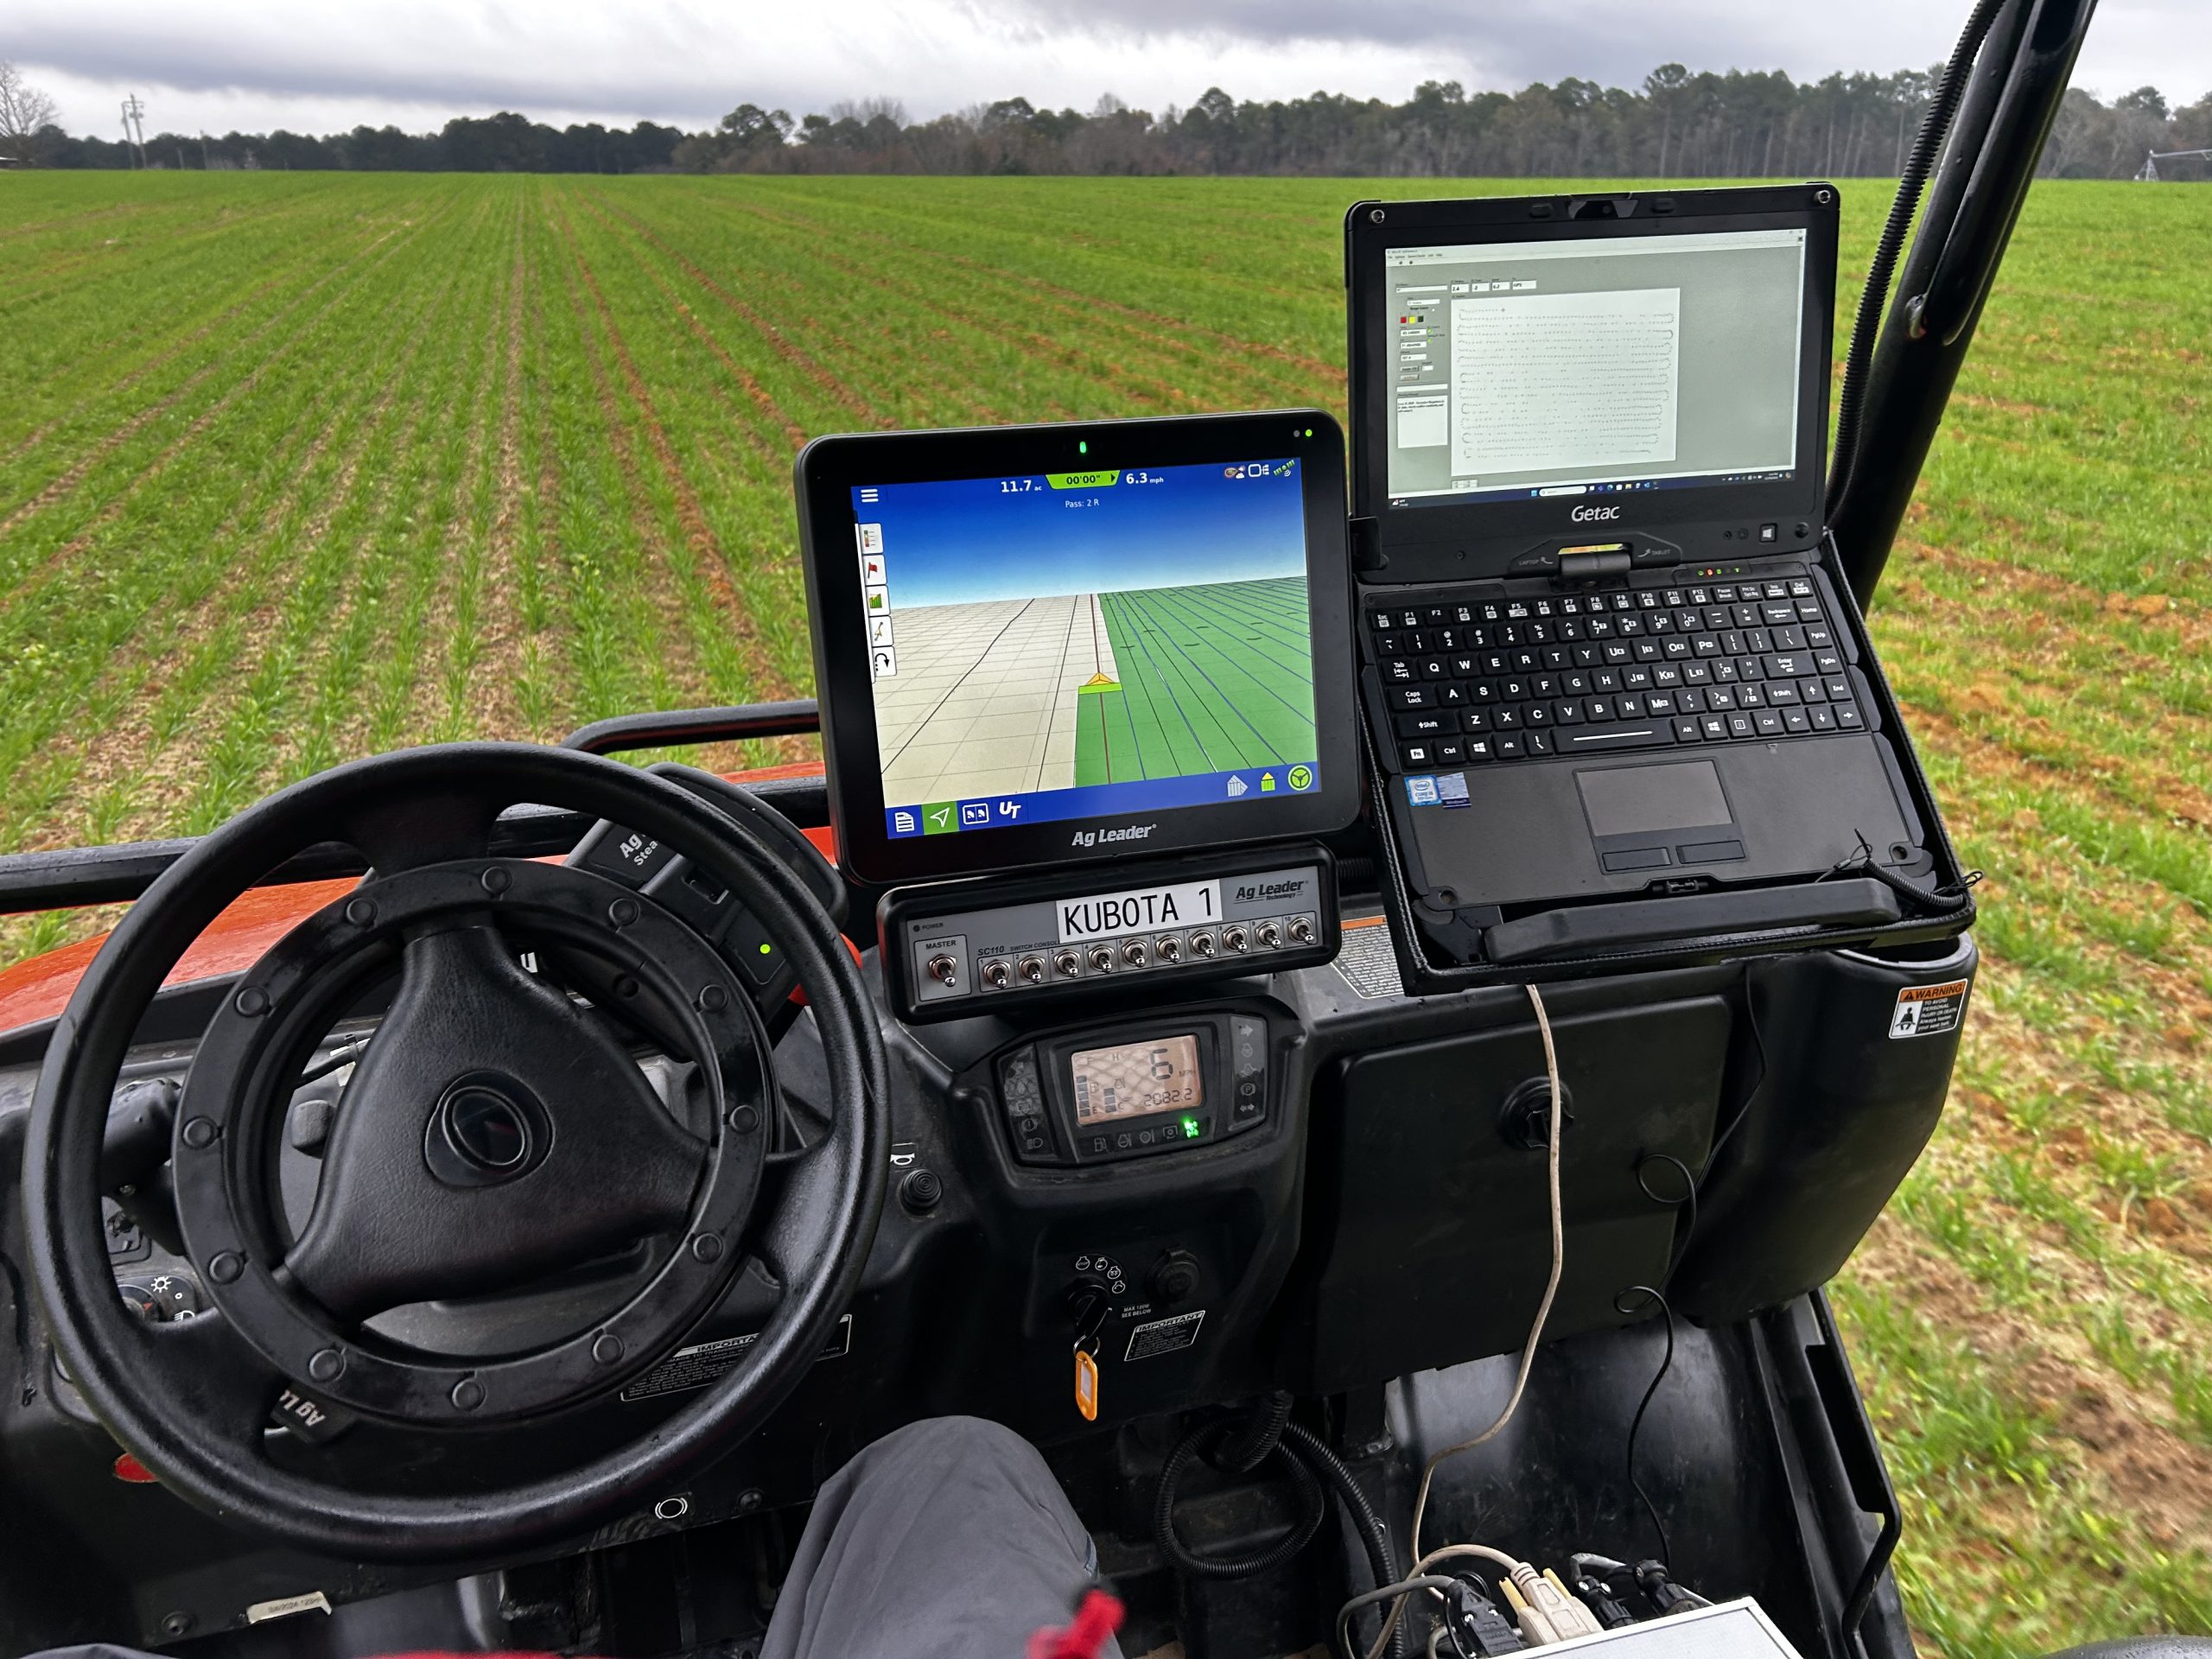
To acquire soil ECa data for the 4D Farm project, a Veris Q1000 implement (Figure 2) was pulled by a Kubota UTV (Figure 3) on December 18th and 19th, 2025. The vehicle was equipped with an Ag Leader InCommand 1200 monitor and a SteadySteer system utilizing RTK GPS.A laptop was connected by serial cable to the Veris system’s control box to record the data using Veris’ Soil Viewer application as shown in Figure 4. This operation was previously conducted at the project’s inception in the fall of 2023.
The ECa maps from the initial 2023 survey were used to identify optimal soil sensor locations for irrigation management. While soil ECa generally remains temporally stable unless a severe disturbance occurs, environmental factors—such as temperature and moisture—can influence annual readings. Although Veris typically suggests re-mapping on a 10-year cycle, we chose to repeat the operation after only two years to compare datasets and assess temporal consistency for this specific site.
A guidance line was established in each field with 25-foot swath spacing to ensure consistent measurements. While the Veris manual typically recommends widths of 50–75 feet, we selected a 25-foot width to increase data resolution for the smaller field sizes at the DATA Farm. The Veris Q1000 measures “shallow” ECa, covering the 0 to 12-inch (0–30 cm) depth range. This measurement provides a detailed map of soil textures within the plow layer, though it does not capture data for the subsoil level.
Results
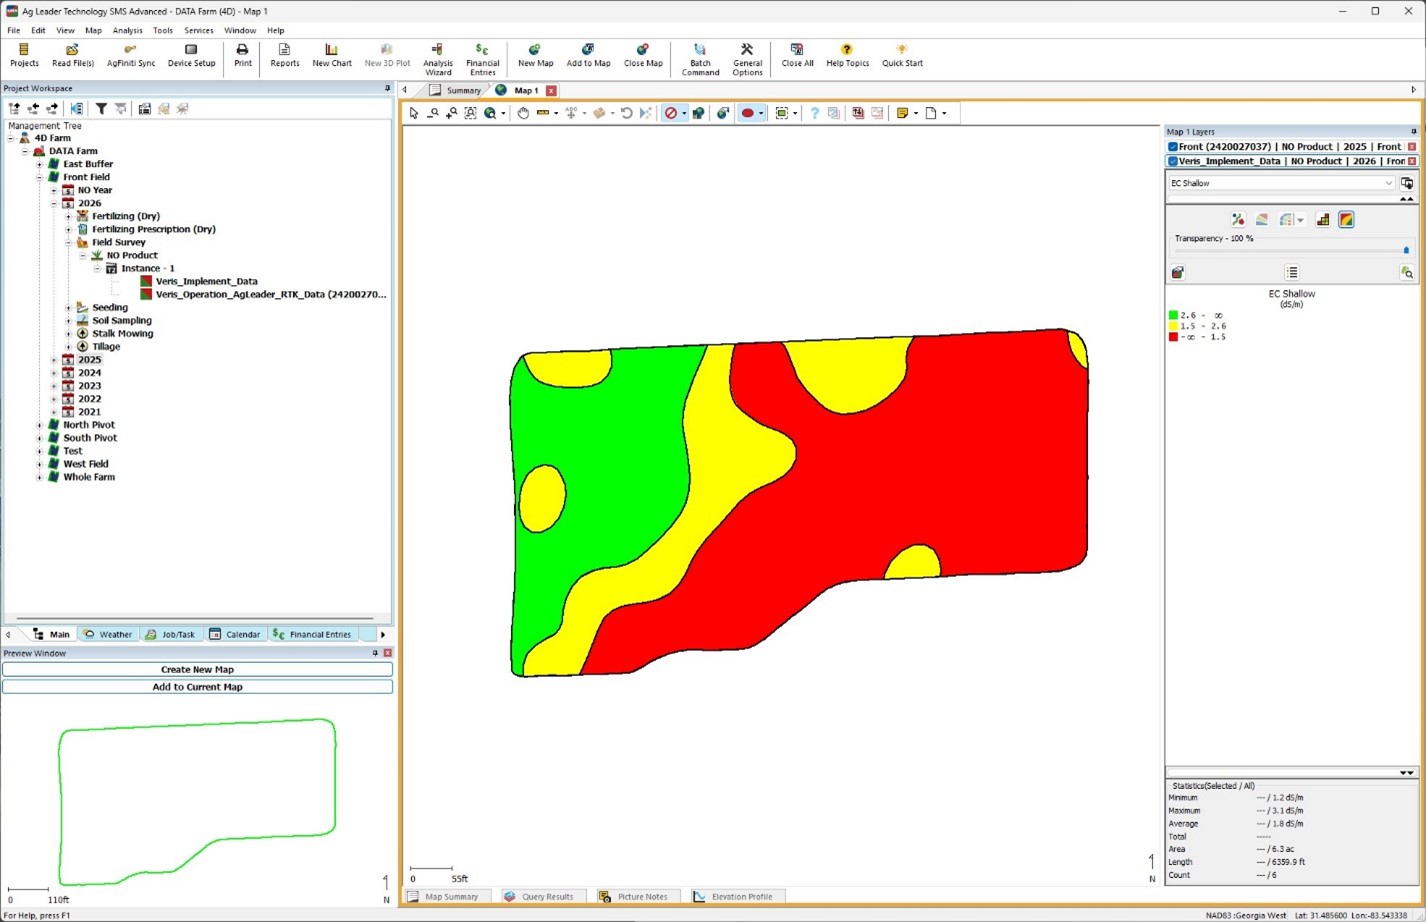
The soil data collected from the Veris sensor was imported into Ag Leader SMS Advanced (version 25.5) to create contour maps for each field. Figure 5 displays the data points exported from Soil Viewer, while Figure 6 shows the contour map generated by SMS using these points. SMS utilizes kriging to generate maps by interpolating the imported data. For this analysis, a linear variogram type was selected, utilizing all available data points. The map legend was set to standard deviation using three ranges: red areas indicate sandier soil, green areas indicate higher clay content, and yellow areas represent intermediate soil types.
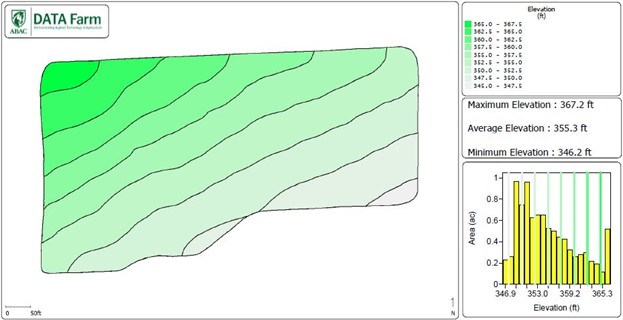
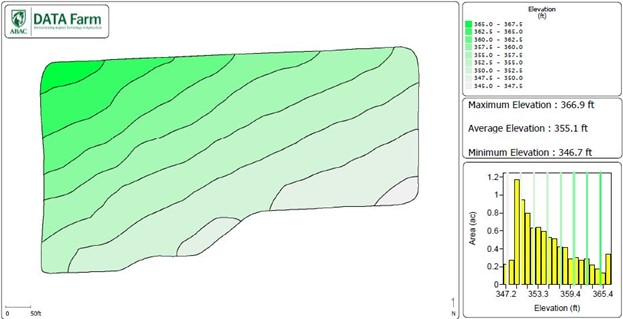
Figures 7 (Shallow ECa) and 8 (RTK Elevation) are SMS exports created for the Soil Report; each map includes a legend, value ranges (Max/Avg/Min), and a histogram of the data.
The monthly temperature trends and rainfall recorded by the on-site weather station for Decemberare showninFigure11.
Figure 11. Monthly weather for December 2025.
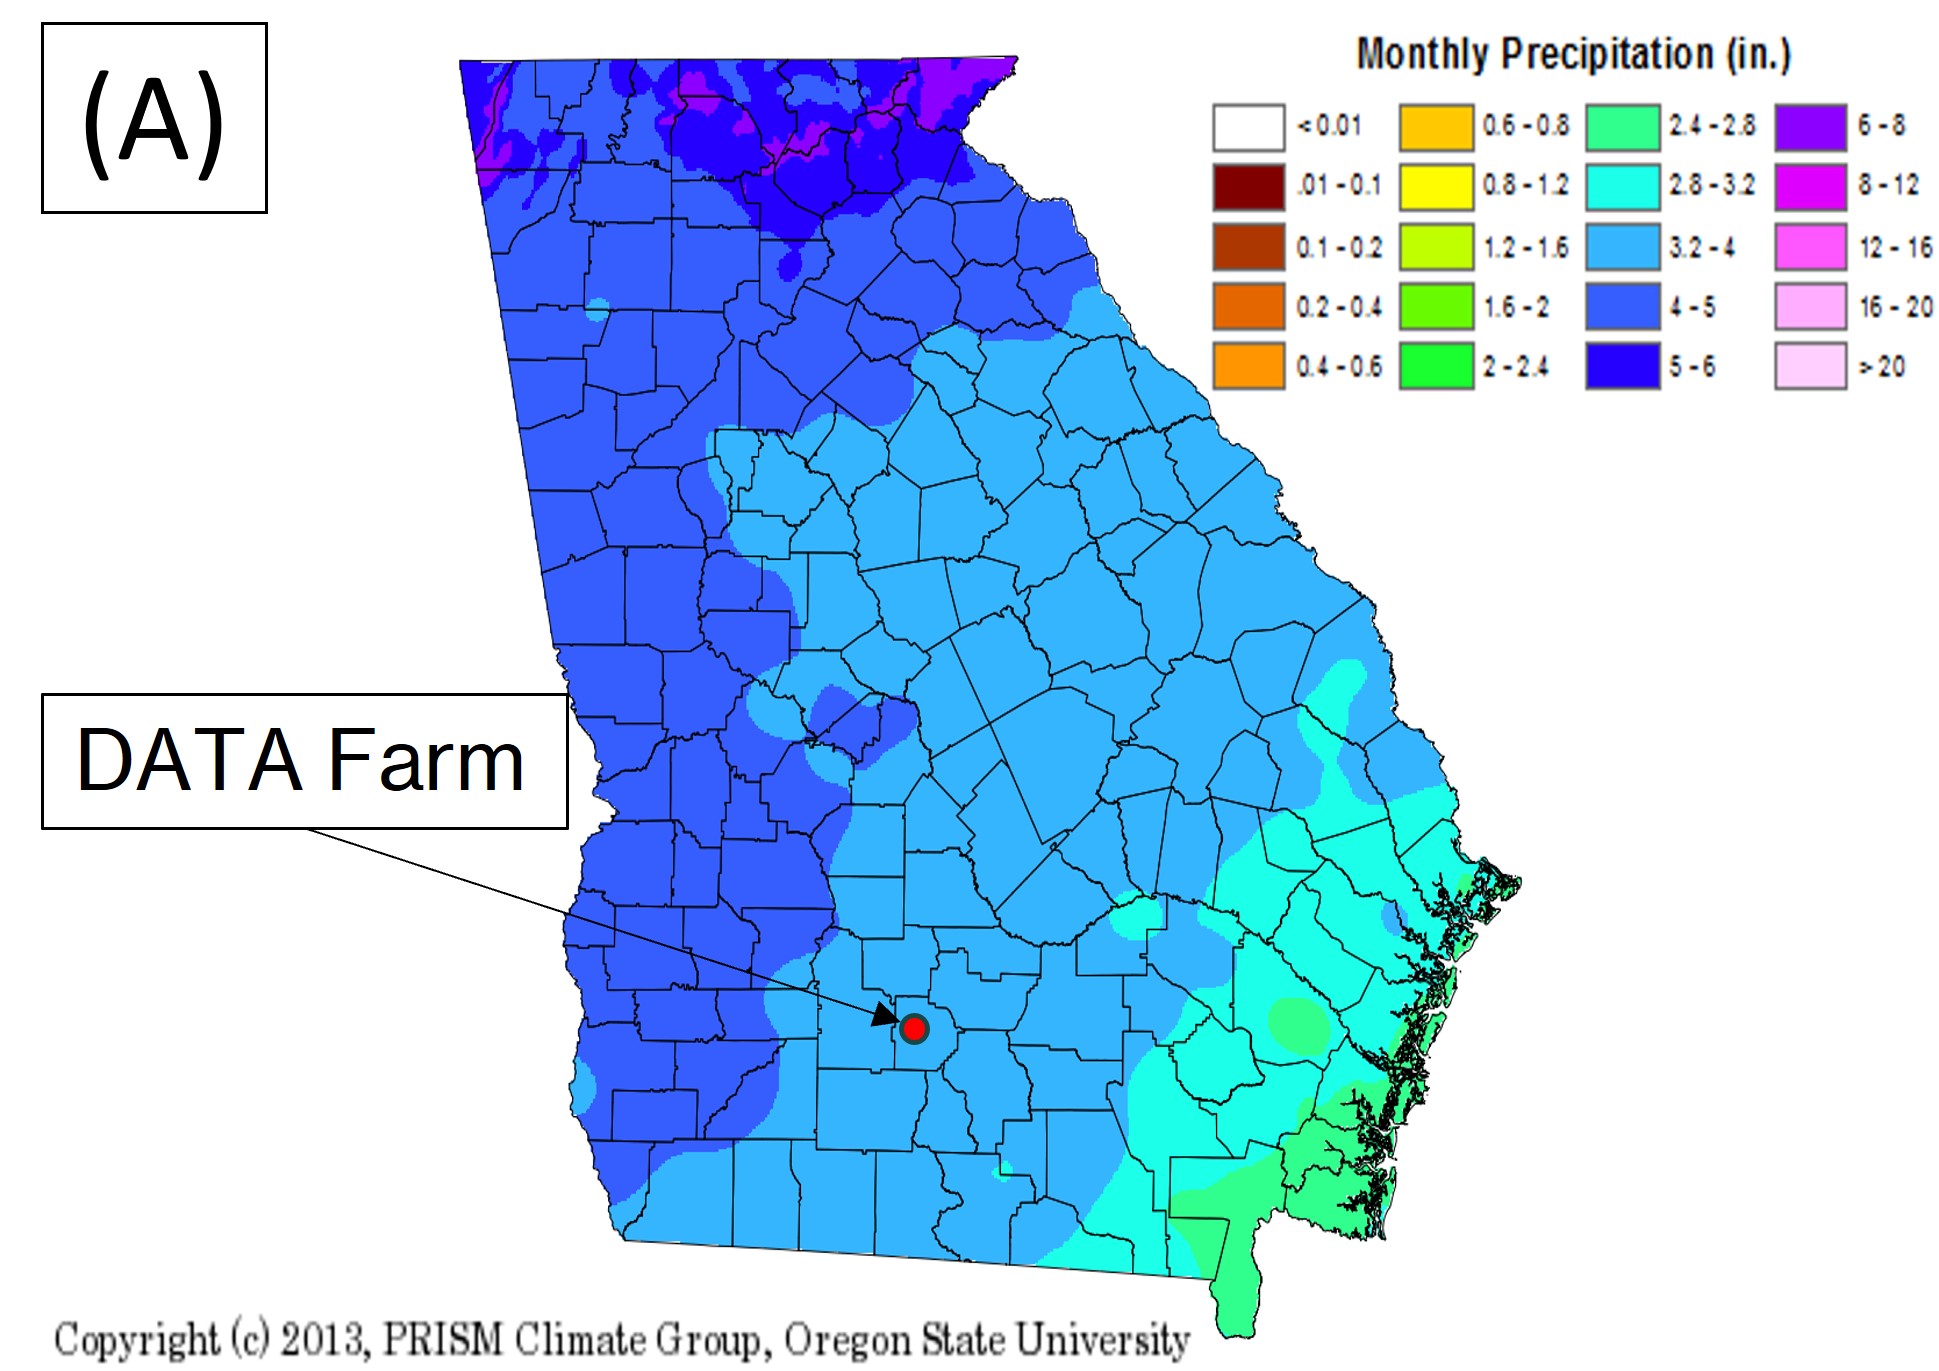
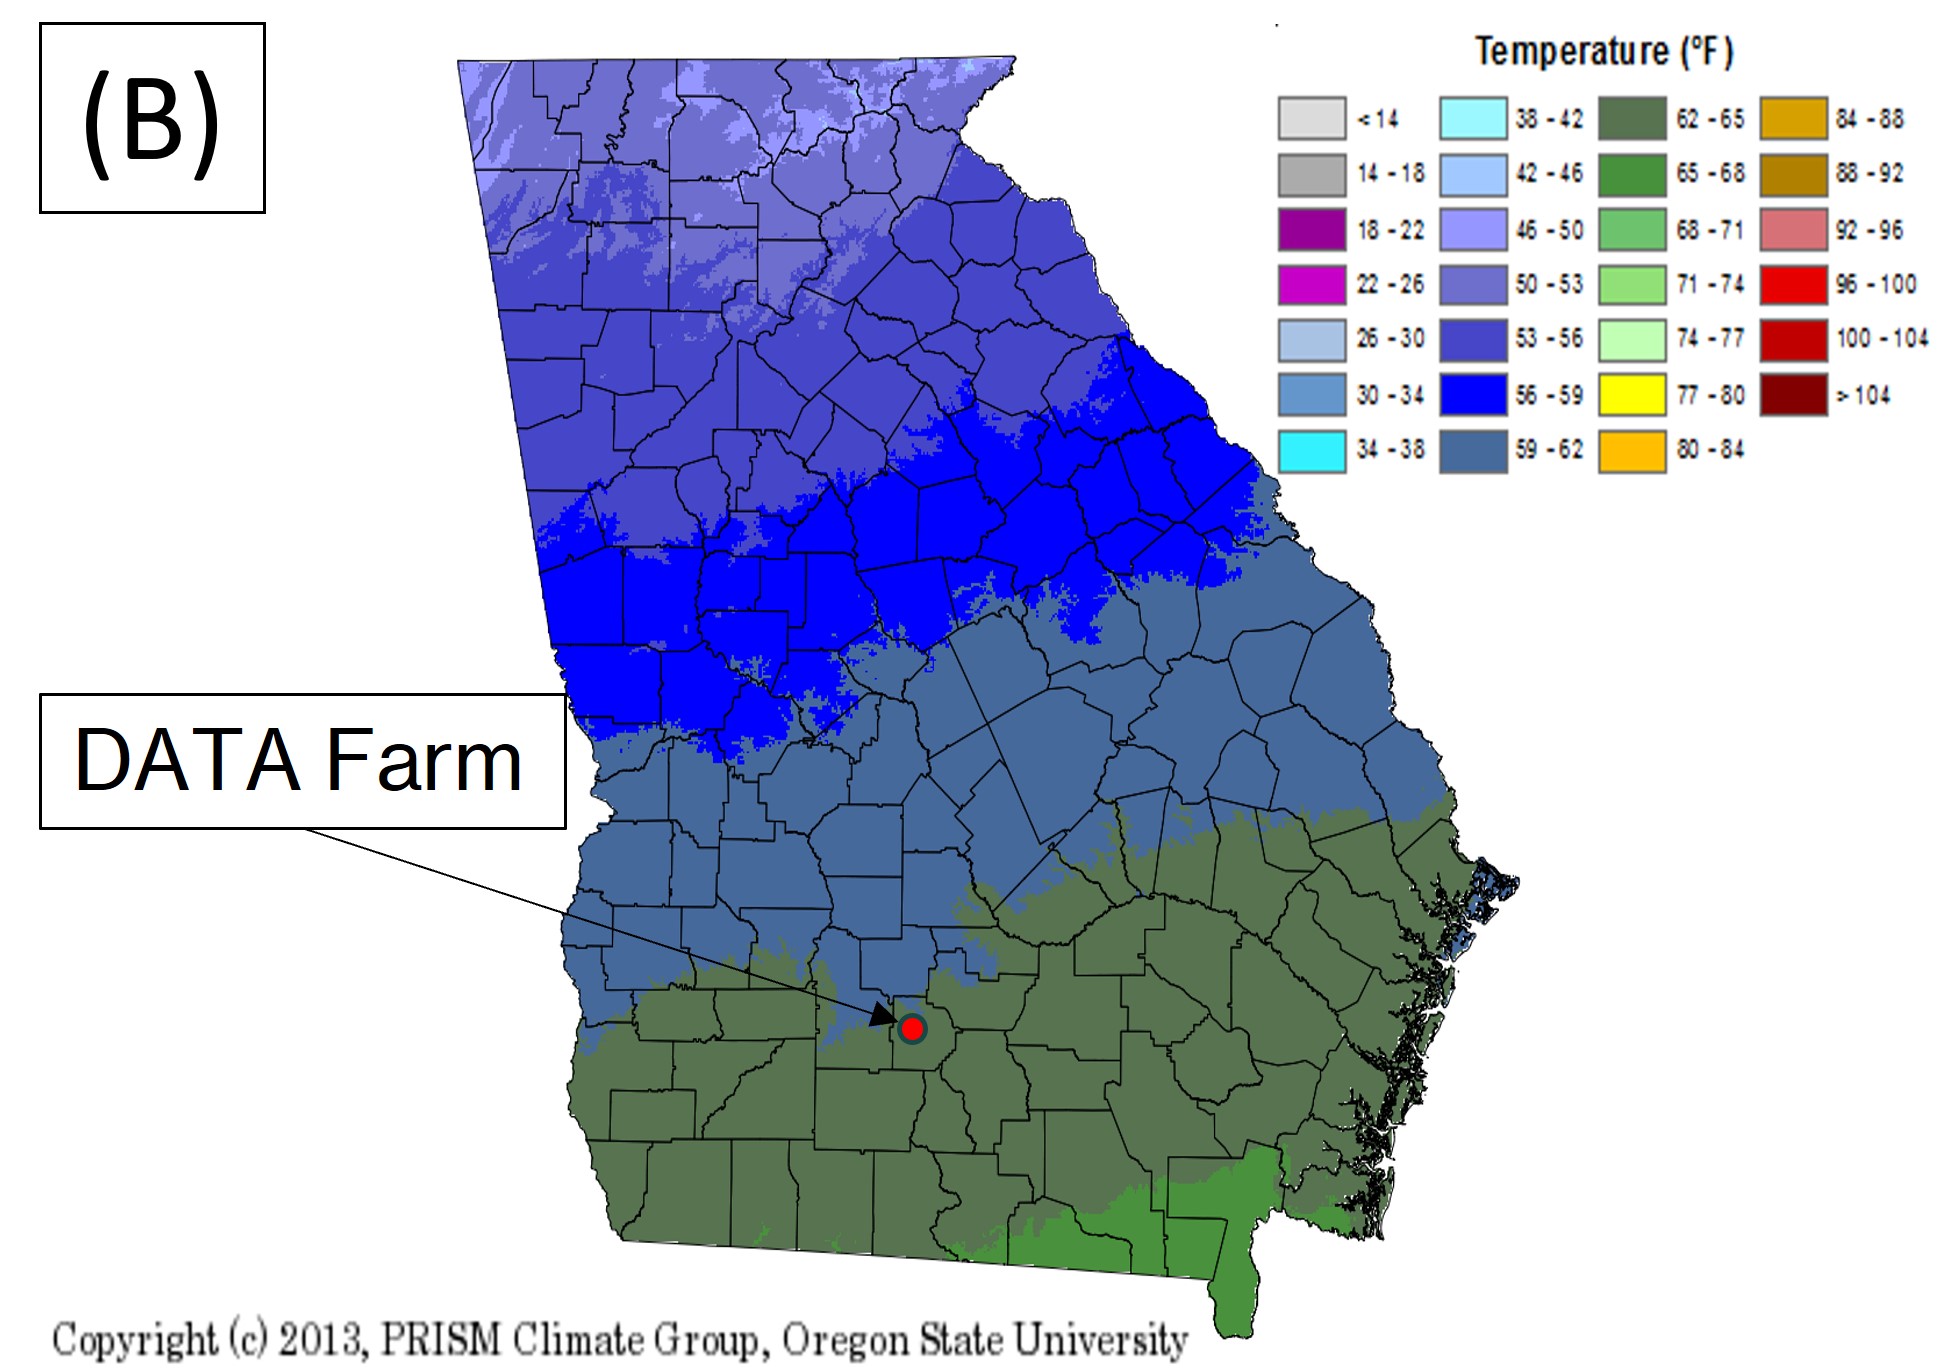
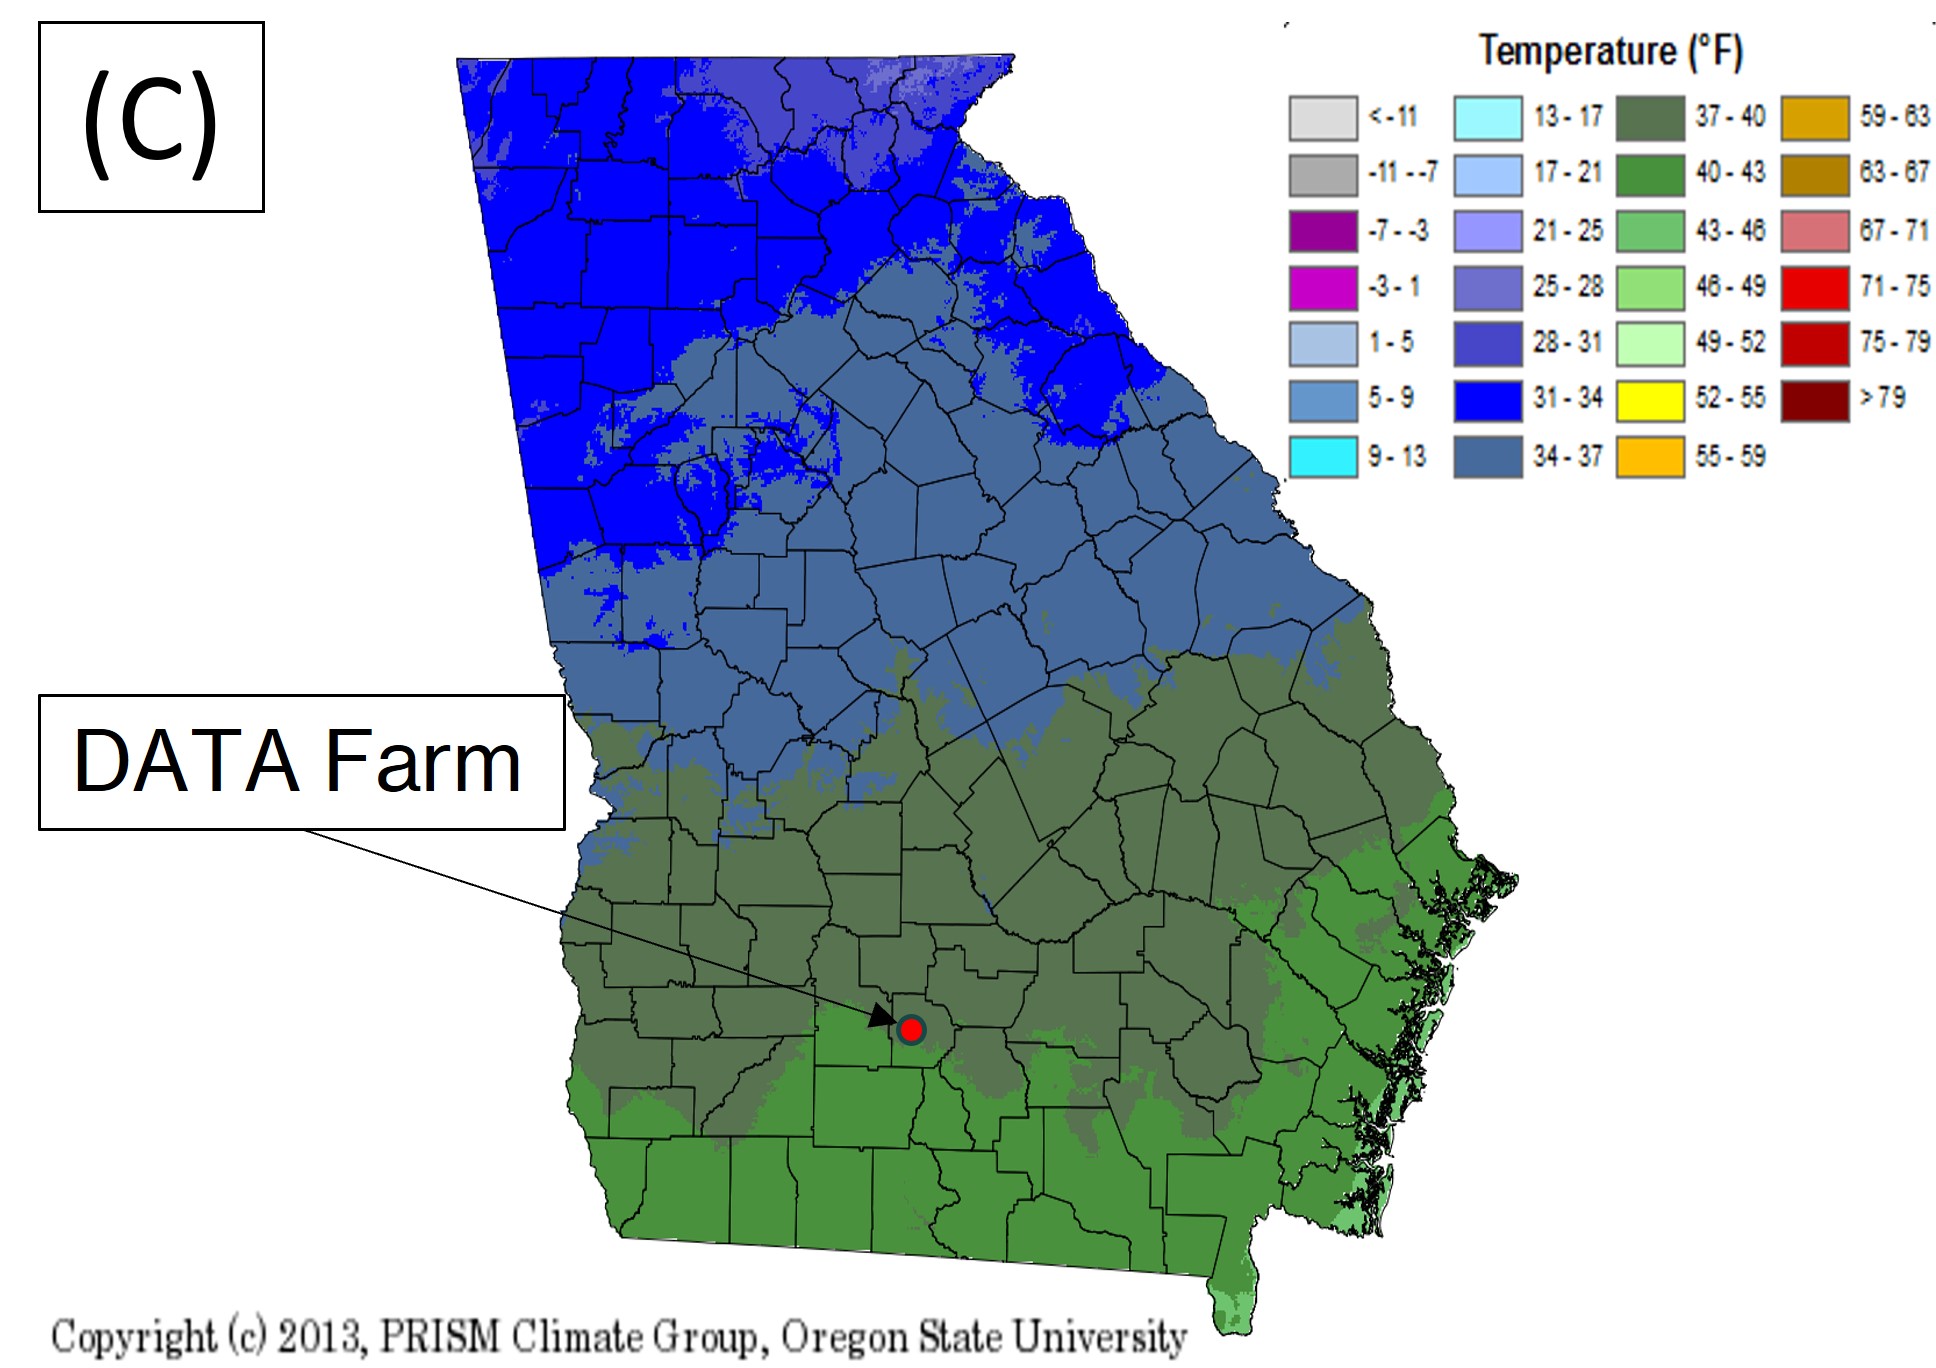
For historical comparison, Georgia climate maps based on data from 1981 to 2010 (UGA’s Weather Network) are shown in Figure 12 for the month of December.
December brought some much-needed rainfall. A total rainfall of 2.8 inches was recorded at the DATA Farm during December, still below the average (3.2 – 4.0 inches). The most rainfall occurred during the first week of the month as shown by the chart in Figure 11 above. This welcome rain helped to ease the drought conditions across the state and DATA Farm area.
The average of recorded maximum temperatures for the month was 63°F, within the average historical range of 62°F – 65°F (Figure 12B), and the average of recorded minimum temperatures was 42°F, slightly above the average historical range of 37°F – 40°F (Figure 12C). While the average of daily high temperatures fell within the historical range, 9 days during the second half of December were above 70°F. These unseasonably warm temperatures encouraged growth of the cover mix following the moisture earlier in the month.
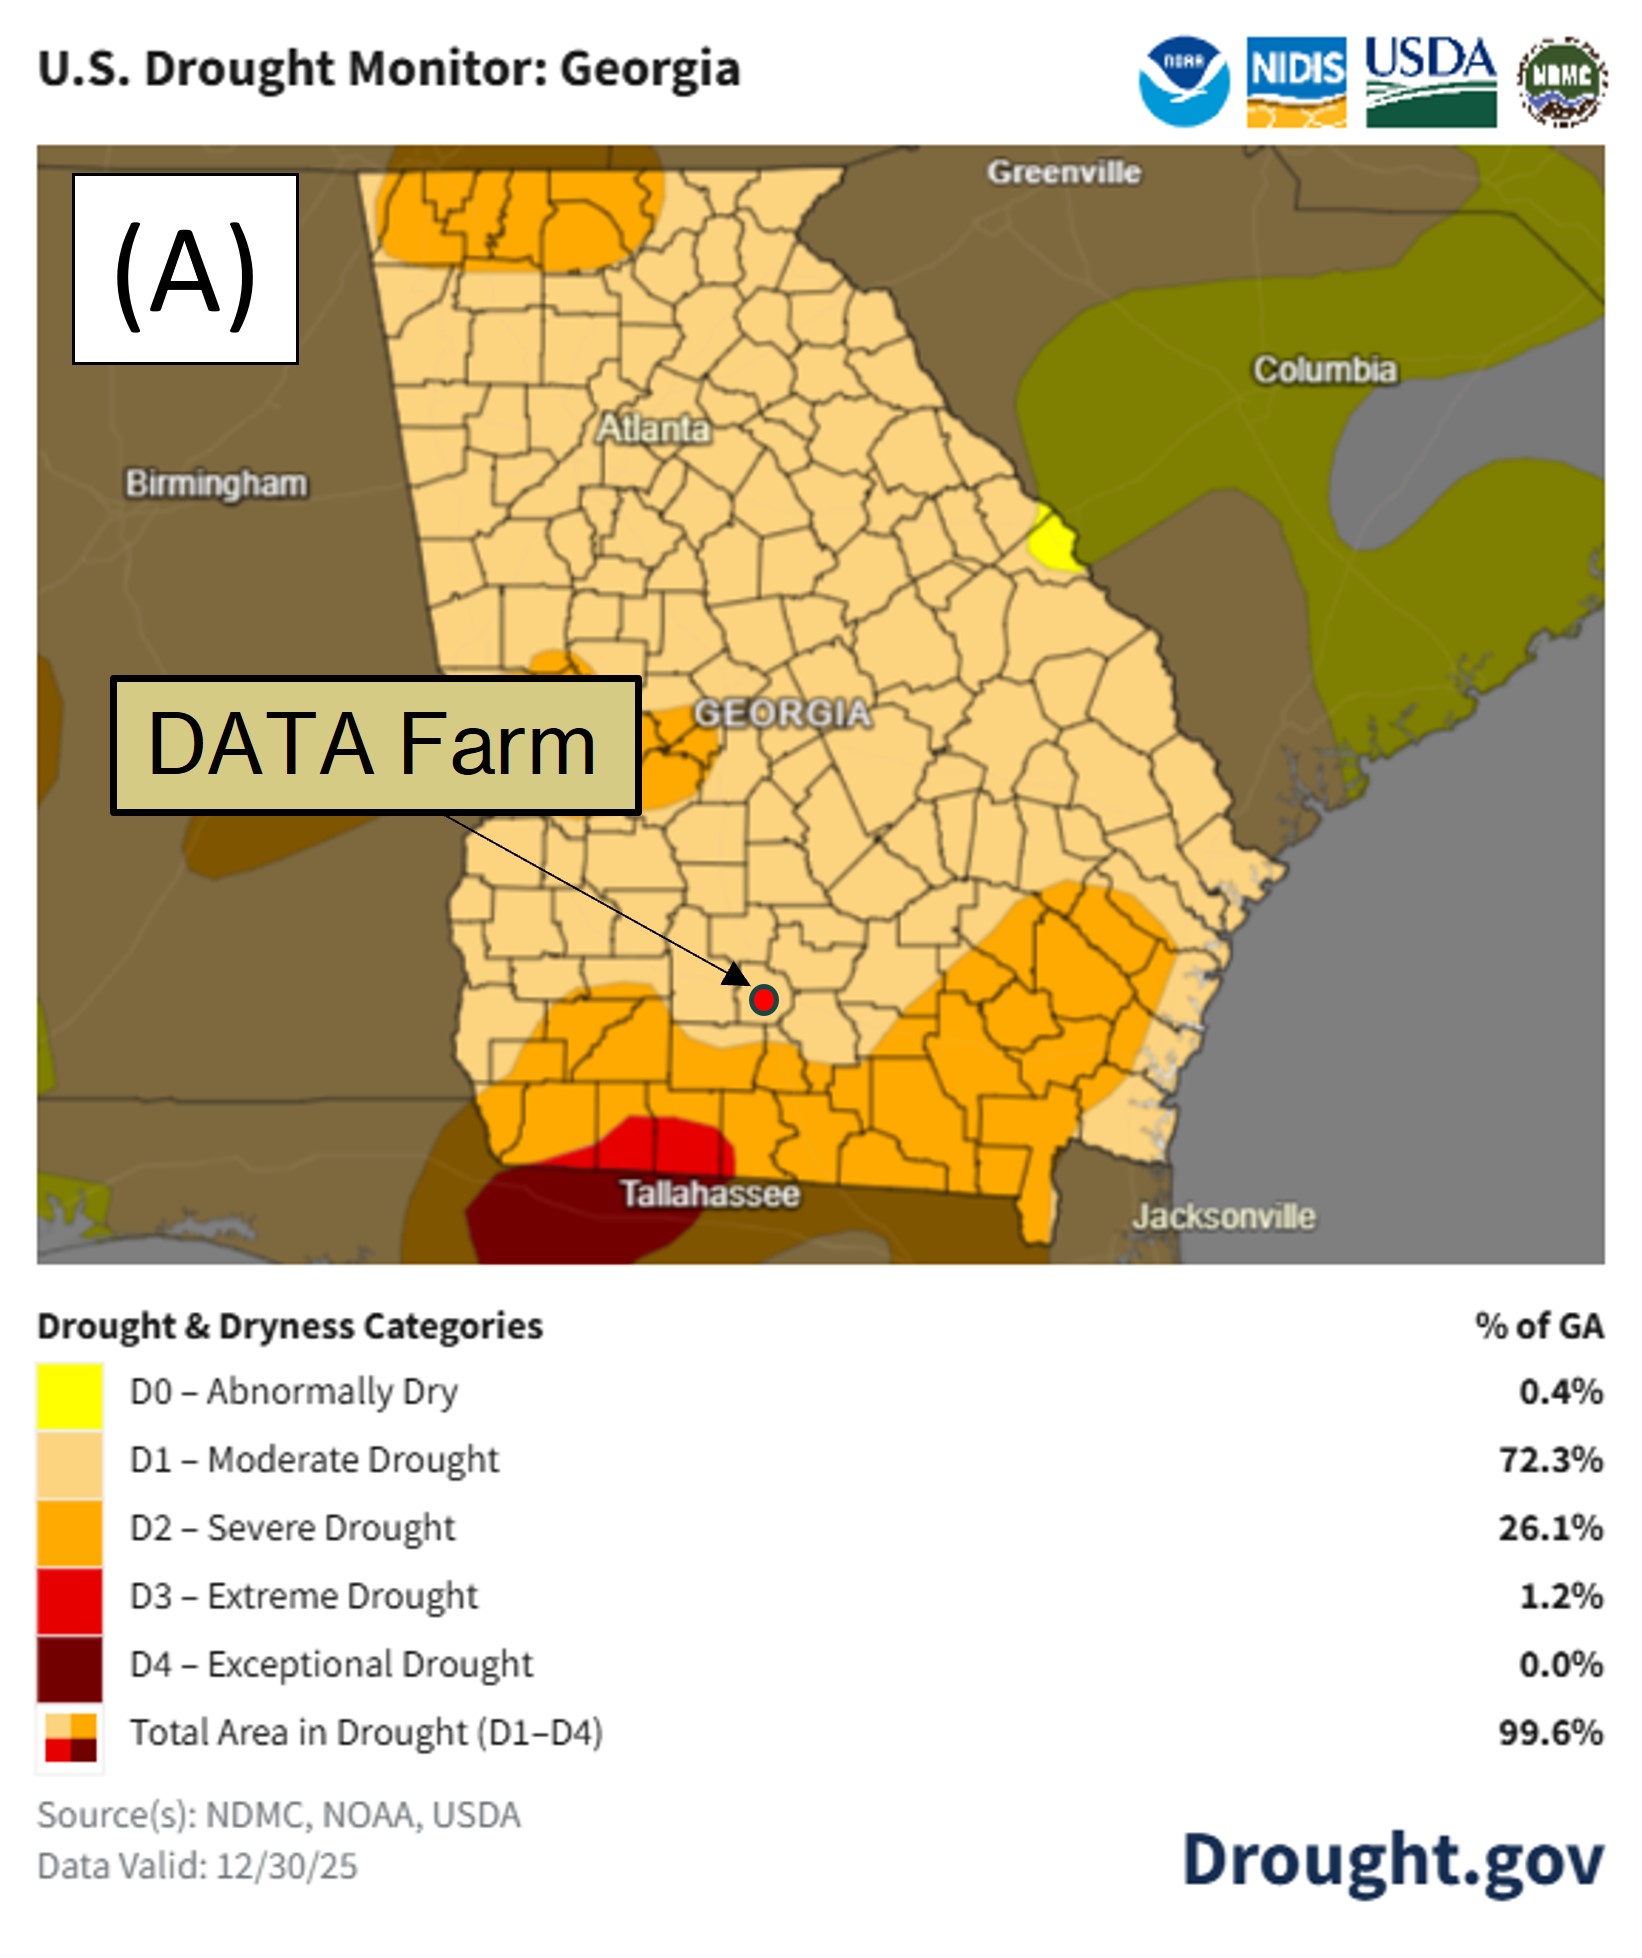
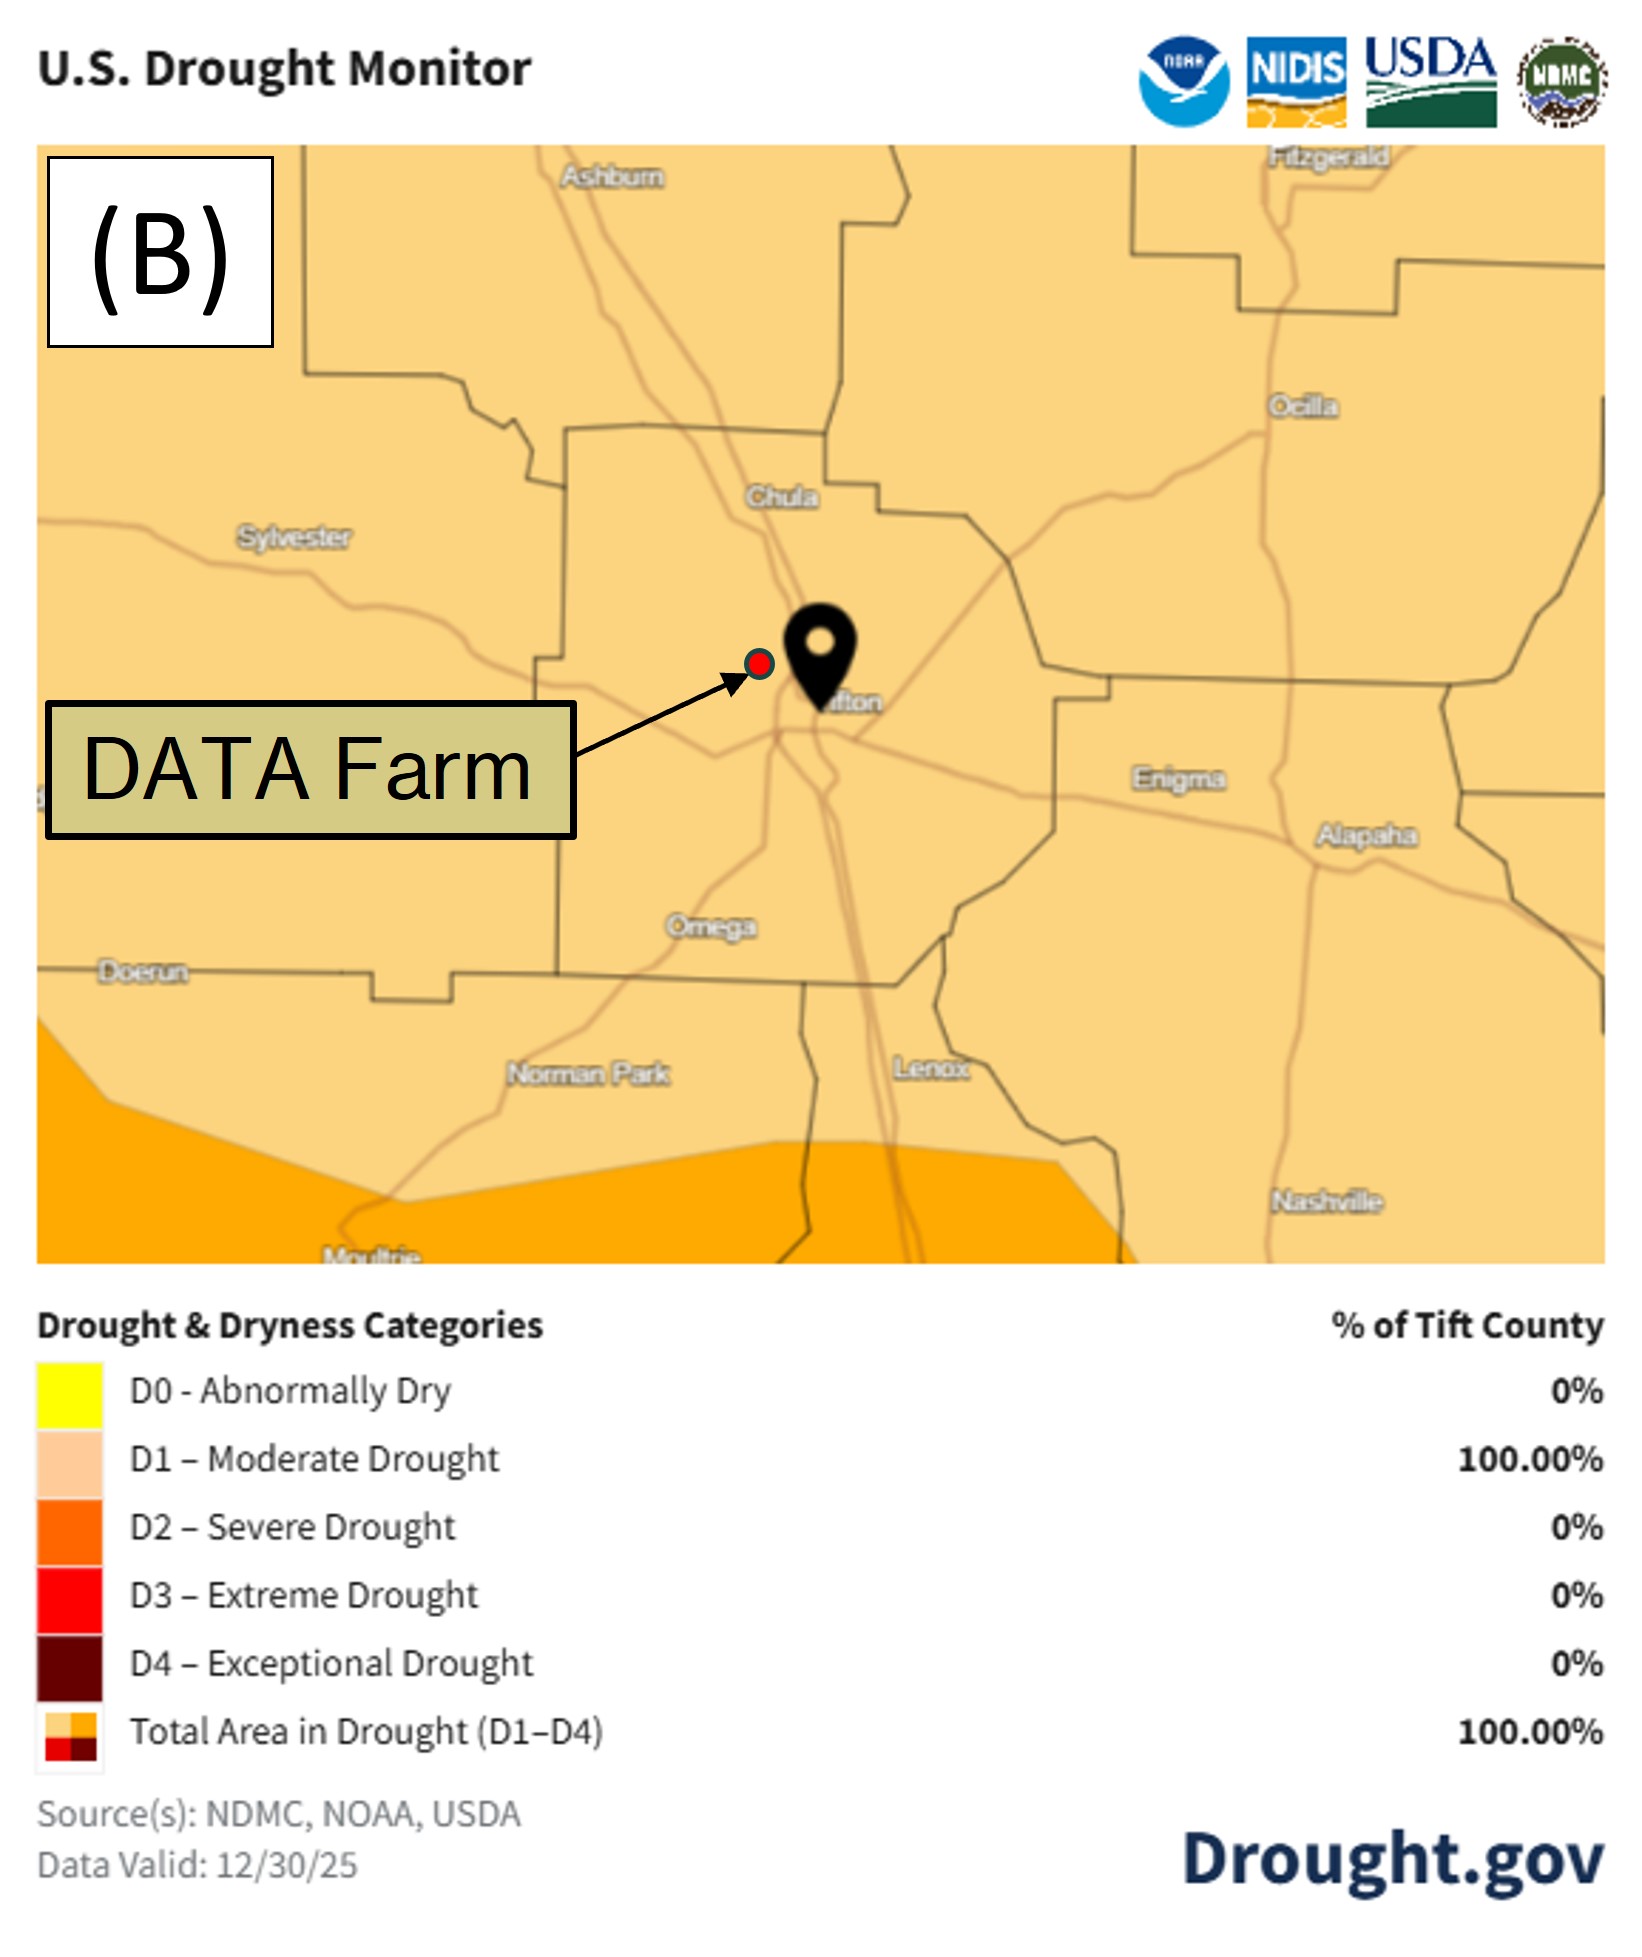
Figure 13A shows the drought monitor map as of December30th, from the National Integrated Drought Information System for Georgia. Abnormally dry conditions are now present in 0.4% of the state,with 72.3% experiencing moderate drought conditions,26.1% experiencing severe drought conditions,and 1.2% experiencing extreme drought conditions. The rainfall early in the month shifted most of the state into moderate drought conditions and eliminated exceptional drought conditions that were present in 4.2% of the state on November 25th. While this rainfall benefittedthe Southwest corner of the state experiencing the worst drought conditions, the total area of the state experiencing drought conditions increased 17.5% from 82.1% at the end of November to 99.6% at the end of December. Figure 13B shows that100% of Tift Countyis experiencing moderate drought conditions. The DATA Farm is located within the area experiencing moderate drought conditions.
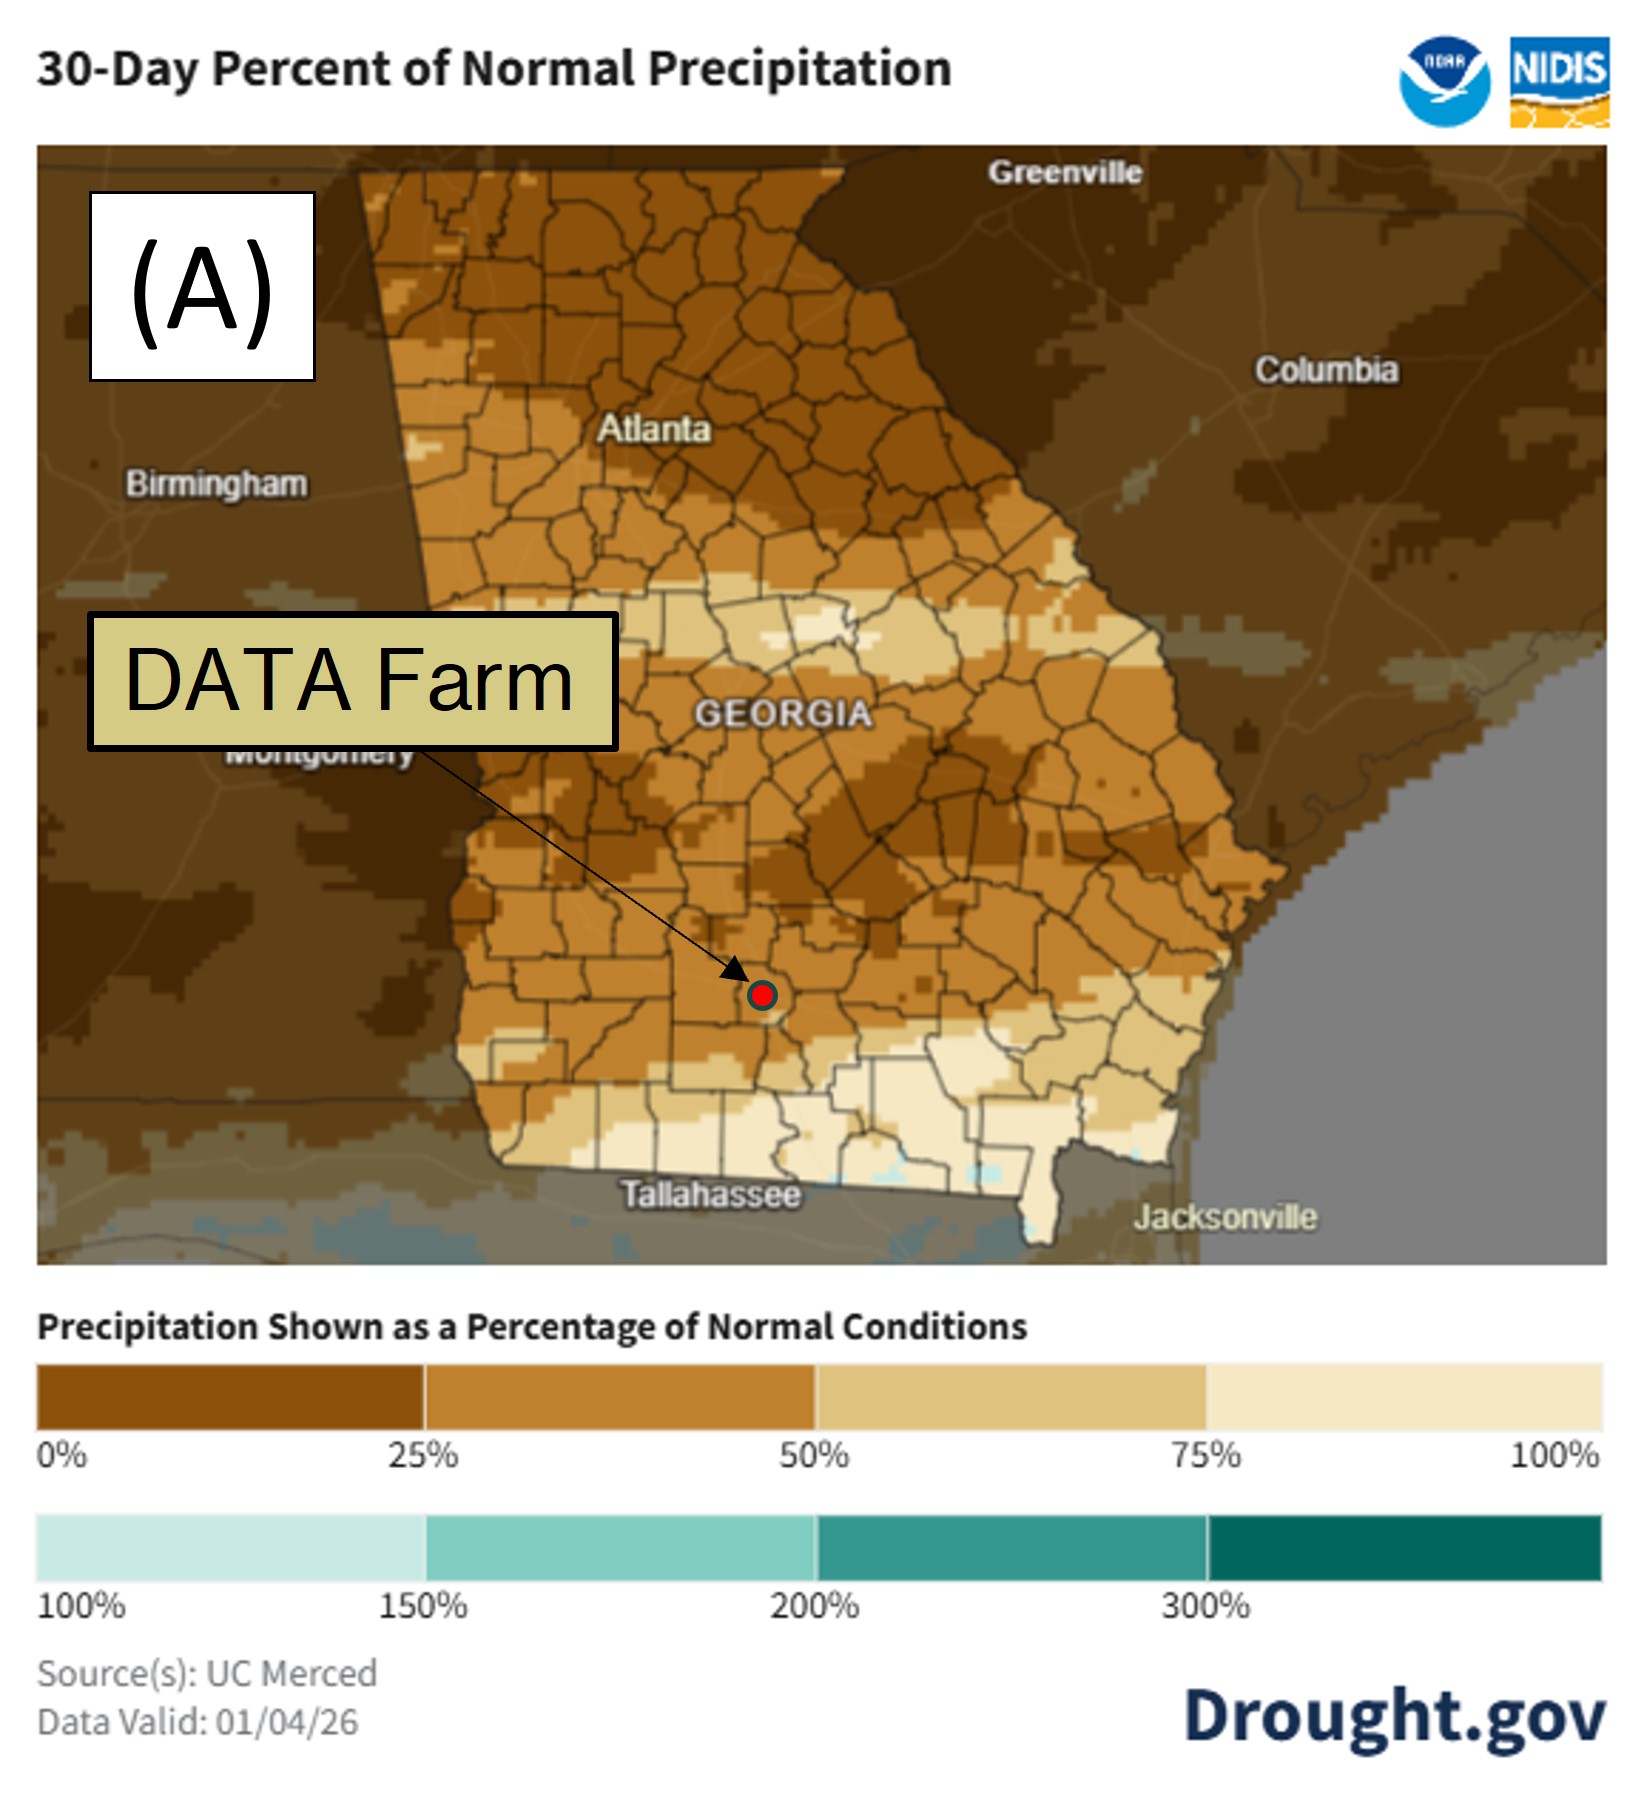
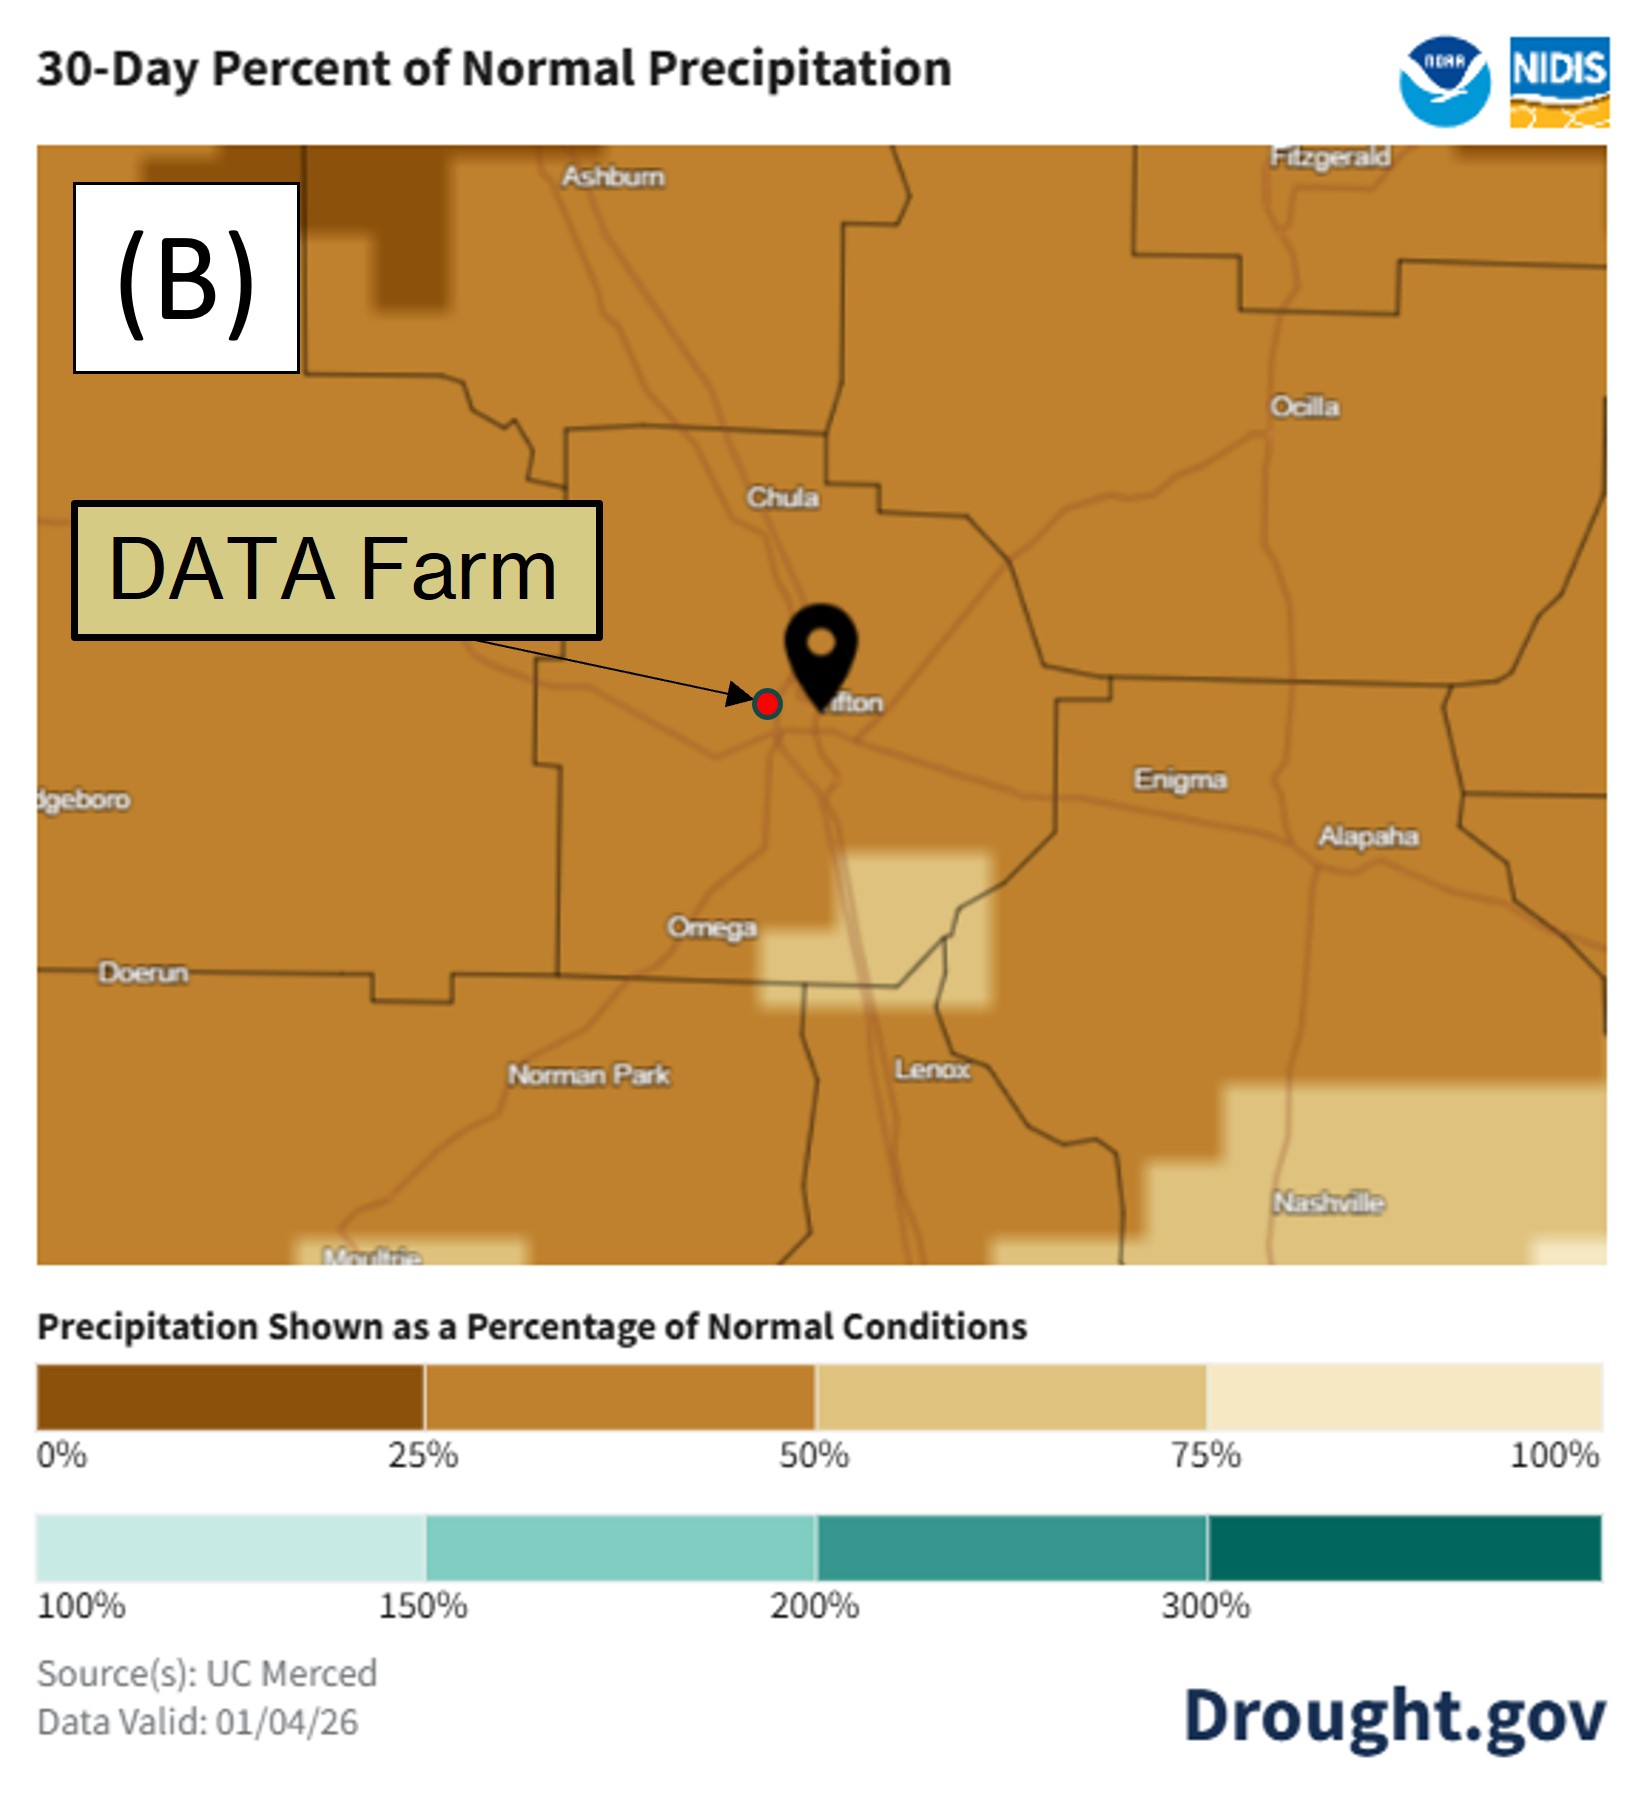
Precipitation trends shown as a percentage of normal conditions (average 1991–2020) for the 30 days prior to January 4th are shown in Figure 14 for Georgia (A) and Tift County (B). These maps show the variation in rainfall received across the state, and that the area around the DATA Farm received between 25% and 50% of normal rainfall during the previous 30 days. The on-site weather station measured approximately 2.8 inches, slightly below average during this period.


