West Field – Cover: Cereal Rye, 57 DAP; 2025 Crop: Dryland Cotton
Recent Activities
December was short on farm activities but long on data analysis in preparation for the 4D Farm Project’s quarterly meeting. With the end of the 2024 season coming to a close, we have been working on data summaries and lessons learned from 2024. This information will be shared during January as detailed field summary reports. A brief snapshot of south pivots 2024 activities is shown in Figure 1. This highlights the extent of data collected from soil sampling at the beginning of the season, continuous soil moisture throughout, and harvest yield data to determine the results of the season.
Figure 1. Example of data collected at the south pivot field for the 2024 growing season at the DATA Farm
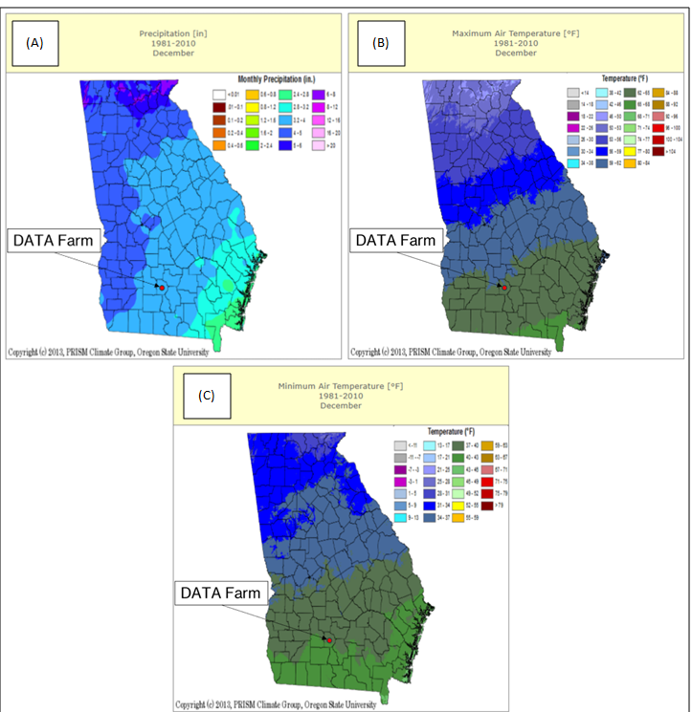
The monthly temperature trends and rainfall recorded by the on-site weather station for December are shown in Figure 2. The cold weather from late November continued into the first week of December, bringing the coldest temperature of fall, with 27°F recorded on December 4th. The rest of the month brought warmer temperatures in the 70s to bring our average temperature to 52°F for the month. Total rainfall was 1.7 inches of rain. For comparison, Georgia climate maps based on data from 1981 to 2010 (UGA’s Weather Network) are shown in Figure 3. The DATA Farm is in the zone showing 3.2 to 4 inches of precipitation (Figure 3A), indicating that the measured 1.7 inches was drier than average. The average maximum and minimum historical temperature ranges for the zone where the DATA Farm is located are 62°F to 65°F and 37°F to 40°F,respectively. With a recorded maximum of 76°F at the DATA Farm, an above-average maximum temperature was observed. The observed minimum temperature was 27°F, which is 10°F below the minimum average range. These above and below average deviations in weather show how variable the weather in December was.
Figure 3. Georgia December average (A) precipitation, (B) maximum air temperature, and (C) minimum air temperature for 1981-2010
Upcoming Month
Operations:1stNitrogen application to ryegrass in South Pivot
Discover more from 4D Farm
Subscribe to get the latest posts sent to your email.