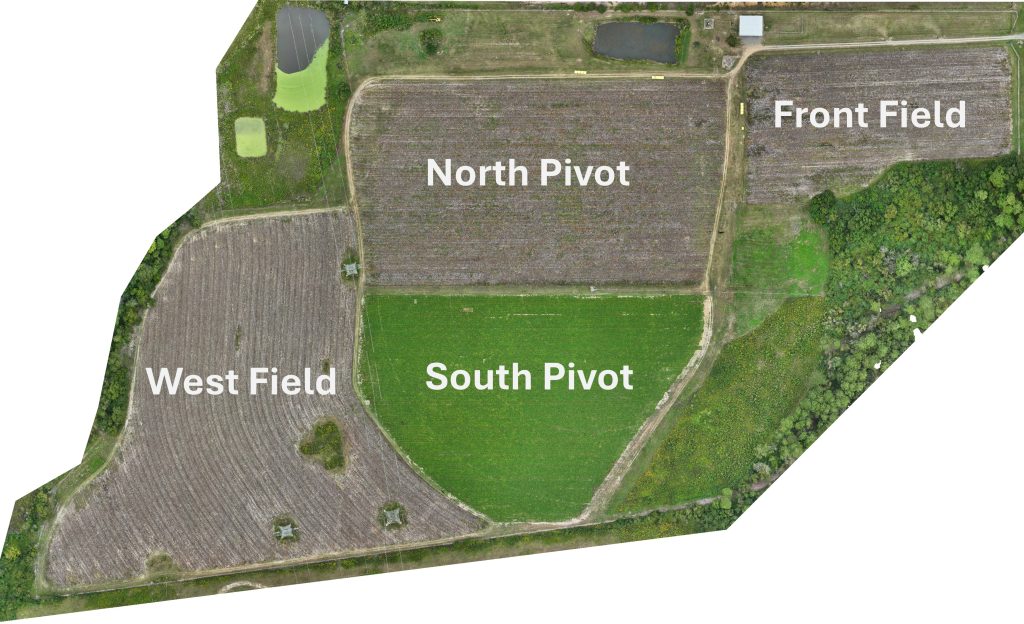
Front Field – Crop: Dryland Cotton, Harvested on 9/23/25 @ 140 DAP
North Pivot – Crop: Irrigated Cotton, Harvested on 9/23/25 @ 140 DAP
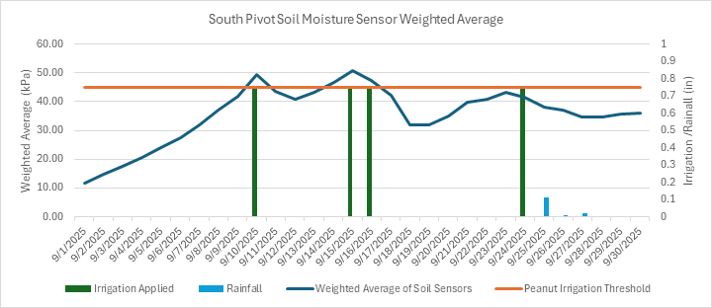
South Pivot – Crop: Irrigated Peanuts, 138 DAP*
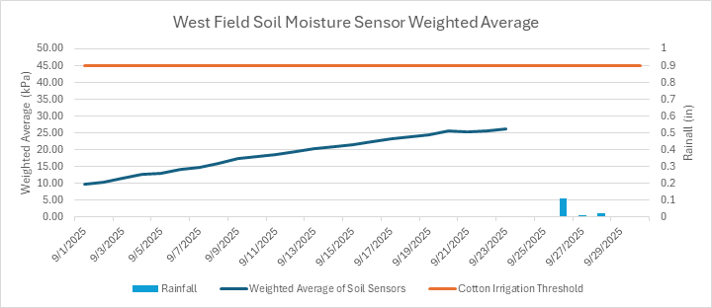
West Field – Crop: Dryland Cotton, Harvested on 9/23/25 @ 140 DAP
*As of 9/1/2025
Overview of Activities
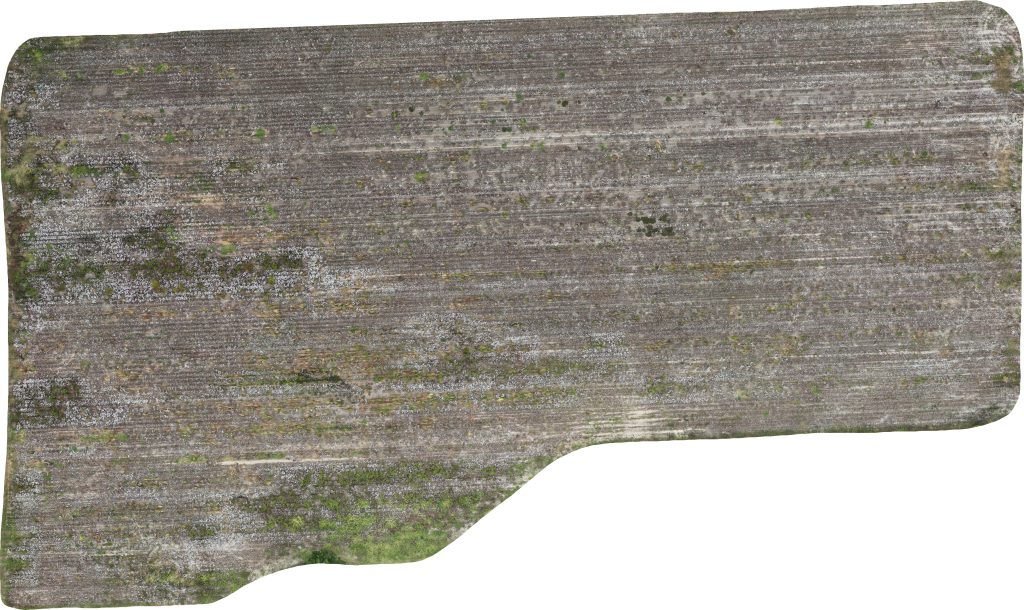
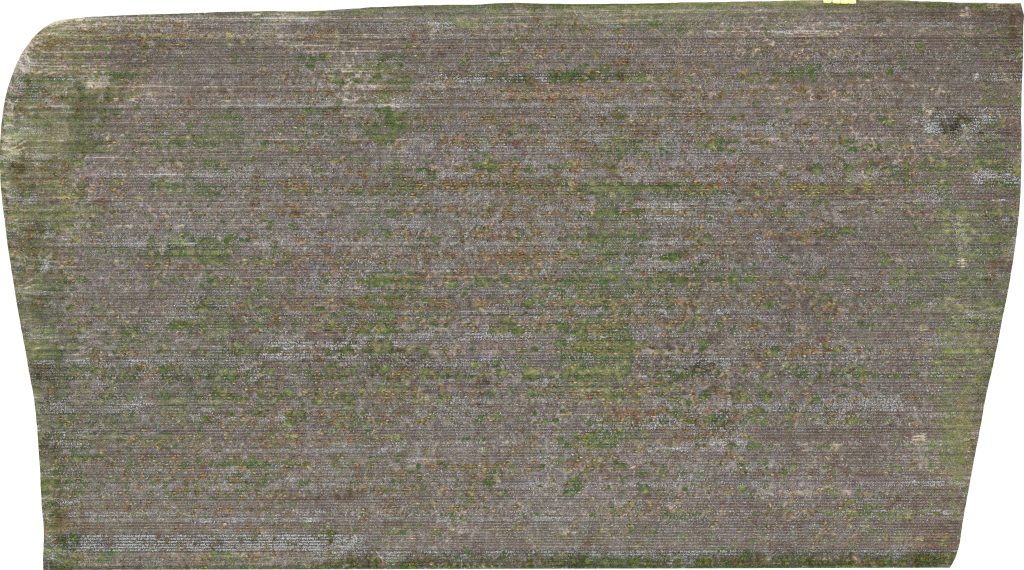
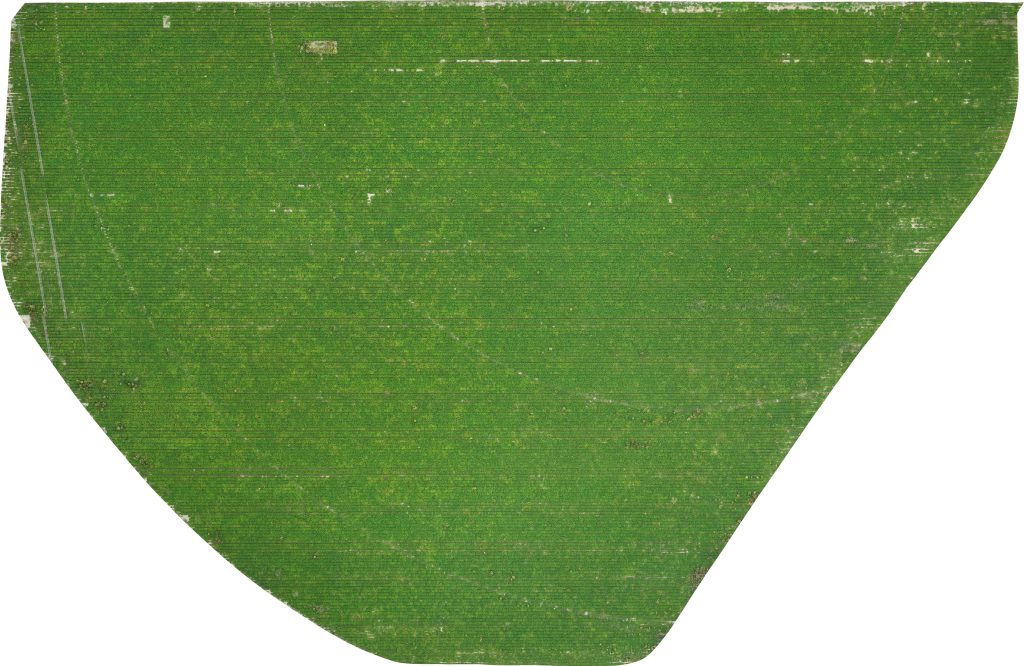
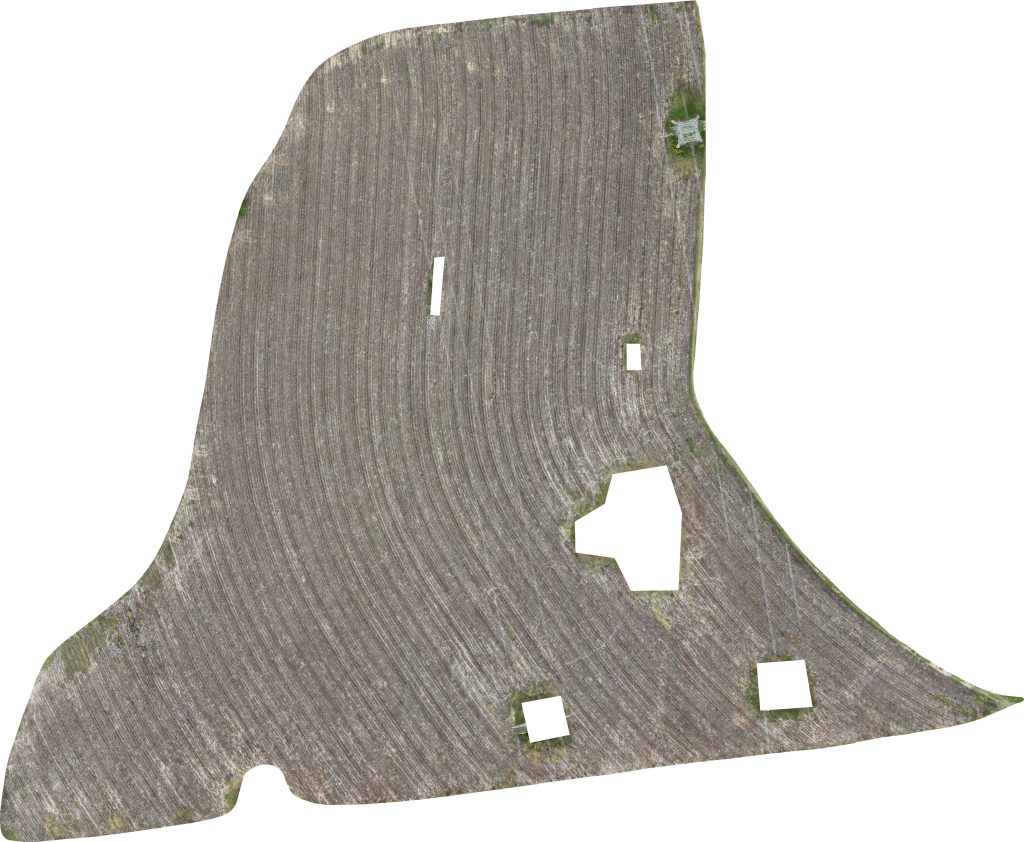
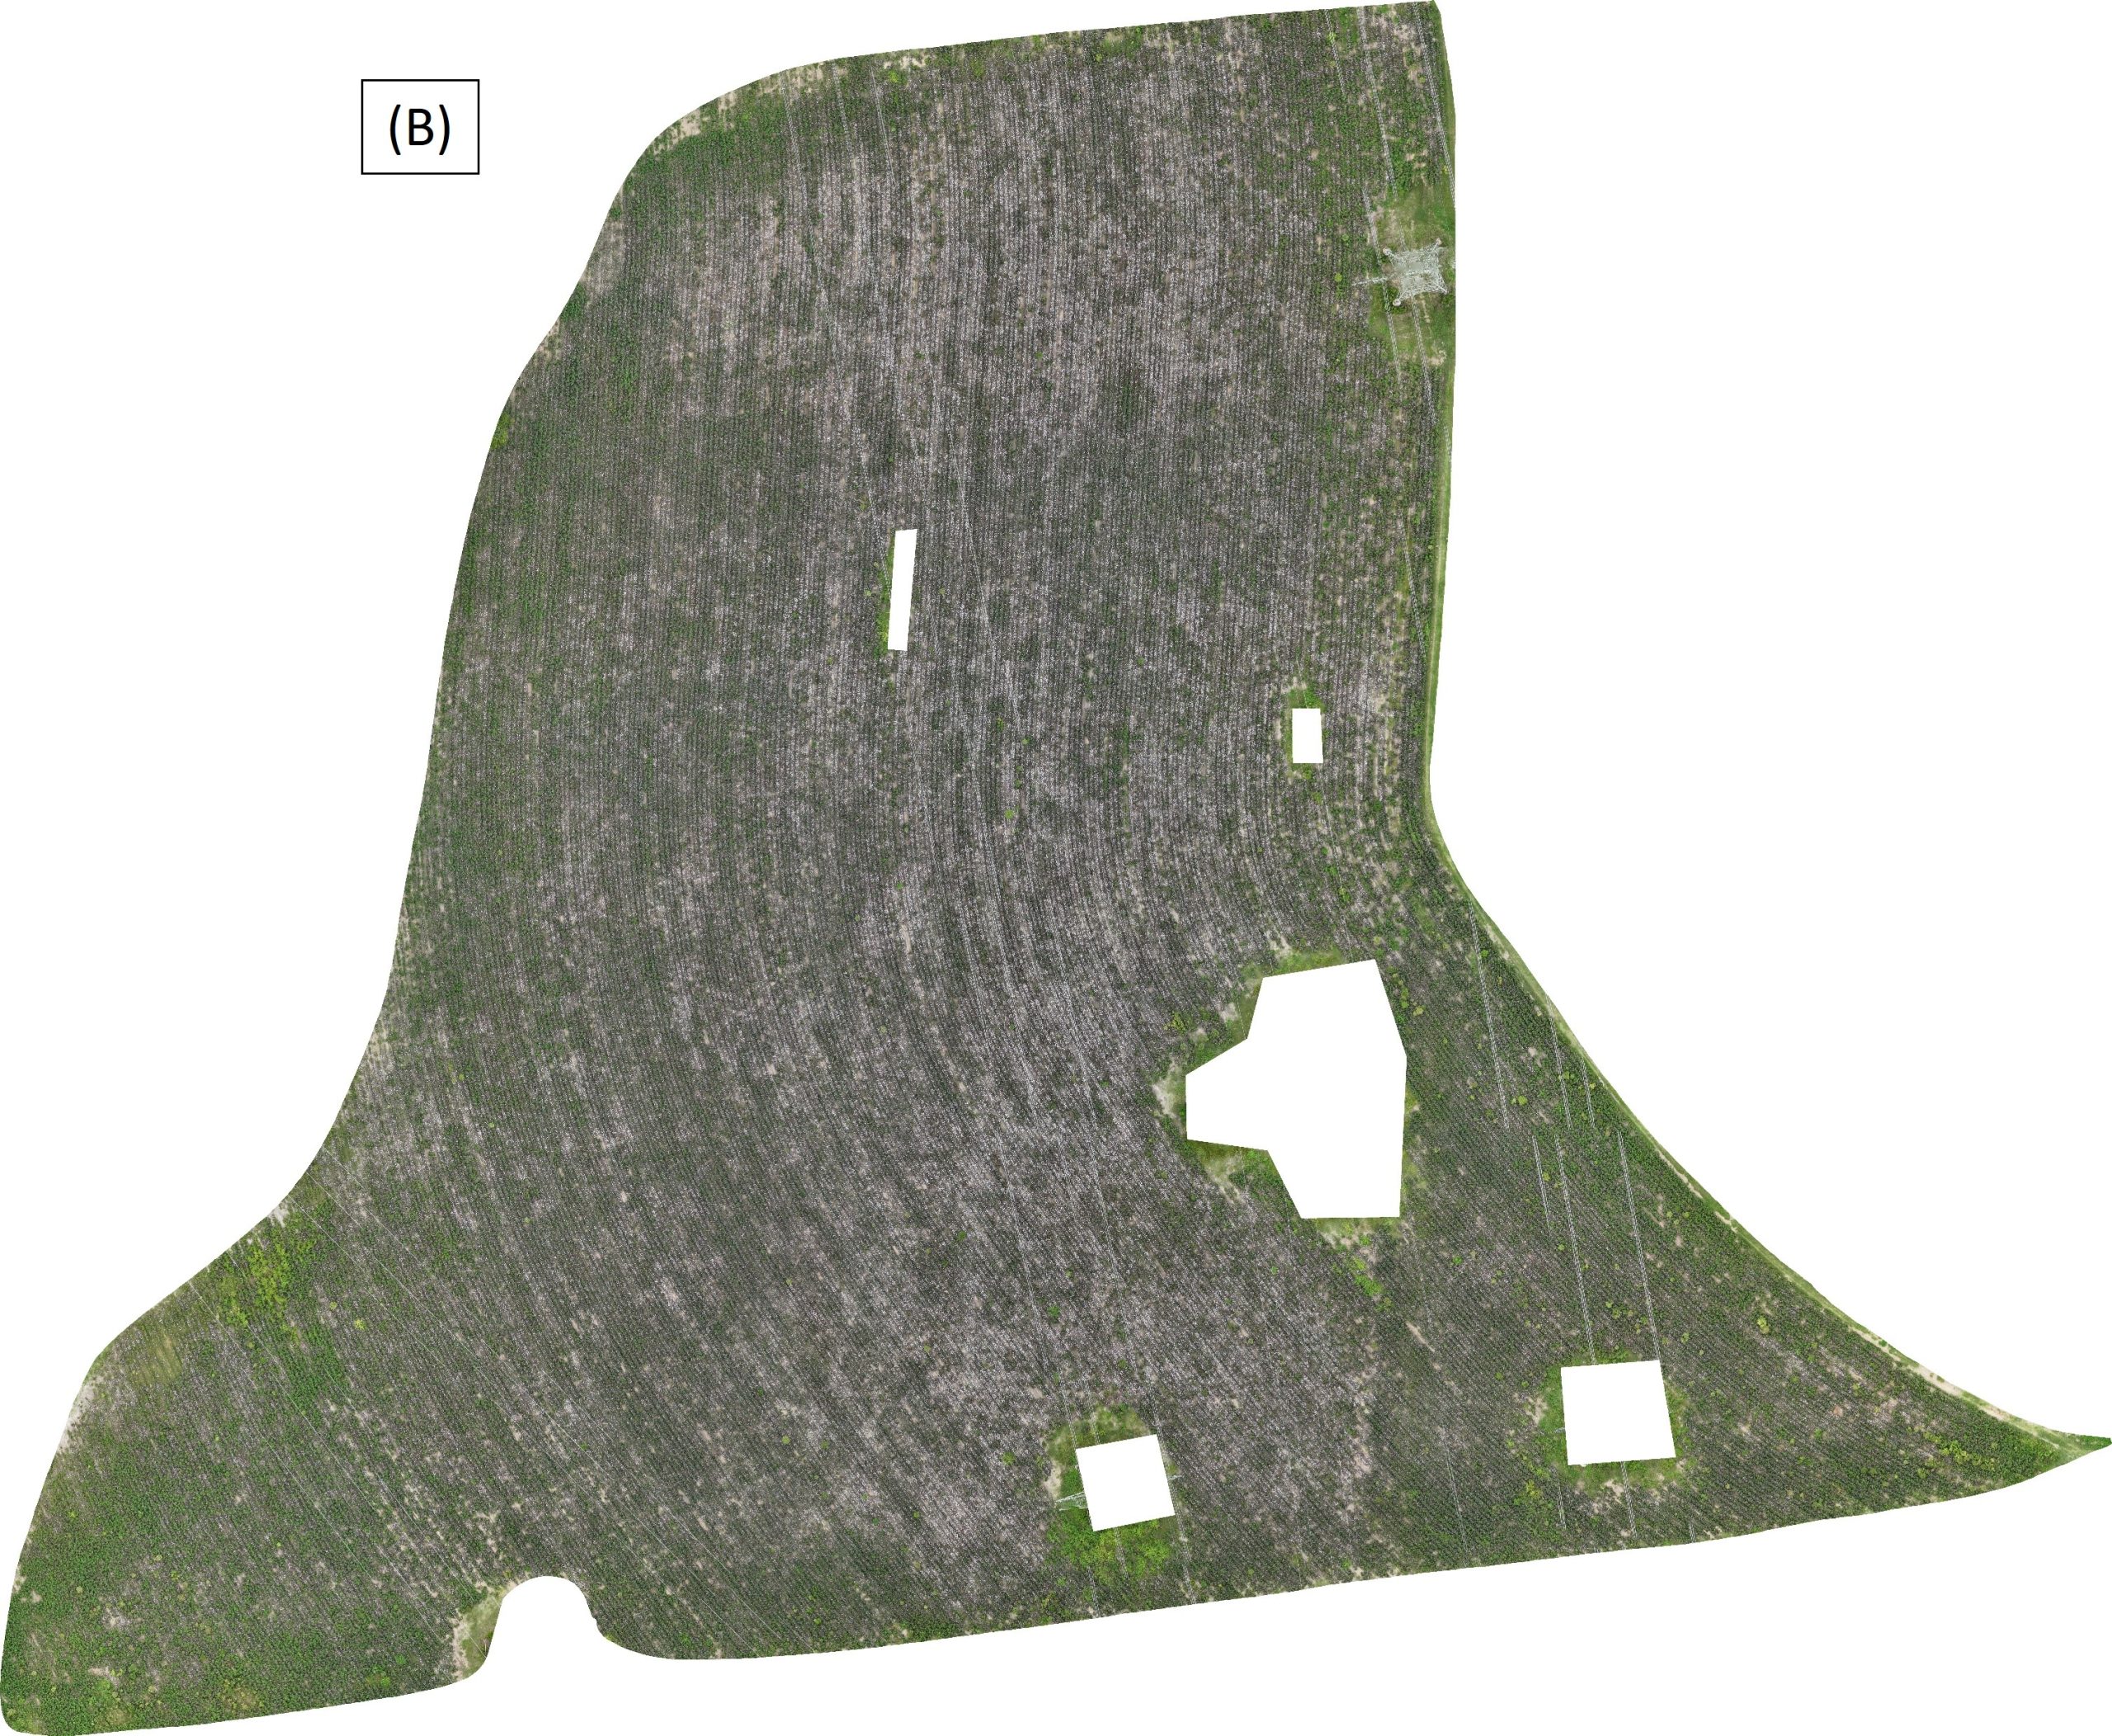
The maturity of the cotton was checked during the first two weeks to determine when to apply the defoliation mixture. A representative from South Central Georgia Gin came out the first week and said most of the cotton was ready, but areas of North Pivot needed more time. The second trip he said North Pivot was further along but still needed some time for late bolls to mature. However, at that time a decision was made to go ahead and defoliate because the cotton in Front Field and West Field was already starting to fall off the plant. On September 16th, a UGA recommended 3-way mix was applied. The mix consistedof ETX (1.5 oz/ac for defoliation), TDZ (3 oz/ac for regrowth control), and Ethephon (40 oz/ac for boll opening). Over the next week, the cotton dropped leaves, and bolls close to maturity opened. The images in Figure 1are overhead images of cotton fields captured on 9/8/25. These images show areas where the Jassids discussed last month caused the cotton plants to shed their leaves prior to defoliation in Front Field(1A) and West Field(1B). Figure 1C shows that the DeltaPine 2038 variety in North Pivot did not shed leaves like the Delta Pine 2127 variety in the other two fields even though the Jassid population was also high.
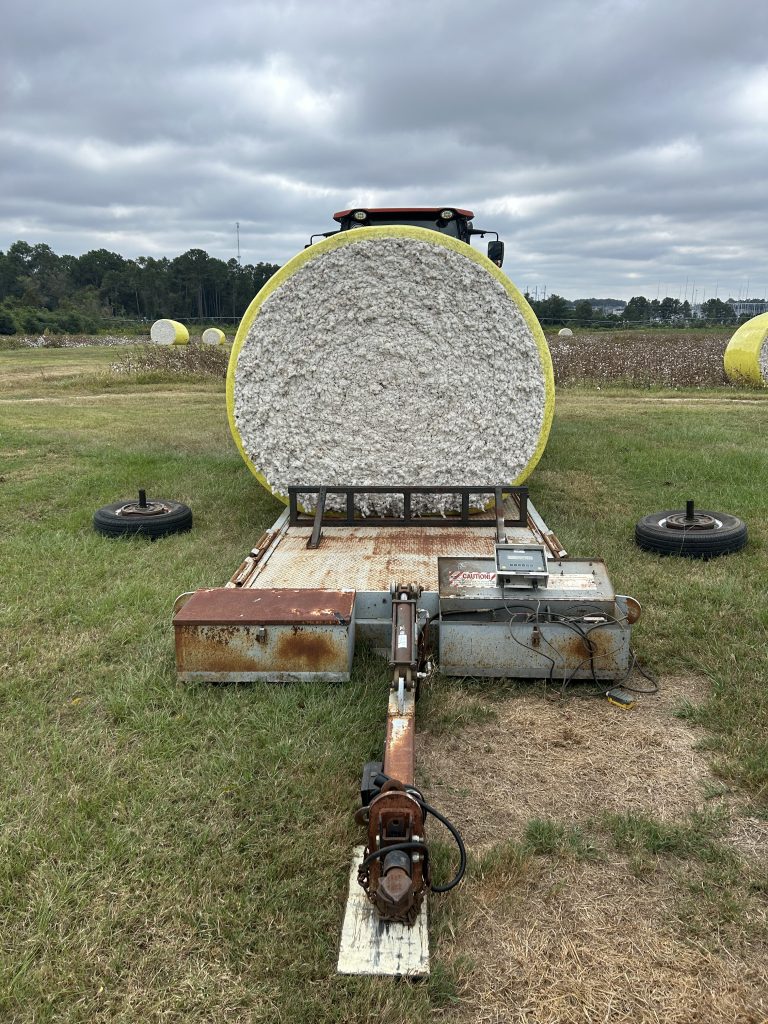
During mid to late September, the dry, windy weather kept the cotton in good condition for picking. The decision to harvest was made on 9/23 due to the weather forecast indicating rain chances on 9/25 and the gin’s availability to pick the cotton. The gin brought a John Deere CP770 roller picker(Figure 2) with a functioning yield monitoring.
After harvest, yield data and individual roll module weights were retrieved from the monitor. To verify the weight measured by the cotton picker, certified scales from the UGA Micro-Gin (Figure 3) wereused to weigh each roll module when they were staged for pickup.
Figure 3: UGA Micro-Gin scales weighing roll modules
The results are presented in Table 1 and showed an average of 6% overestimation of module weight by the cotton picker’s tailgate scale. This data will be used to reverse calibrate the yield map created by the flow sensors of the cotton picker during analysis this fall.In the table a rough estimate of lint yield is calculated using an estimated turnout of 39% lint per pound of raw seed cotton.
Table 1: Cotton roll module weights
Field
Module
Moisture
Picker Scale Weight
UGA Scale Weight
Difference
% Difference
%
Lbs
Lbs
Lbs
Front
1
10.1
6,003
5,790
213
4
Front
2
8.5
5,860
5,570
290
5
Front
3
10.2
3,600
3,260
340
9
Front Total
15,463
14,620
843
5
North Pivot
1
10.6
6,288
5,885
403
6
North Pivot
2
10.7
6,191
5,845
346
6
North Pivot
3
10.7
6,166
5,885
281
5
North Pivot Total
18,645
17,615
1,030
6
West
1
10.6
5,952
5,685
267
4
West
2
9.6
5,734
5,365
369
6
West
3
9.1
5,613
5,160
453
8
West
4
8.8
5,613
5,160
453
8
West
5
9.0
5,805
5,435
370
6
West
6
9.1
5,897
5,455
442
7
West
7
9.9
5,966
5,545
421
7
West Total
40,580
37,805
2,775
7
Farm Total
74,688
70,040
4,648
6
Table 2: Cotton yields estimates
Field
Scale Weight (lb)
39% Lint Yield (lb)
Bales
Area (ac)
Yield (Ba/Ac)
Front
14,620
5,702
11.9
6.2
1.9
North Pivot
17,615
6,870
14.3
14
1.0
West
37,805
14,744
30.7
16
1.9
Farm
70,040
27,316
56.9
36.2
1.6
Figure 4 shows one set of roll modules arranged for a truck to pick up and transport to the gin for processing. The DATA Farm produced 12 ½ roll modules from both Front Field, North Pivot and West Field.
Figure 4: Round modules arranged for transport
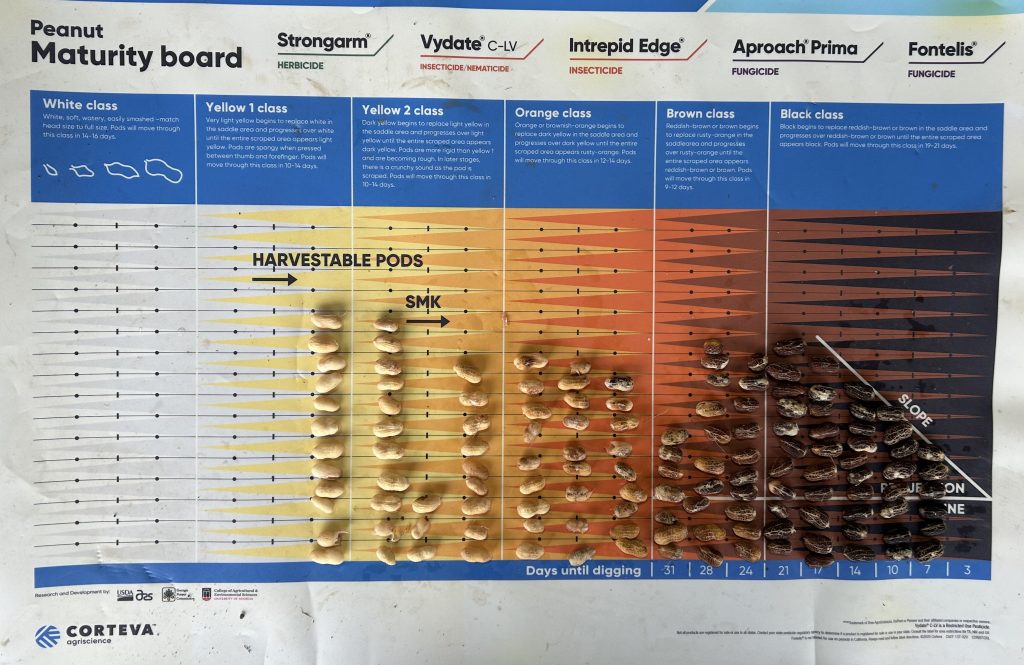
On September 26th samples were pulled from South Pivot and blasted with a pressure washer to remove the exocarp layer of the shell. This reveals a colored layer that can be used to gauge maturity. The pods progress from whiteto yellow, to orange, to brown,then to black for final maturity. A peanut maturity board is used by arranging 200 peanuts (without exocarp) by color to determinethe optimal timing for inverting the peanuts for harvest. Figure 5 shows the peanut sample from South Pivot arranged on the maturity board. The results indicate that we are 7 days away from inverting the peanuts for harvest, aligning with our target of 140-DAP.
Figure 5: Peanut maturity board with sample from South Pivot
Weather
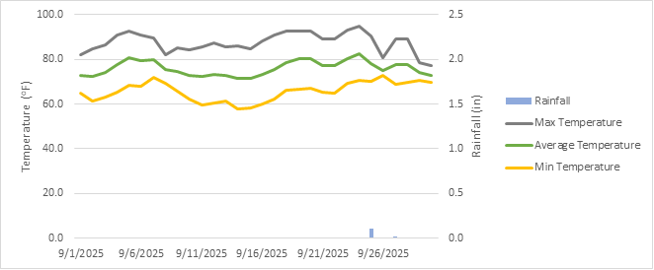
The monthly temperature trends and rainfall recorded by the on-site weather station for September are showninFigure6.
Figure 6: Monthly weather for September 2025.
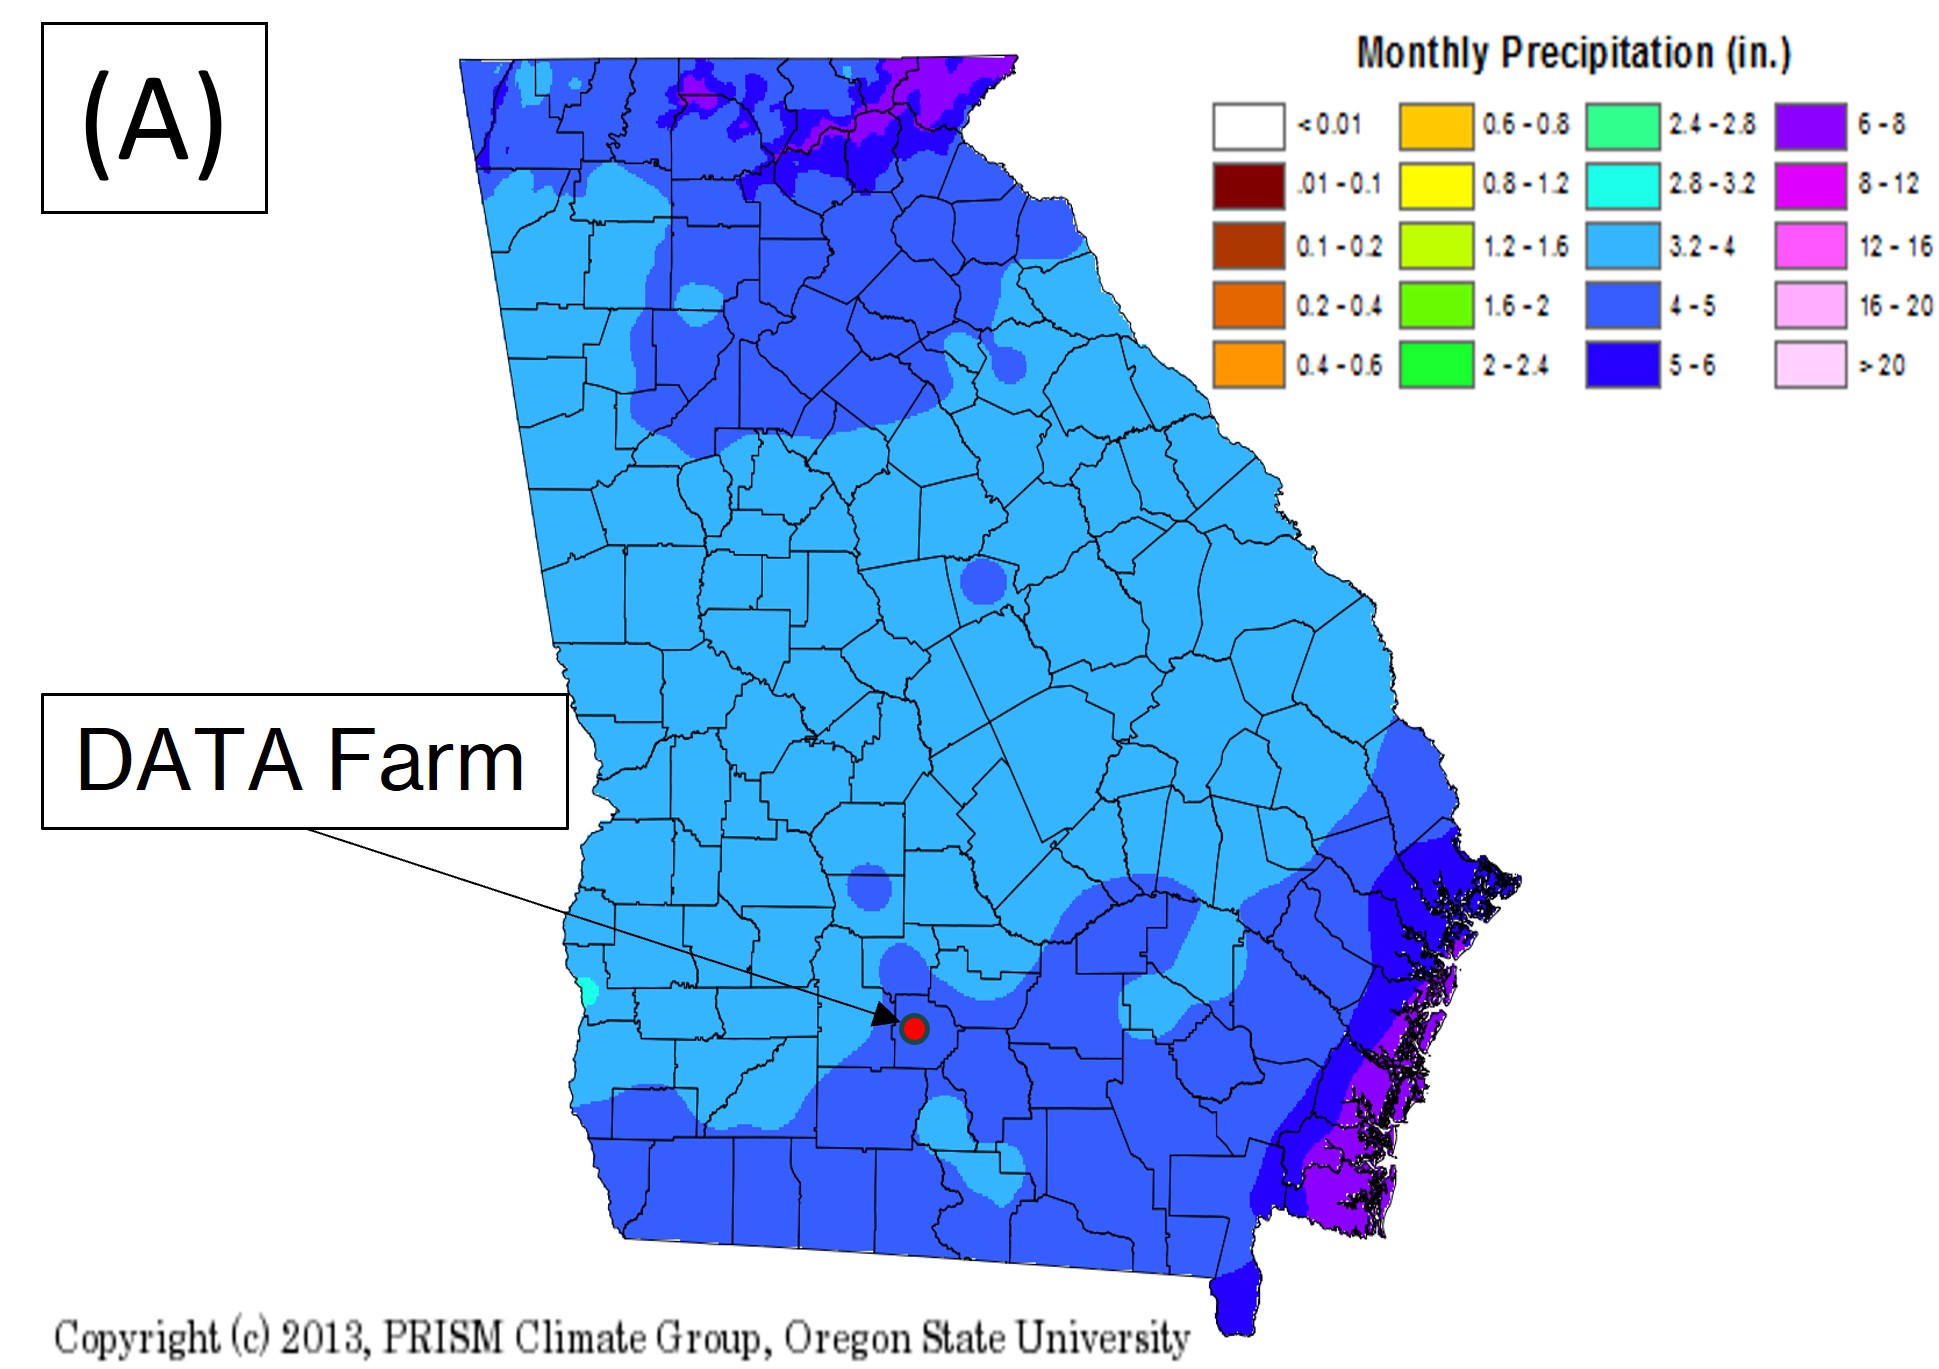
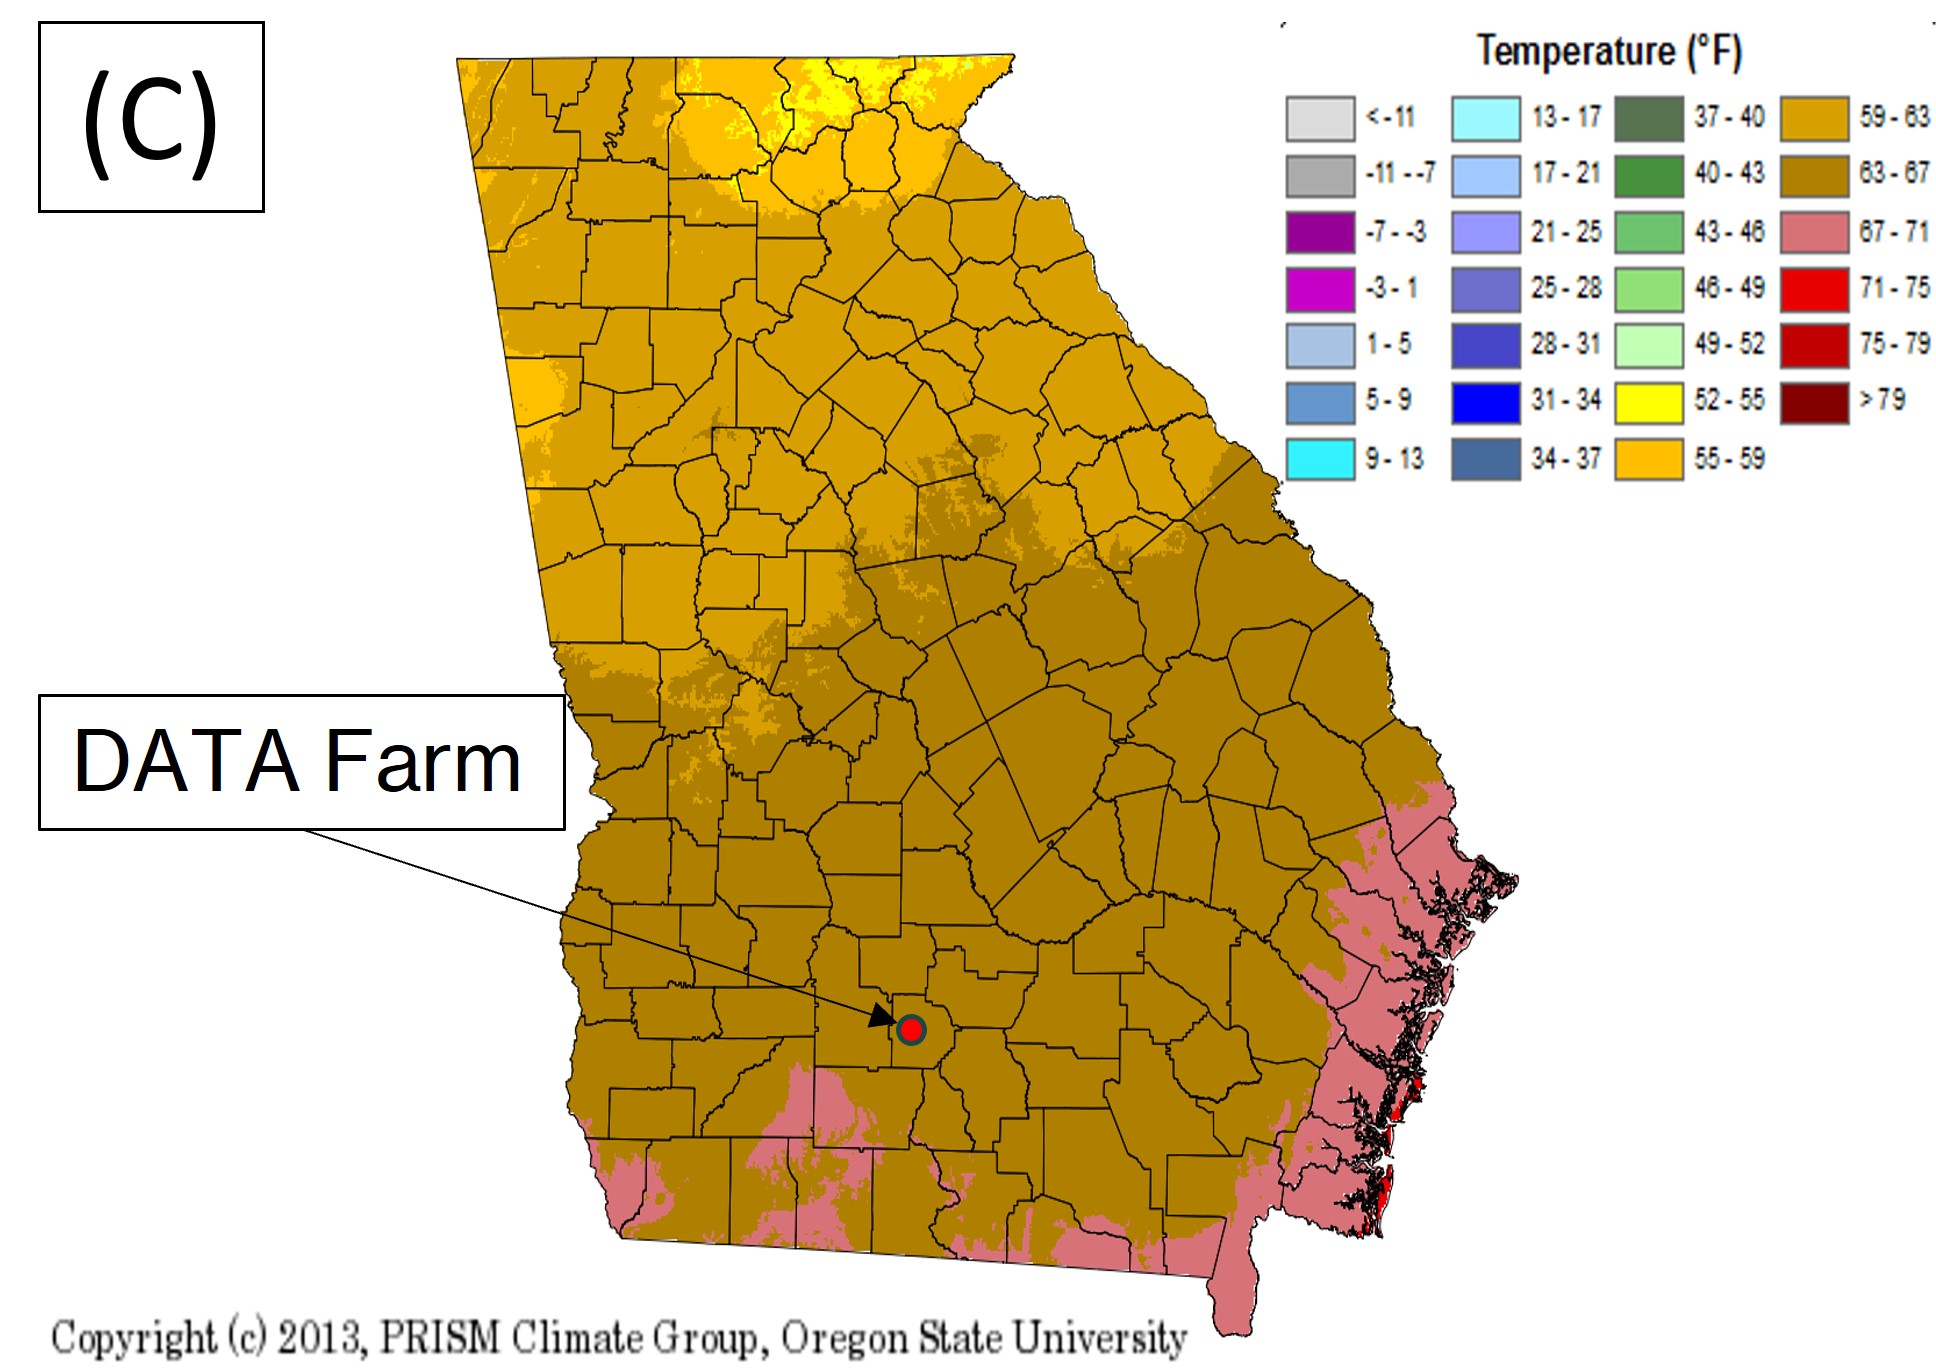
For historical comparison, Georgia climate maps based on data from 1981 to 2010 (UGA’s Weather Network) are shown in Figure 7 for the month of September.
The biggest weather impact on crops during September was the lack of rainfall. Only 0.14 inches of rainfall was recorded at the DATA Farm during September, far below the average (4 to 5 inches) for this period. The lack of precipitation coupled with low humidity stressed the peanut crop causing the soil sensors in South Pivot to hit the 45 kPa trigger point for irrigation four times. Irrigation applied only reset the shallow and middle soil sensors, but not the deep sensors. On 9/15 and 9/16, irrigation was triggered back-to-back to increase soil moisture such that the sensors’ readings go below the trigger point. Even though the weighted average dropped below 45 kPa, the deep weighted average stayed above 75 kPa. An extension article titled “End of Season Irrigation Considerations” was posted on September 26th by Dr. West Porter’s group addressing this situation. The article highlights how critical it is to plan ahead during drought conditions and not fall behind with irrigation as the crops are maturing.
The average of recorded maximum temperatures for the month was 88°F, which is on the upper end of the average historical range of 84°F – 88°F (Figure 7B), and the average of recorded minimum temperatures was 66°F, which is also in the upper end of the average historical range of 63°F – 67°F (Figure 7C). September temperatures were lower than August’s temperatures, continuing the cooling trend for the rest of the season. This results in fewer growing degree units (GDUs) each day from now until harvest. Timing of planting is imperative to ensure the crops receive enough growing degree units (heat units) to develop and mature properly.
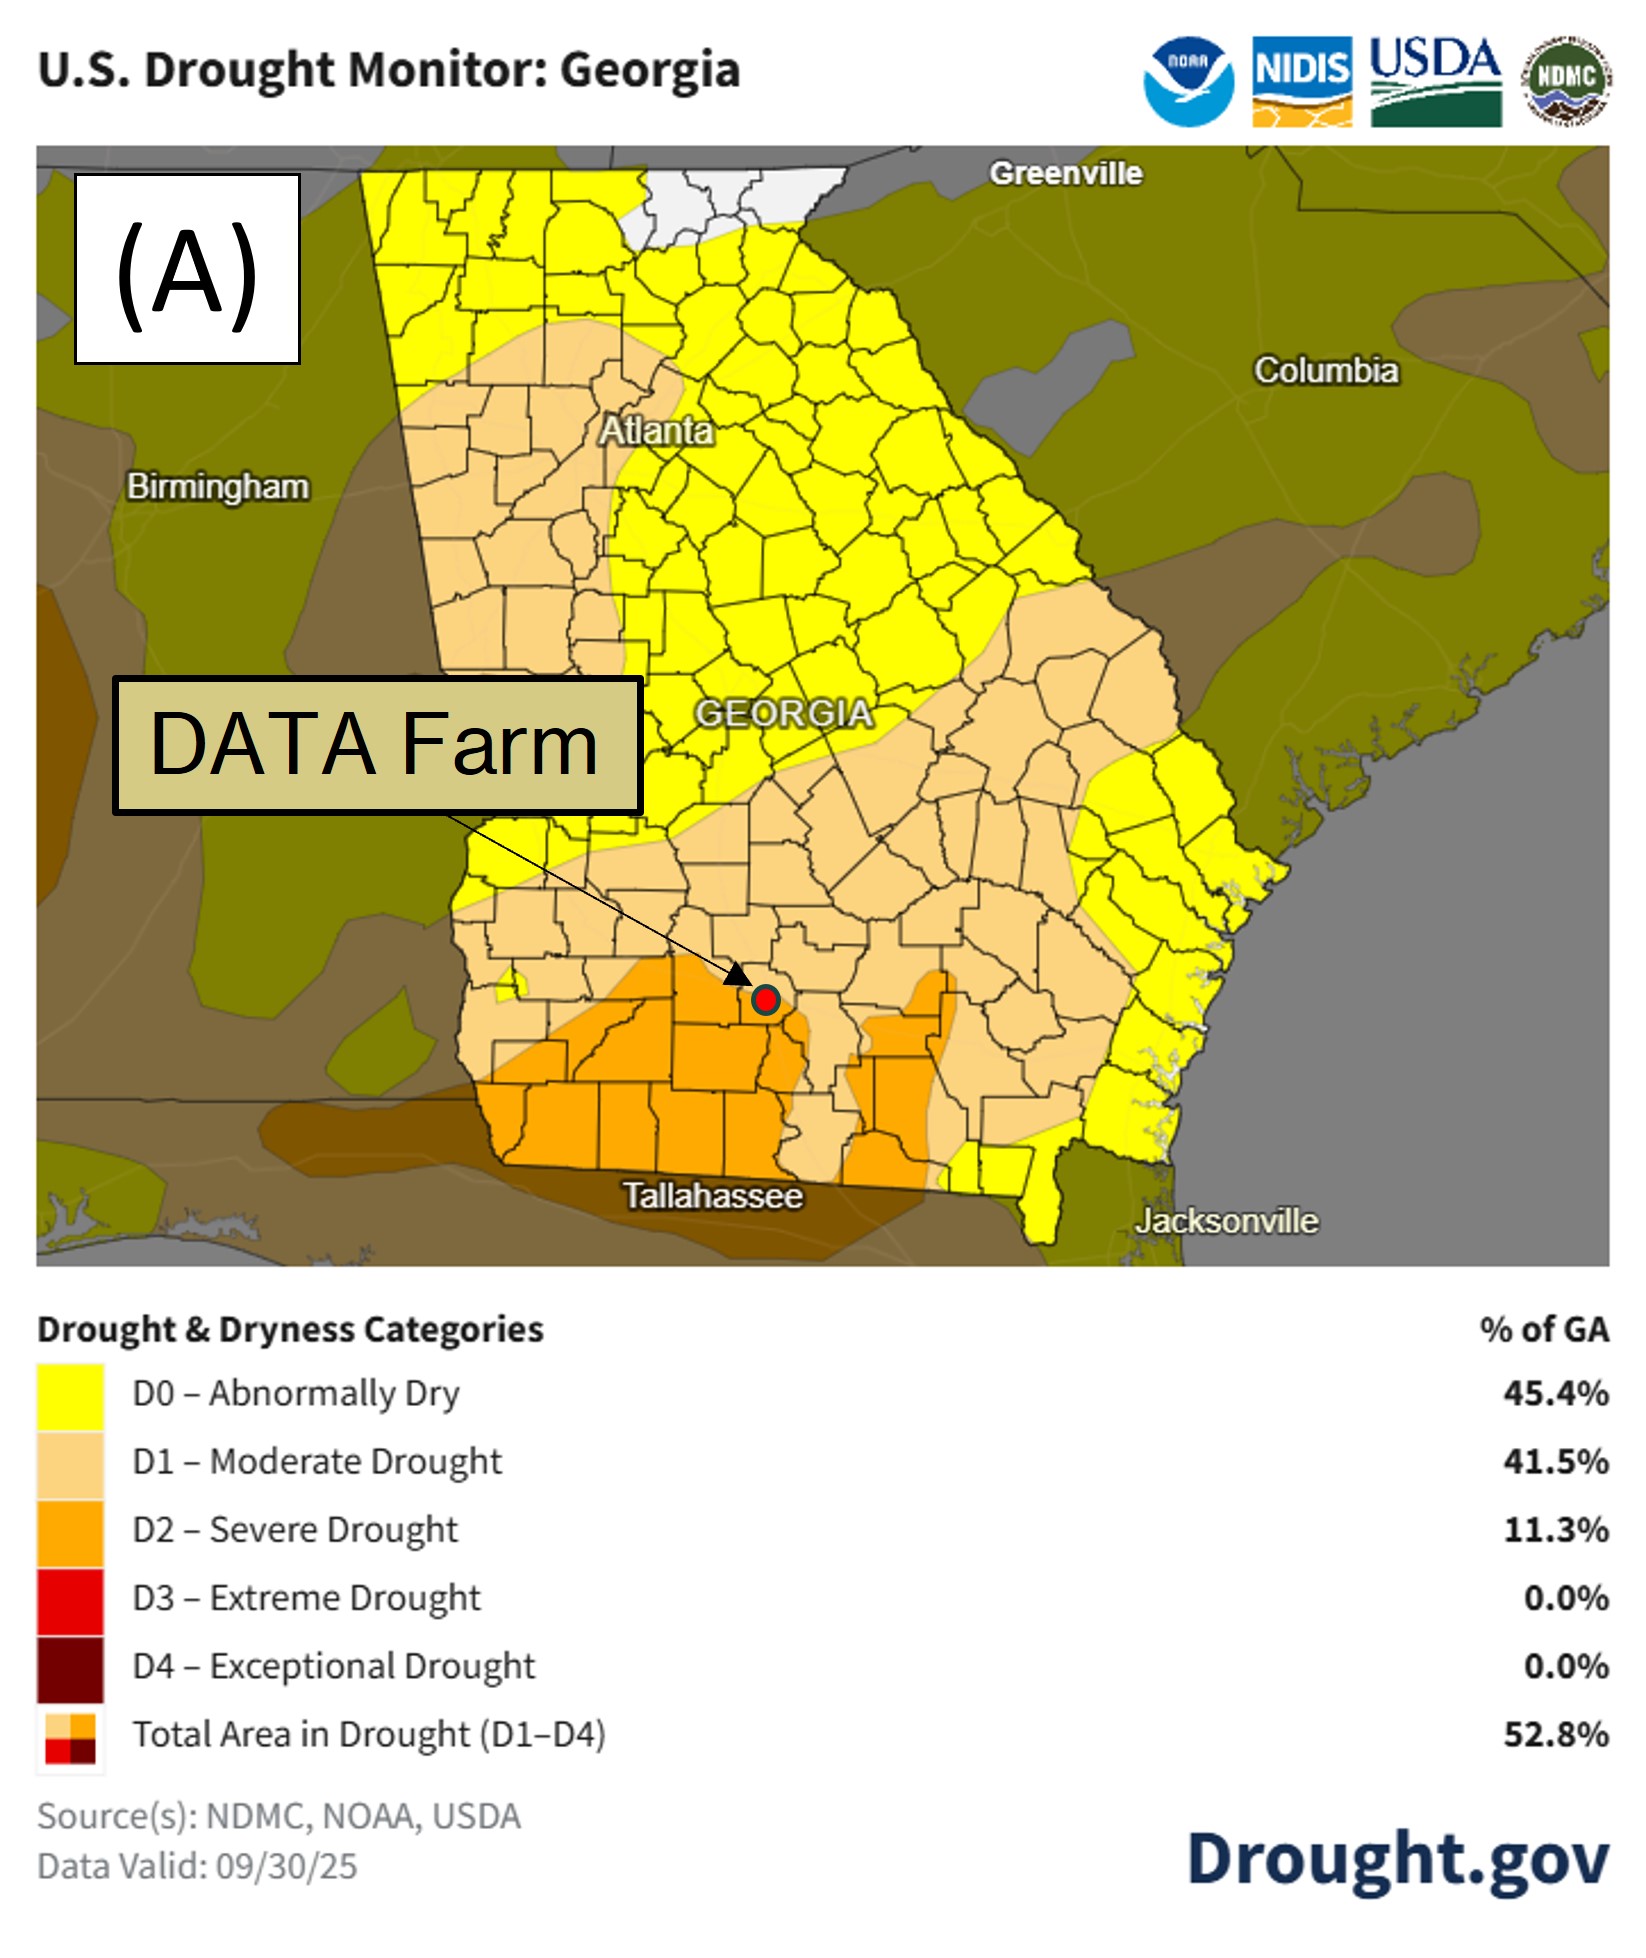
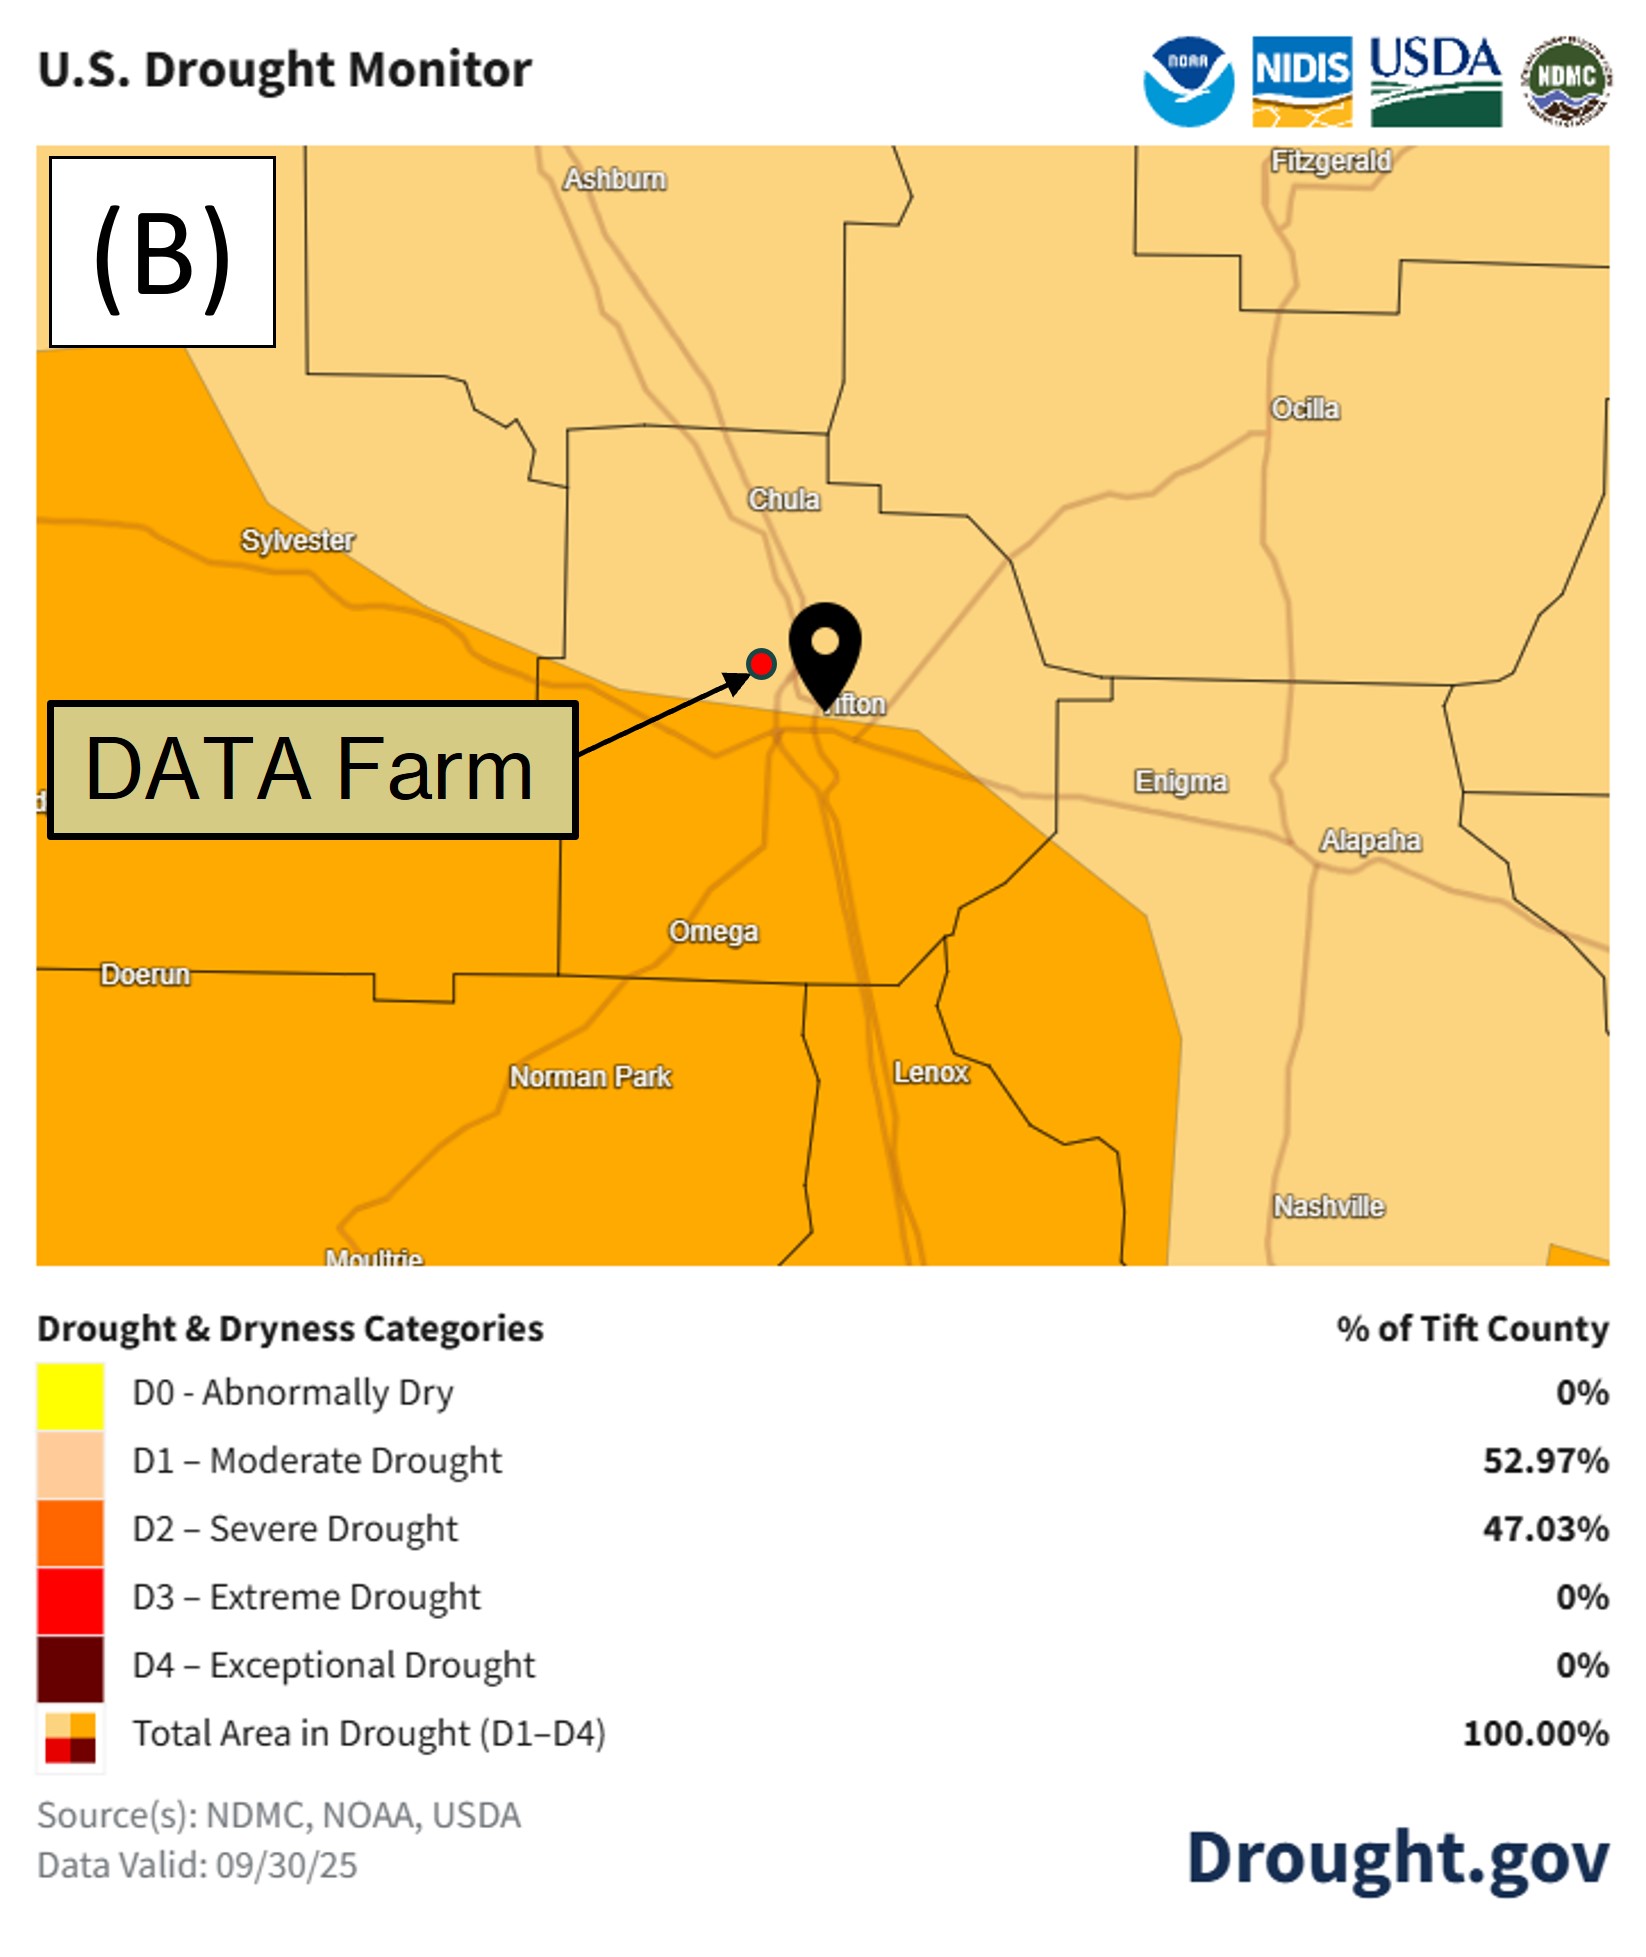
Figure 8A shows the drought monitor map as of September 30th, from the National Integrated Drought Information System for Georgia. Abnormally dry conditions are now present in 45.4% of the state,with 41.5% experiencing moderate drought conditions, and 11.3% experiencing severe drought conditions. Figure 8B shows Tift County is split between moderate drought (52.97%) and severe drought (47.03%) conditions. These dry conditions for the month were good for harvest, but not for finishing crops to maturity.
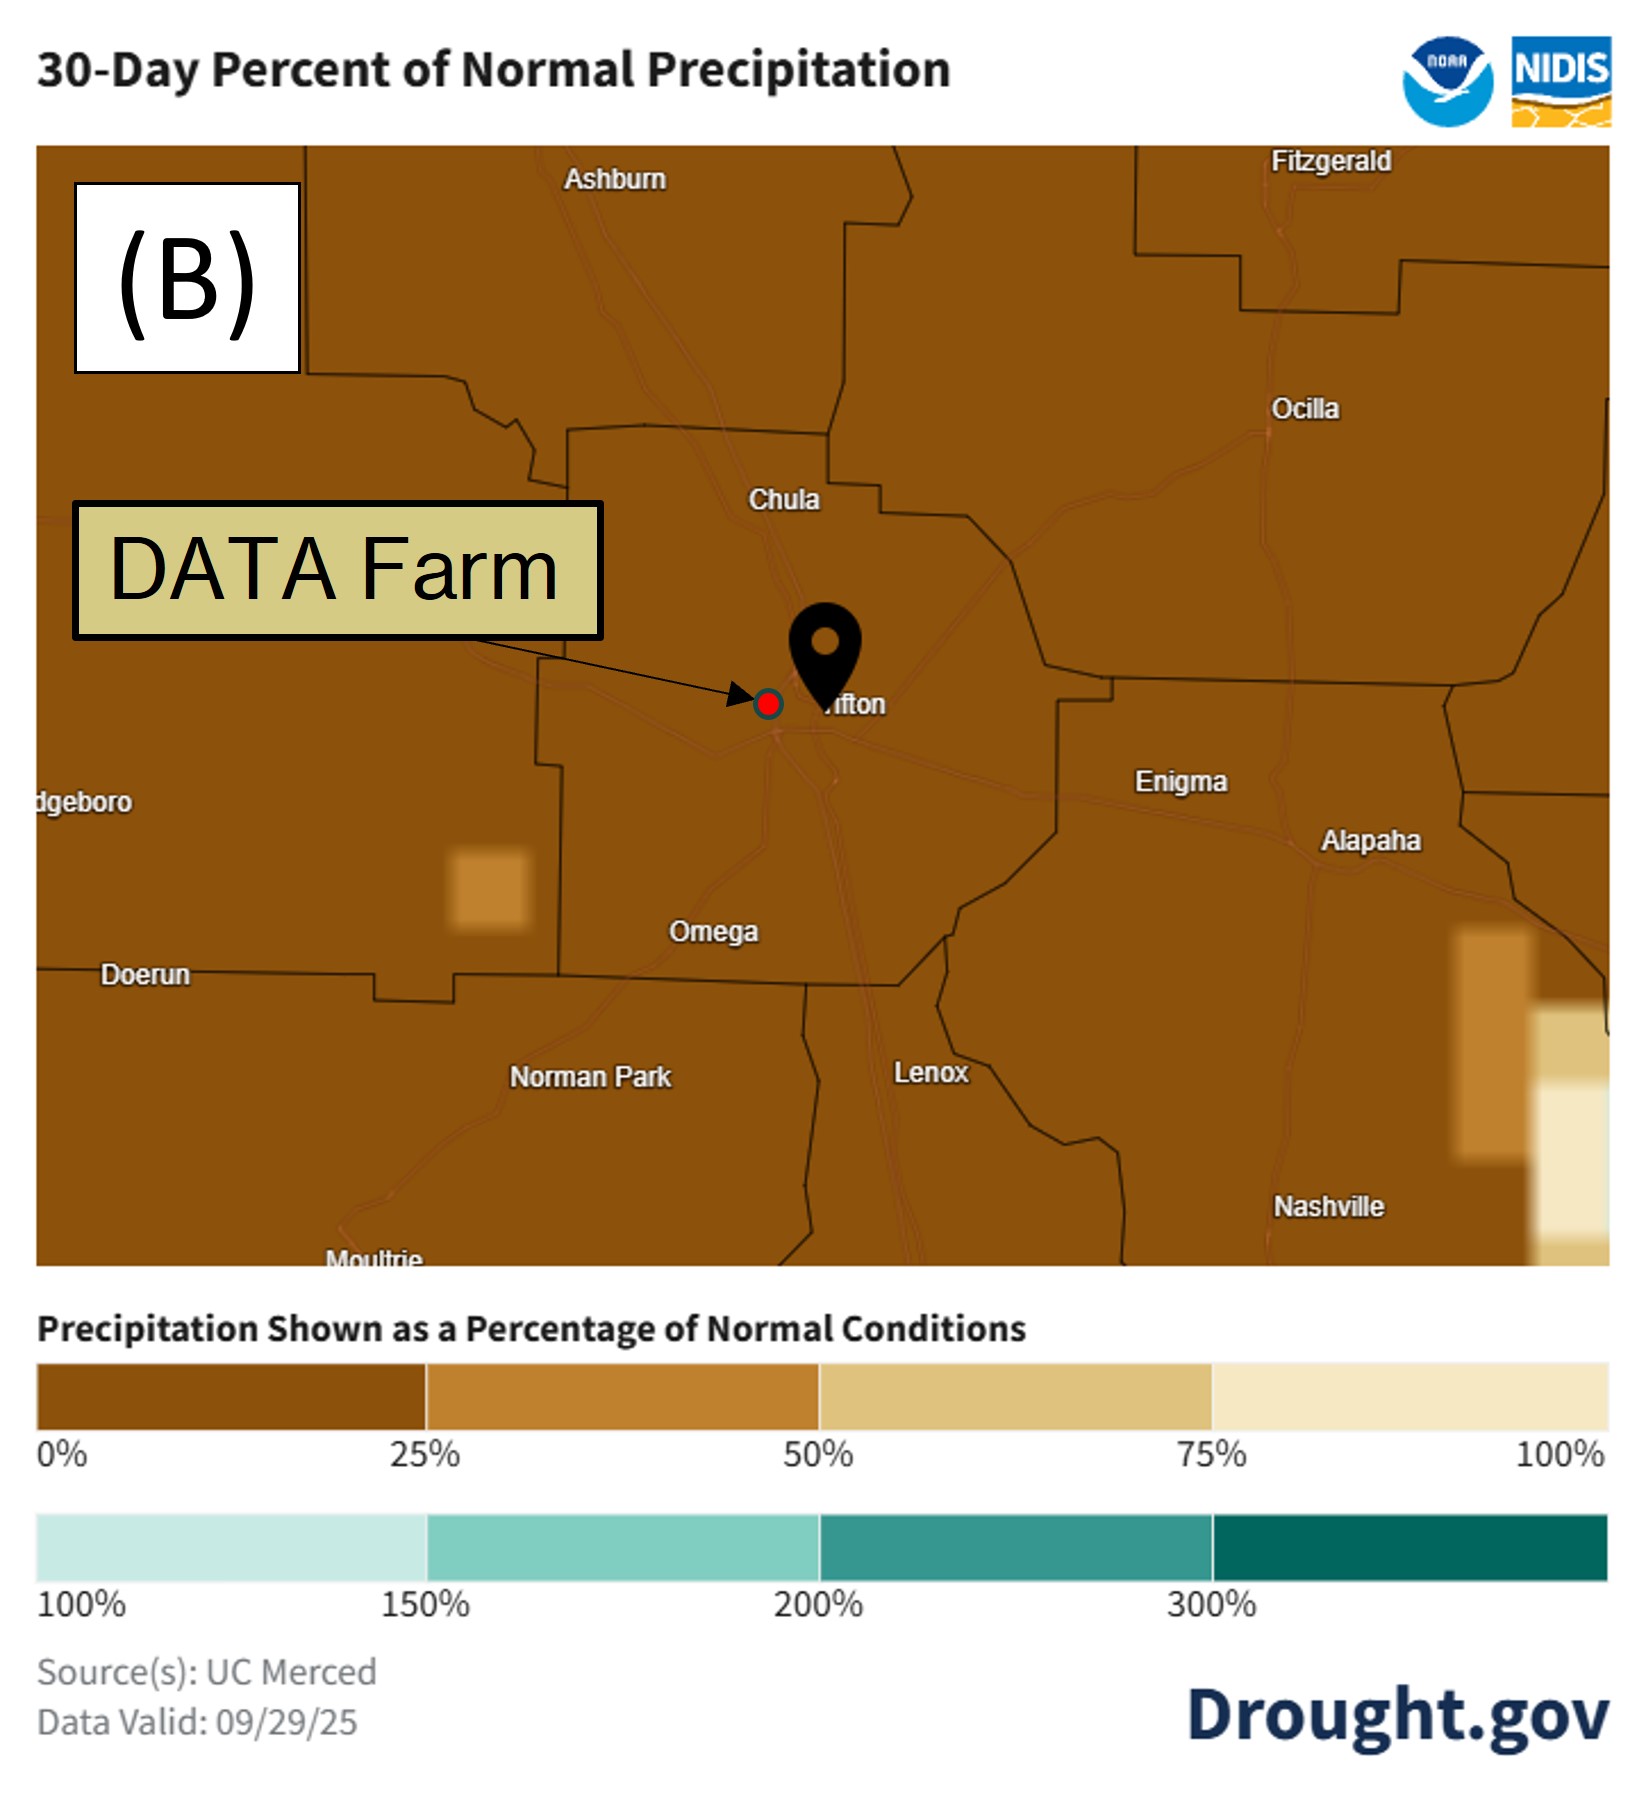
Precipitation trends shownas a percentage of normal conditions (average 1991–2020) for the 30 days prior to September29thfor Georgia and Tift County are shown in Figure 9. These maps show the variation in rainfall received across the state, and that the area around the DATA Farm received between 0% and 25% belownormal rainfall during the previous 30 days. We measured approximately 3.86 inches below average. The regions experiencing lower than average rainfall align with the maps above in Figure 8,showing drought conditions increasing across the state
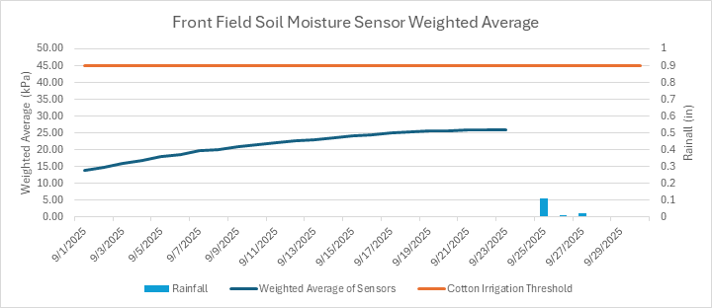
Soil moisture sensors removed on 9/23 prior to harvest.
Cotton harvested on 9/23 by South Central Georgia Gin.
Figure 17: West Field soil moisture data, sensors were removed 9/23/25 prior to harvest.
Upcoming Month
The next field operations will be to invert and harvest the peanuts in South Pivot along with data analysis and season summaries. Then the 2026 season starts by preparing the fields for winter forage for Dr. Tucker’s livestock. To prepare the former cotton fields, the stalks will be mowed and pulled out of the ground. The fields with heavy weed pressure this season (North Pivot and Front Field) will be disked to break up cotton residue and then deep turned to bury the seed bank. This should hopefully allow better control over weeds next season. Once the fields are prepared, we will seed them using a Remlinger 2300 grain drill on staggered planting dates to allow the cattle time to graze them at the best nutrition point. The decision was made to use a grain drill this year versus last year’s broadcast method because oats in the mix require good seed-soil integration. The seed mix Dr. Tucker chose is composed of Oats (45 lb/ac), Cereal Rye (45 lb/ac), Crimson Clover (5 lb/ac), and Purple Top Turnips (3 lb/ac). This mixture will provide nutrition for the cattle as well as diversity for soil health benefits.
Operations:
Invert peanuts in South Pivot
Harvest peanuts in South Pivot
Mow cotton stalks
Pull cotton stalks
Disk North Pivot, Front Field, and West Field to break up residue
Deep turn North Pivot and Front Field to bury pigweed seed bank


