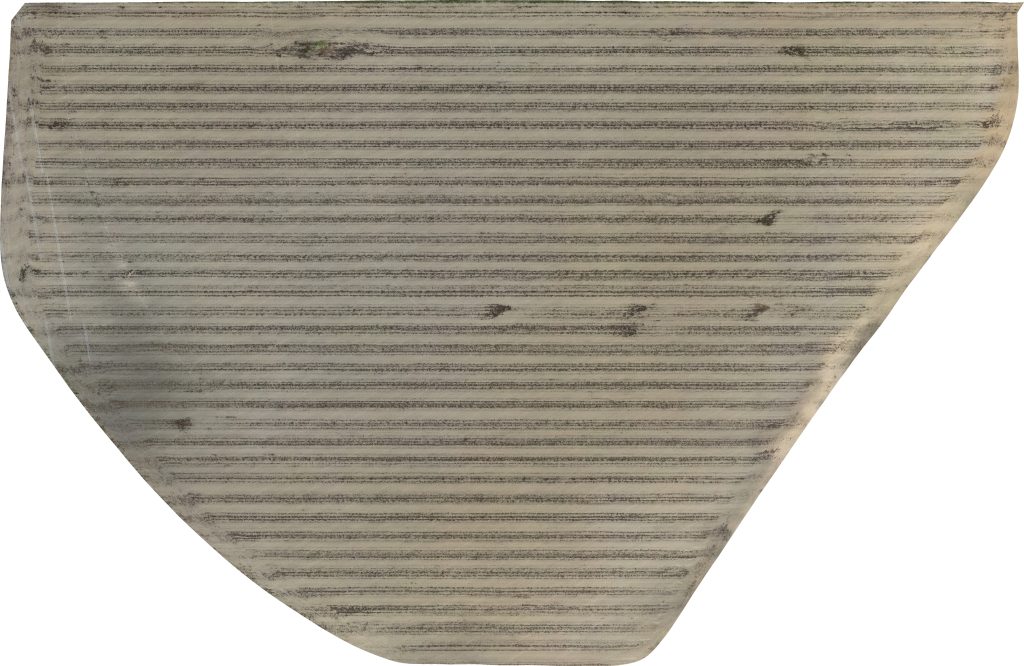
West Field – Cover: Winter Forage Mix, 3 DAP*; 2026 Crop: Dryland Cotton
*As of 11/1/2025
Overview of Activities
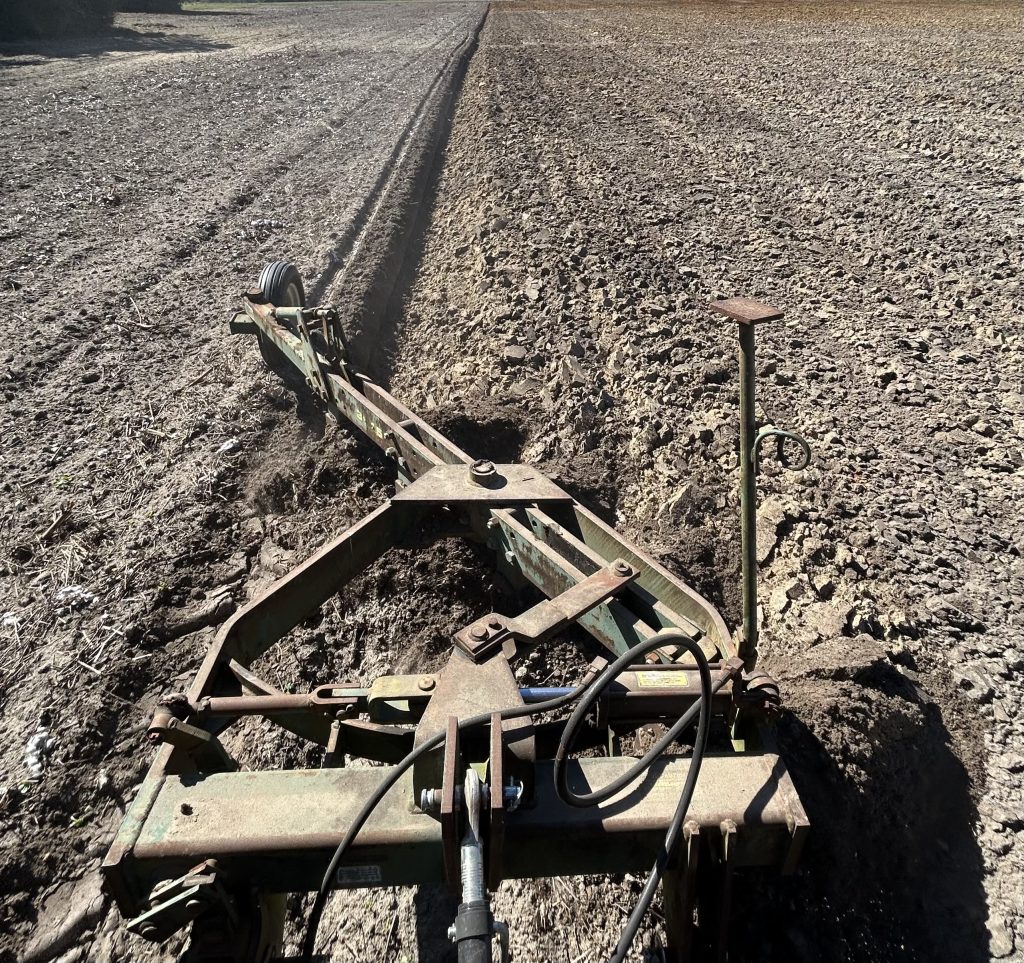
October concluded the last field operations of the 2025 crop season for the 4D Farm. The cotton stalks in Front Field, North Pivot, and West Field were mowed with a John Deere MX15 rotary cutter on October 1st. The stalks could not be pulled due to dry soil conditions until October 6th, after the farm received a rain shower on October 5th. The dry soil conditions created by September’s weather prevented the roots from coming out of the ground. After the stalks were pulled from the ground using a Besler 4–row stalk puller, a pass was made in each field with a Sunflower 1234 disk to break up crop residue. A deep turn operation was performed in both Front Field and North Pivot using a John Deere 3945 switch plow (Figure 1) to address heavy weed pressure that occurred during the season.
Figure 1. John Deere 3945 switch plow performing deep turn in Front Field.
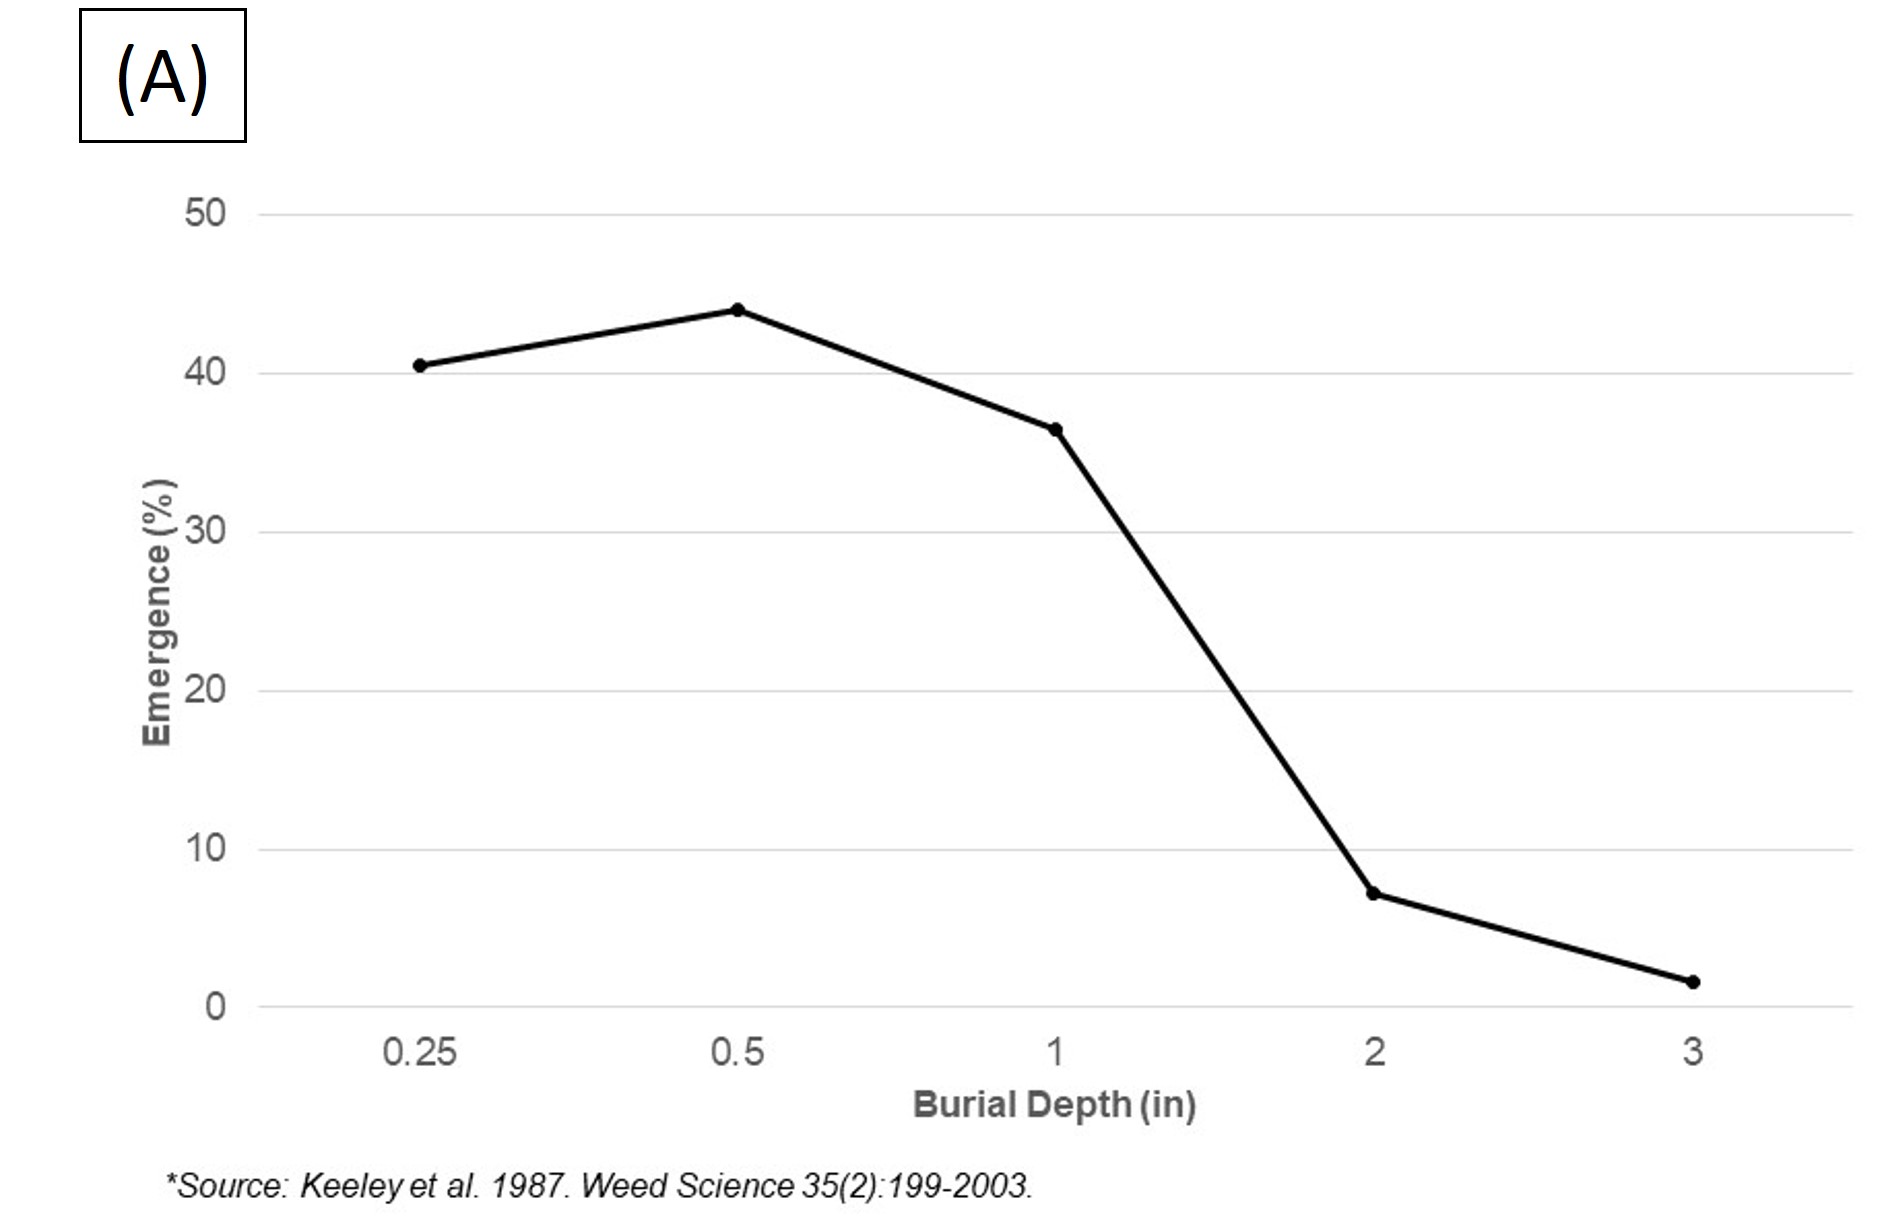
Dr. Prostko with UGA recommends inversion tillage with a moldboard plow to bury the seeds deeper in the soil profile to prevent emergence.The images in Figure 2are from the UGA Cooperative Extension articleTillage/Burial Depth Effects on Weed Emergence (Prostko)on January 21st, 2023.Two of the charts show the influence of burial depth on the emergence of Palmer Amaranth (Figure2A) and Pitted Morningglory (Figure 2B). Our target turning depth during operations in North Pivot and Front Field was 8 – 10inches(20.3 – 25.4 cm) to maximize the effect of weed seed burial.
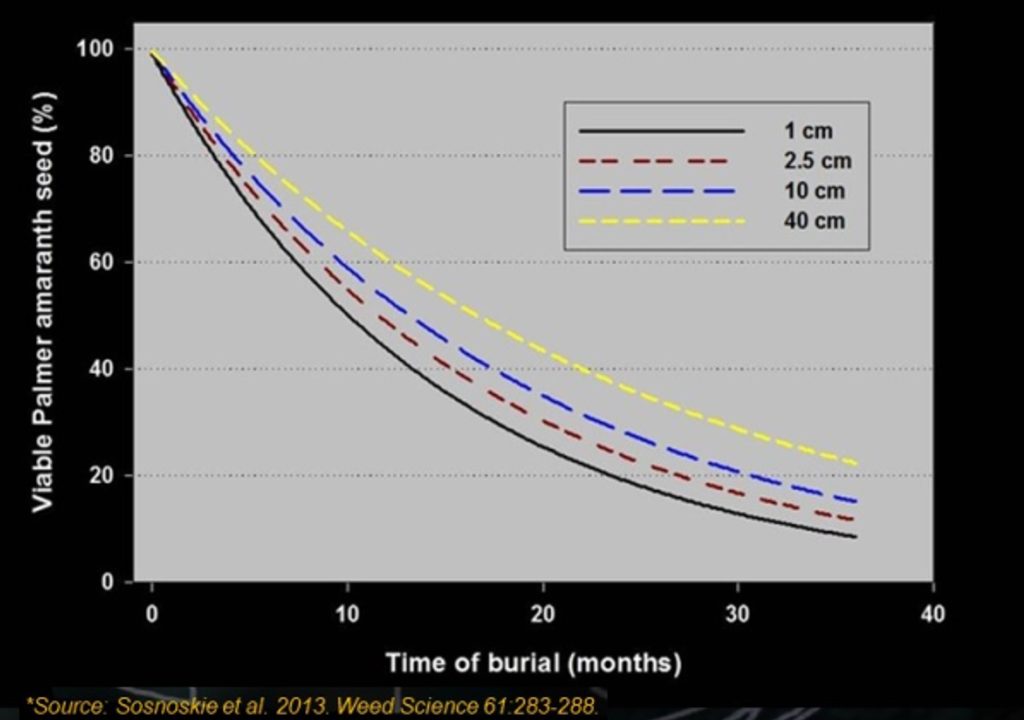
The article does not recommend deep tillage every year, but only every 3to4 years. The benefit of a 3-to-4-year tillage rotation is shownin Figure 3,which showsthe effect time has on Palmer Amaranth seed viability. The plan for the 4D Farm is to only perform deep tillage before peanut crops every 3 years. Front Field has not been deep turned since ABAC purchased the property in 2017, and North Pivot was deep turned in the spring of 2023 by UGA for peanut plot planting.
Figure 3. The influence of burial duration and depth on Palmer Amaranth seed viability in Georgia from 2007 to 2011 (Prostko, 2023).
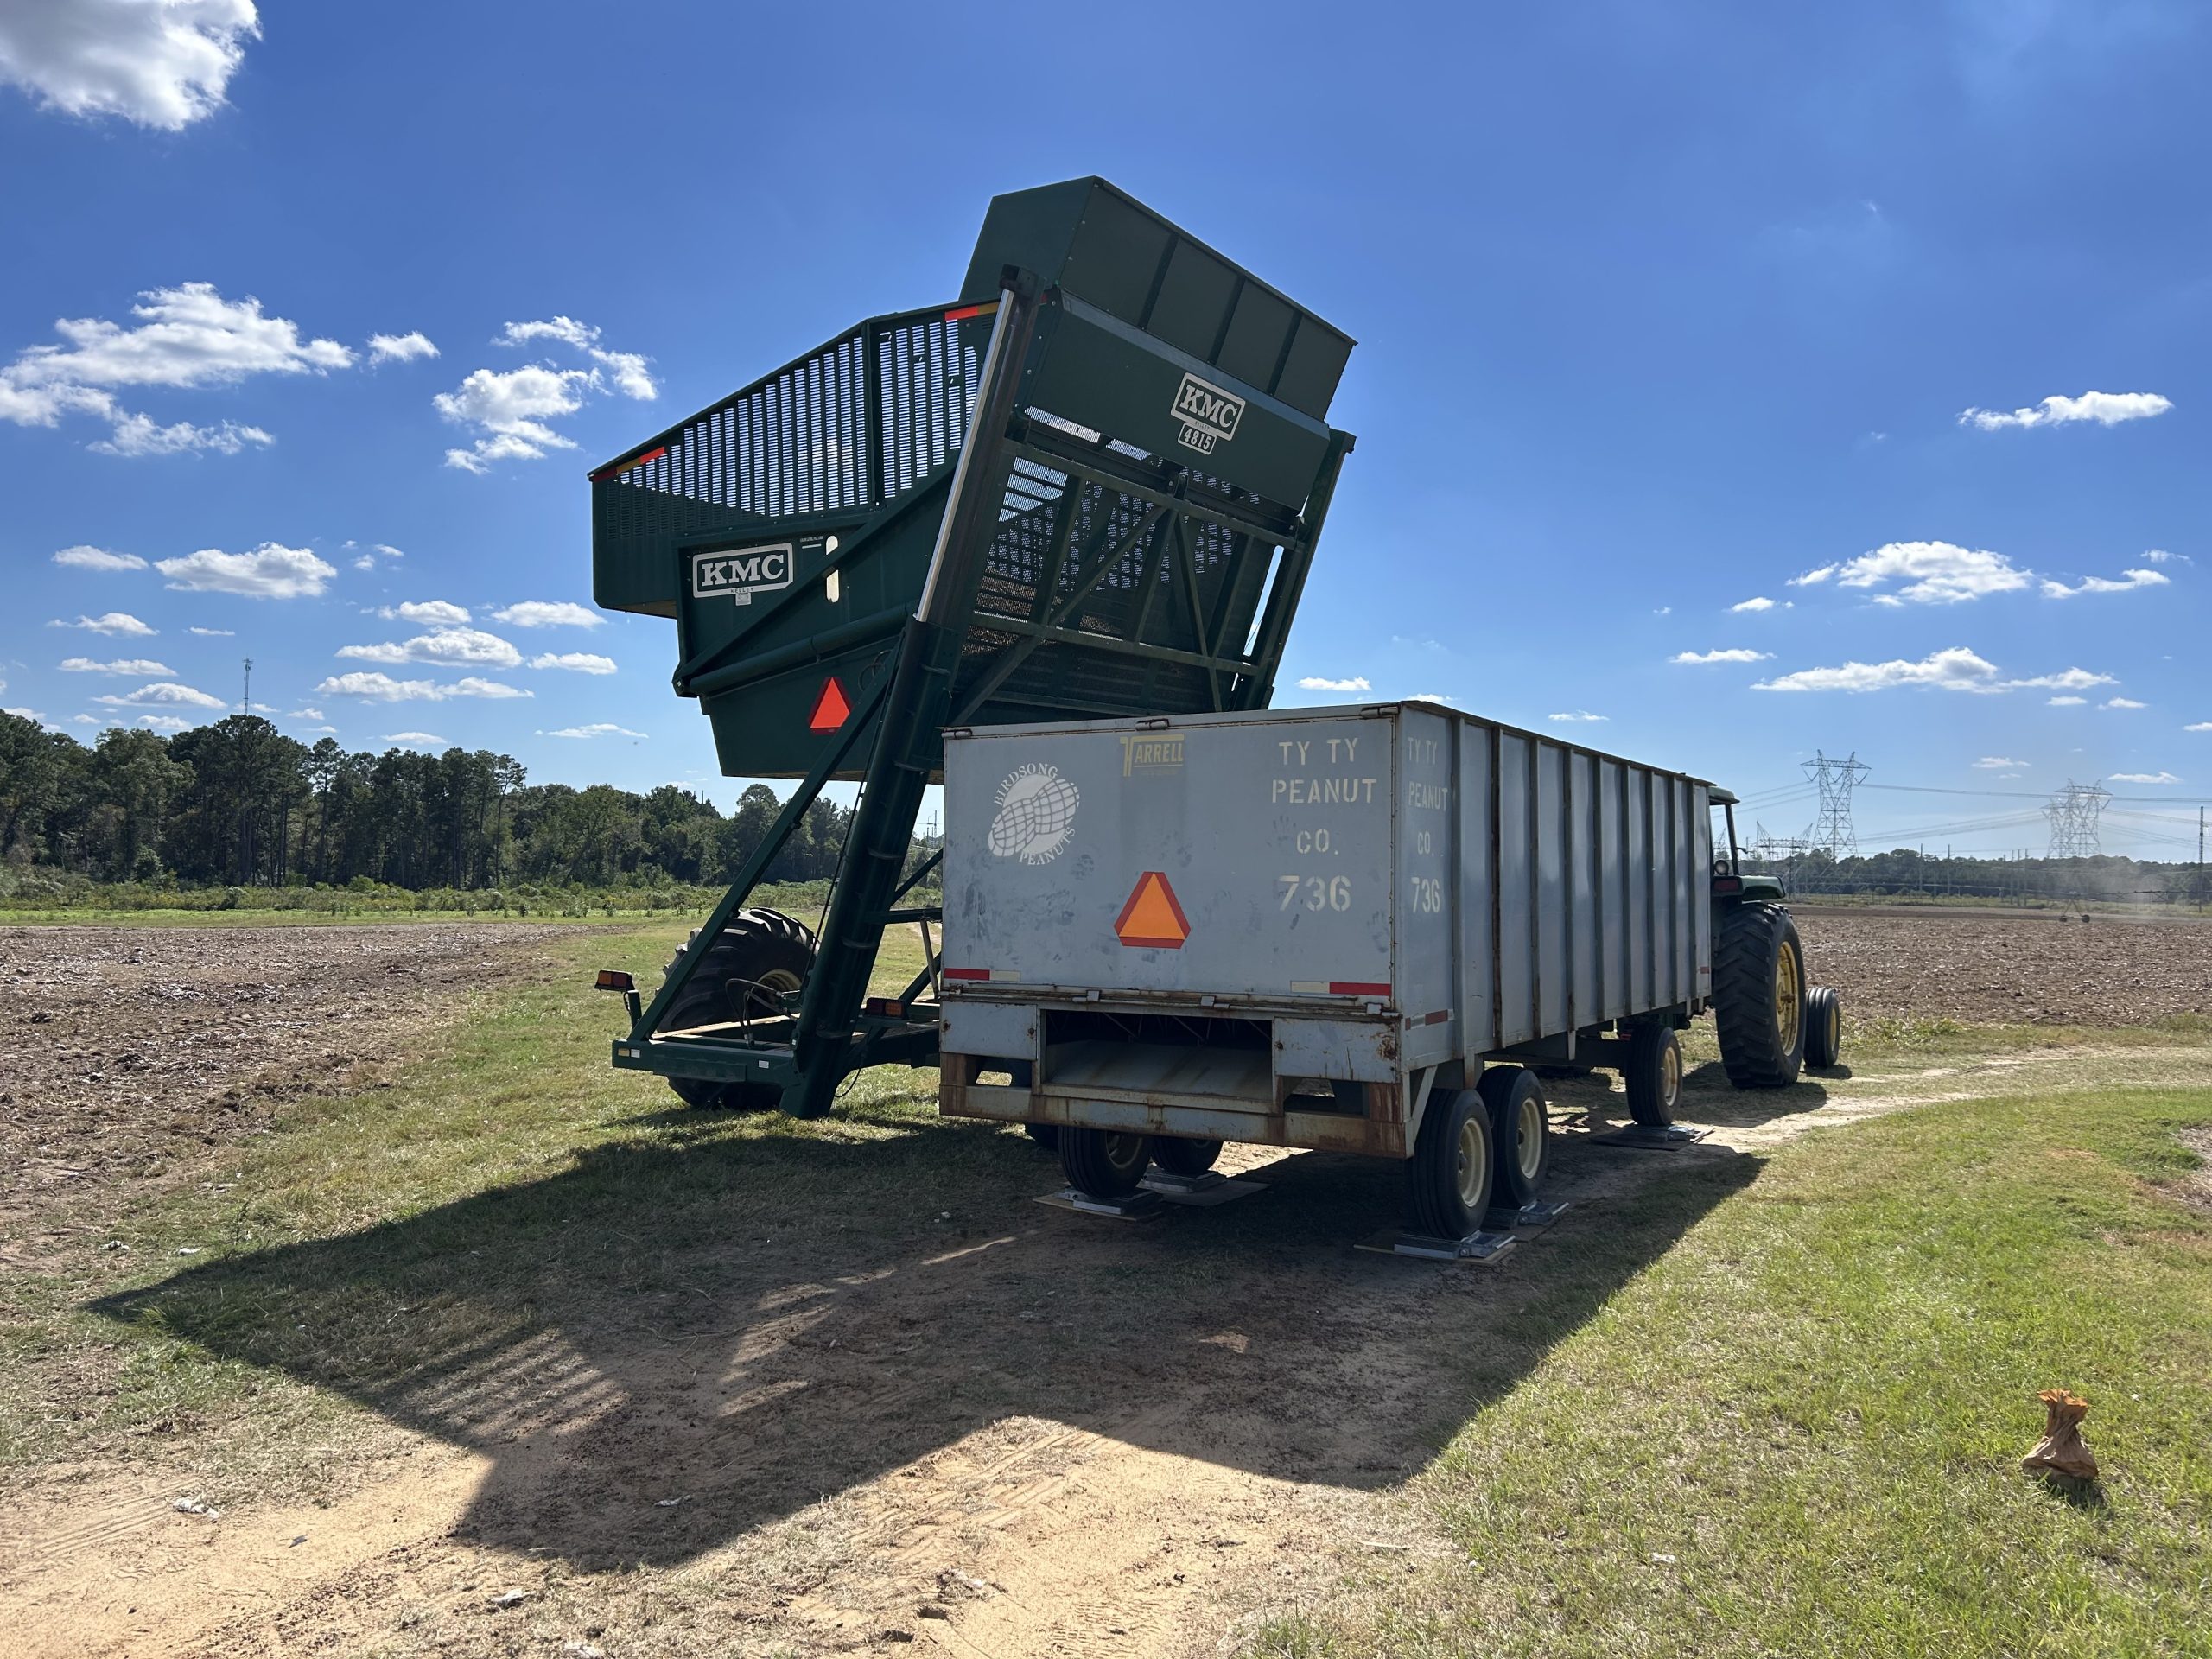
After the deep turn, a field cultivator was used to break up soil clumps and level the field for planting.The two fields receiving deep tillage will be allowed time to settle before planting the winter cover seed mix. The peanuts in South Pivot were inverted using ABAC’s John Deere 6195R tractor and UGA’s KMC 4-Row peanut inverter on October 1st. The plan was to harvest them during the following week, but unfortunately the farm received rain on Sunday, October 5th. The weather continued to be overcast all week with rain coming in again on Friday, October 10th. These damp conditions delayed peanut harvest until October 13th, when KMC allowed us to use their 7406 6-row peanut combine. To make the harvest process more efficient, a KMC 4815 dump cart was used to transport the peanut loads from the combine to the weigh wagons. The process of offloading peanuts from the combine into the dump cart is shown in Figure 4. This allowed the combine to stay in the field and keep harvesting while each load from the combine was weighed, as shown in Figure 5.
Intercomp PT300 wheel scales were placed under each of the wagon’s six wheels to record the total weight of a load. Table 1containsthe individual load weights measured on-site. These weights will be used to validate the data recorded by KMC’s yield monitoring system.
Table 1: Load weights measured with on-site scales.
Load #
Wagon #
Weight (lbs)
1
736
7,355
2
736
7,325
3
108
7,420
4
108
5,680
5
14
7,660
6
14
7,395
7
2116
7,035
8
2116
2,000
The four wagons of peanuts were taken to Birdsong Peanuts in Ty-Ty for grading and processing. The information recorded by them for each wagon (weight, grade, and moisture) is shown in Table 2 along with the wagon weights measured by the scales on–site during harvest. The on-site scale weights for wagons 736 and 2116 were within 5% of the weights measured at the buying point, but the other two wagons (108 & 14) were overestimated by 26% and 19%, respectively. The Birdsong scale weights totaled 46,443 pounds,resulting in an average yield of 4,222 pounds per acre for South Pivot (11 acres). This is 278 pounds below our target yield of 4,500 pounds per acre set during preseason planning.
Table 2: South Pivot peanut harvest resultby peanut wagon.
Wagon #
Weight (lbs)
Grade
Moisture (%)
UGA Weight (lbs)
Difference (lbs)
Difference (%)
736
13,959
77
10.6
14,680
721
5%
108
10,401
76
10.5
13,100
2,669
26%
14
15,652
76
10.4
15,055
2,403
19%
2116
9,431
78
10.1
9,035
-396
-4%
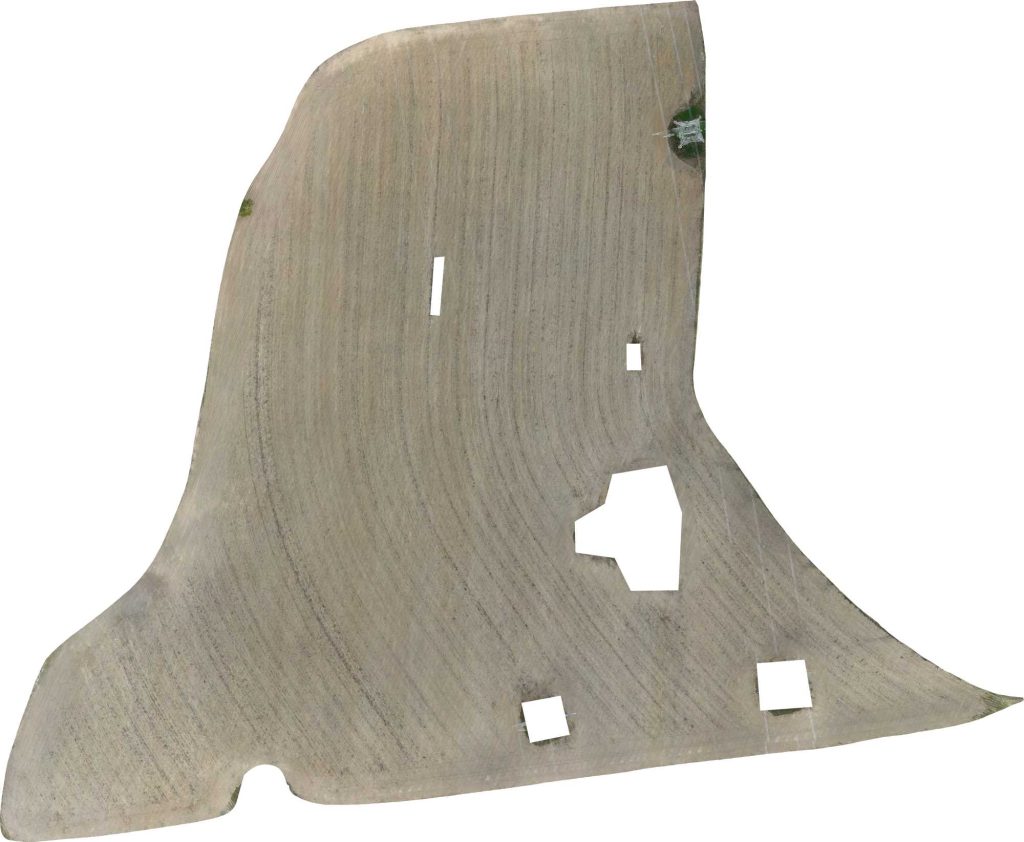
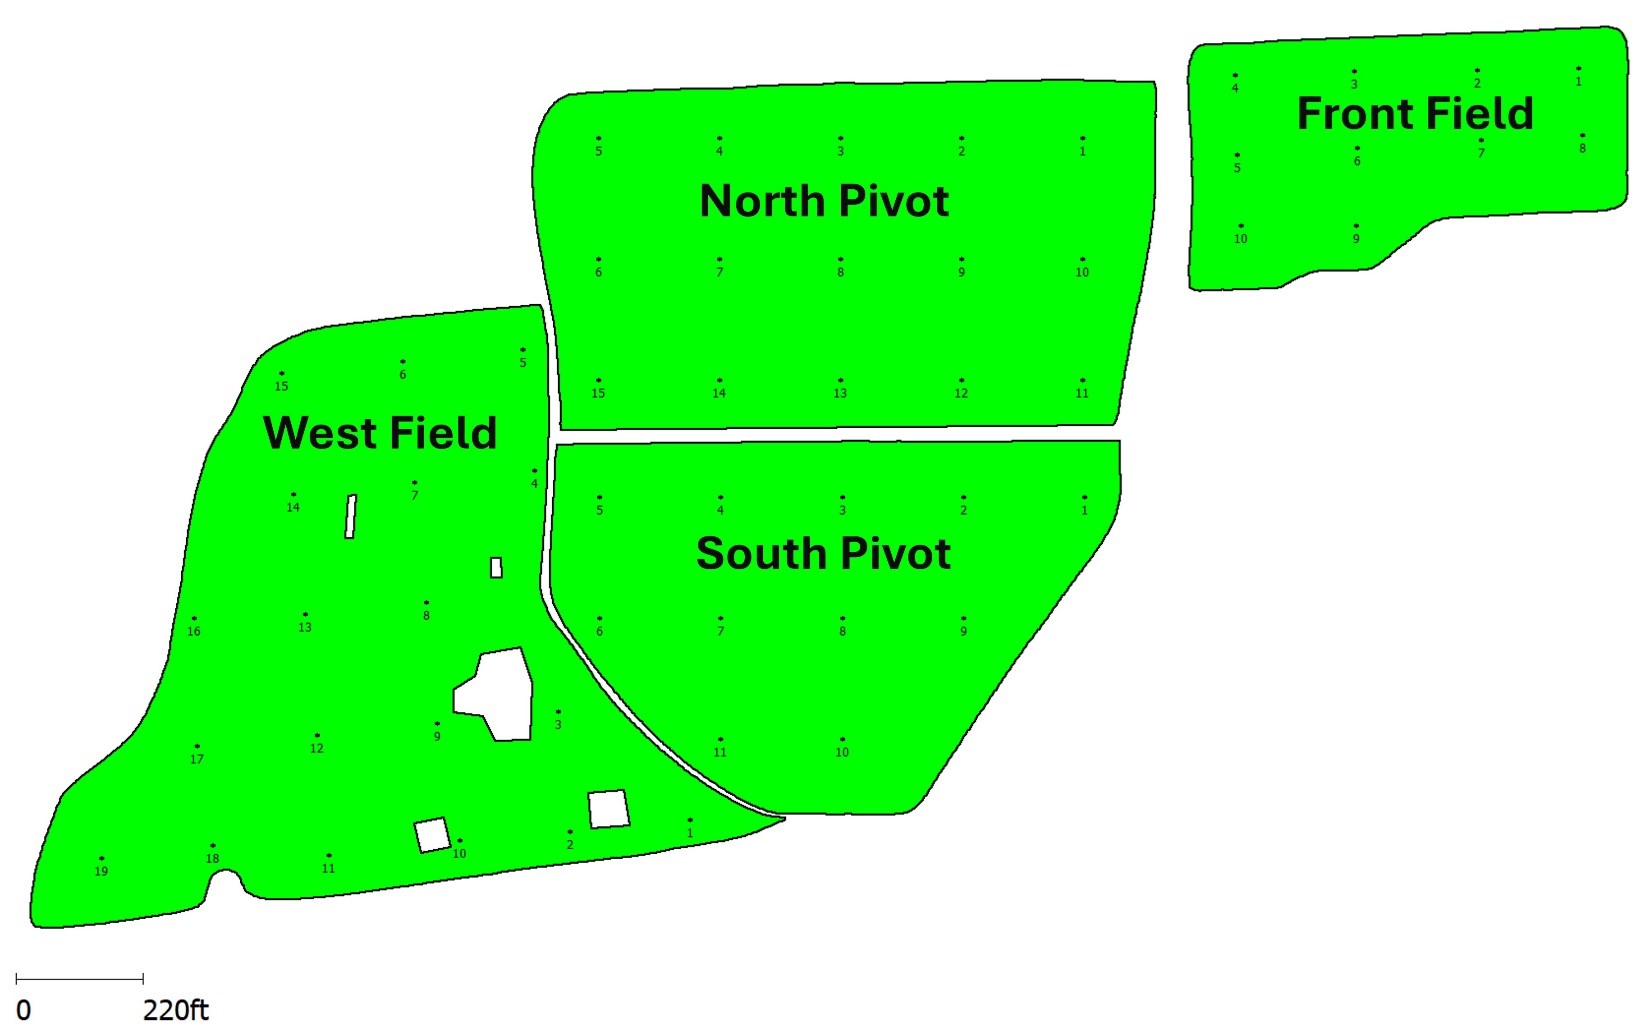
After the peanut harvest, the fields were ready for soil sampling to begin the planning process for next season’s nutrient plan. On October 22nd, students in ABAC’s spatial data analysis in agriculture class collected soil samples as an assignment to learn how to utilize GPS mapping software to navigate and collect soil samples. The same 1-acre grid sample points from previous years were used again this year. Figure 6 shows the sample locations for all four fields at the data farm. The 55 samples were taken to Waters Lab in Camilla on October 23rdby Nick Gladden. The results were received on Monday,October 27thand imported into Ag Leader SMS for analysis for the 2026 production season. A soil report, like previous years, will be createdand shared.
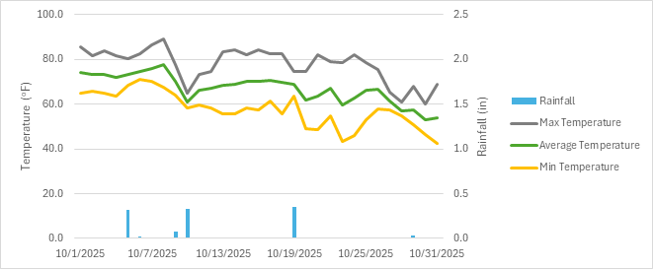
The monthly temperature trends and rainfall recorded by the on-site weather station for October are showninFigure8.
Figure 8. Monthly weather for October 2025.
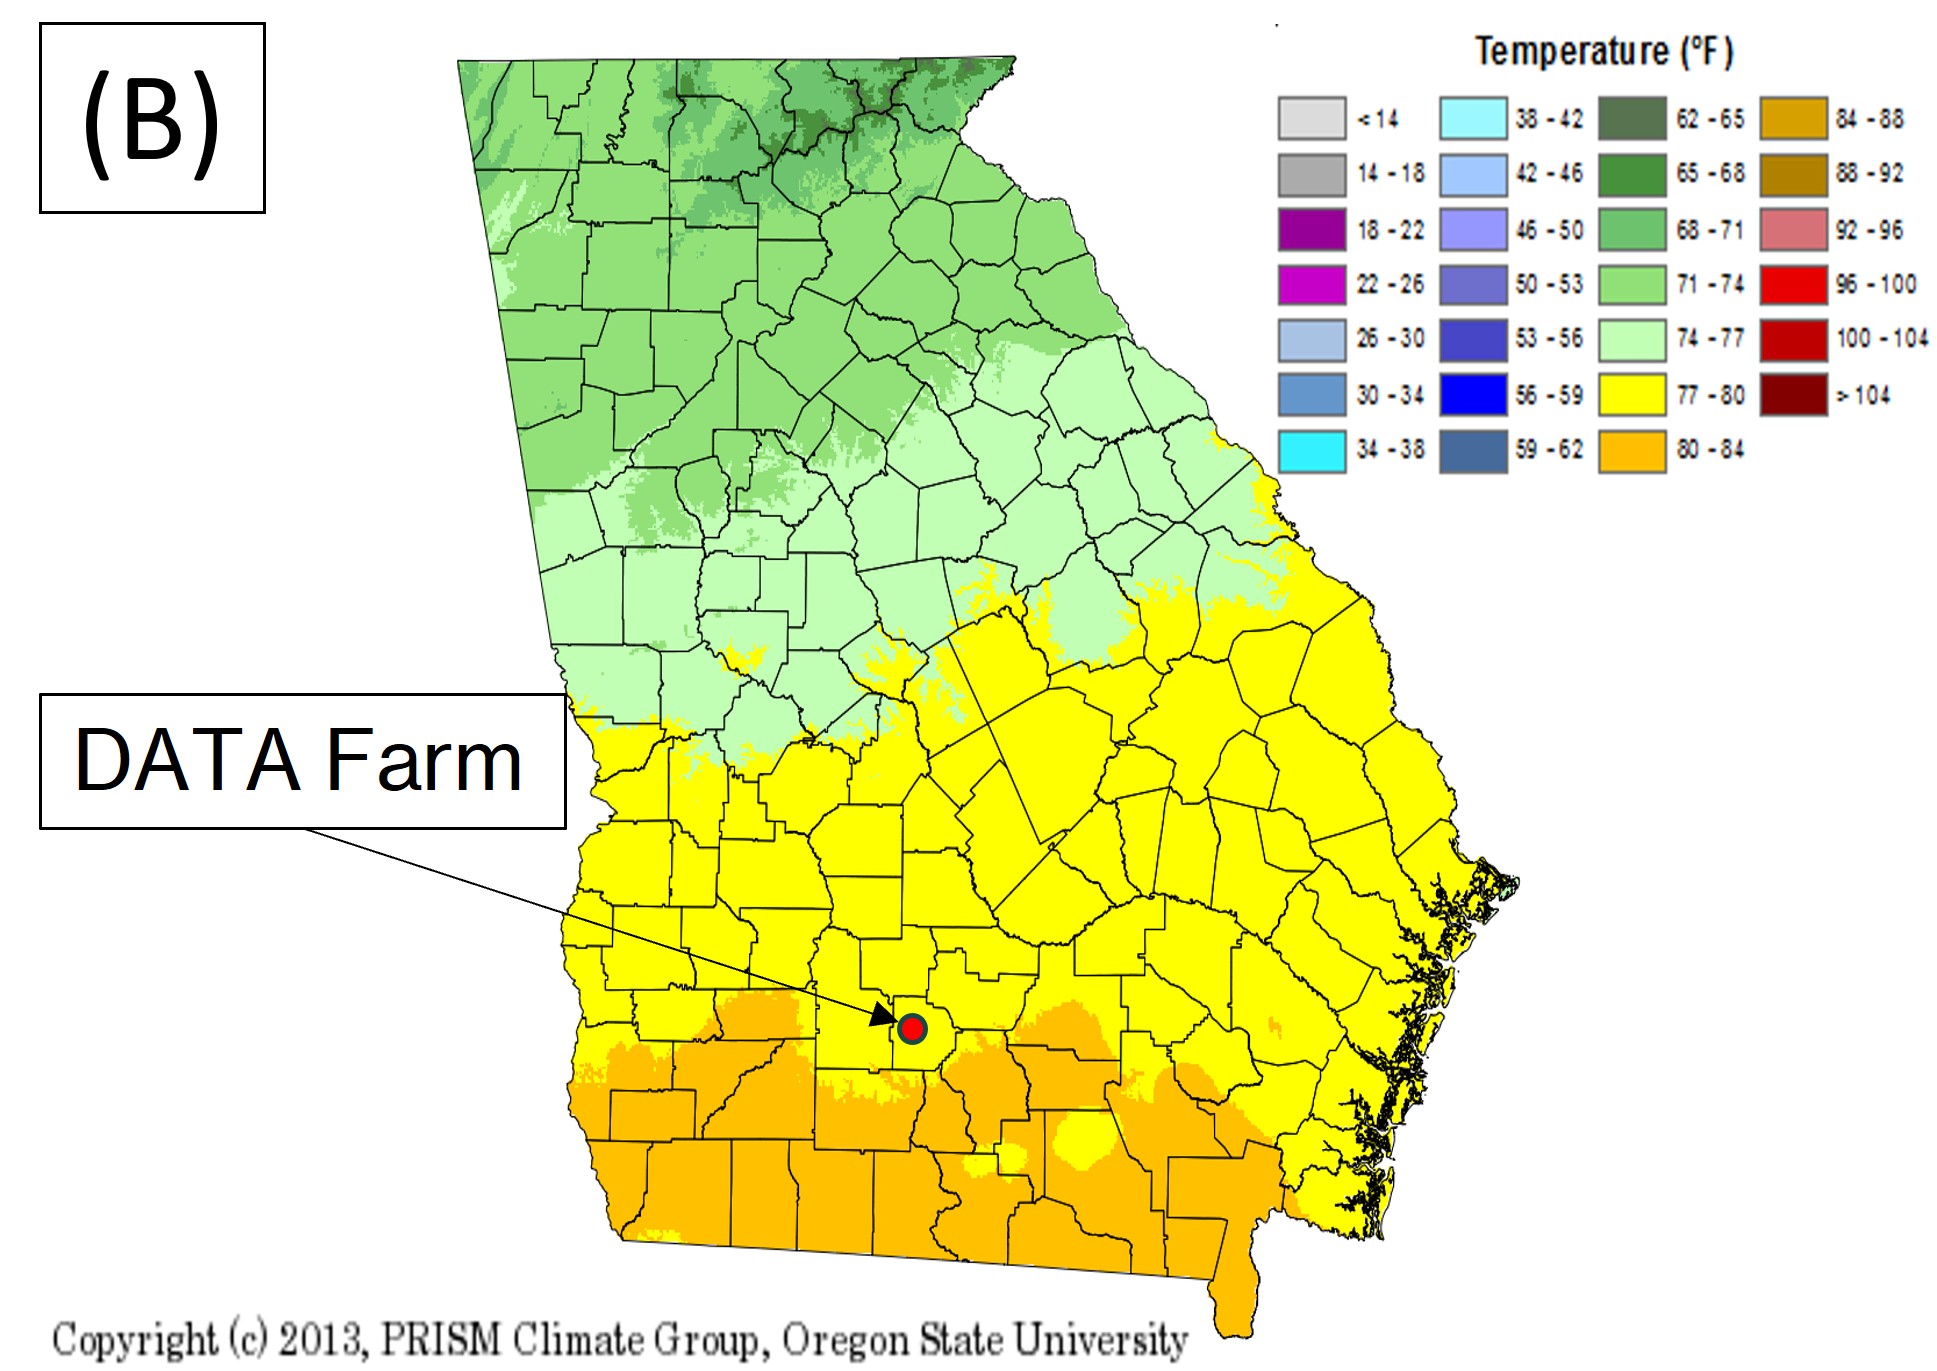
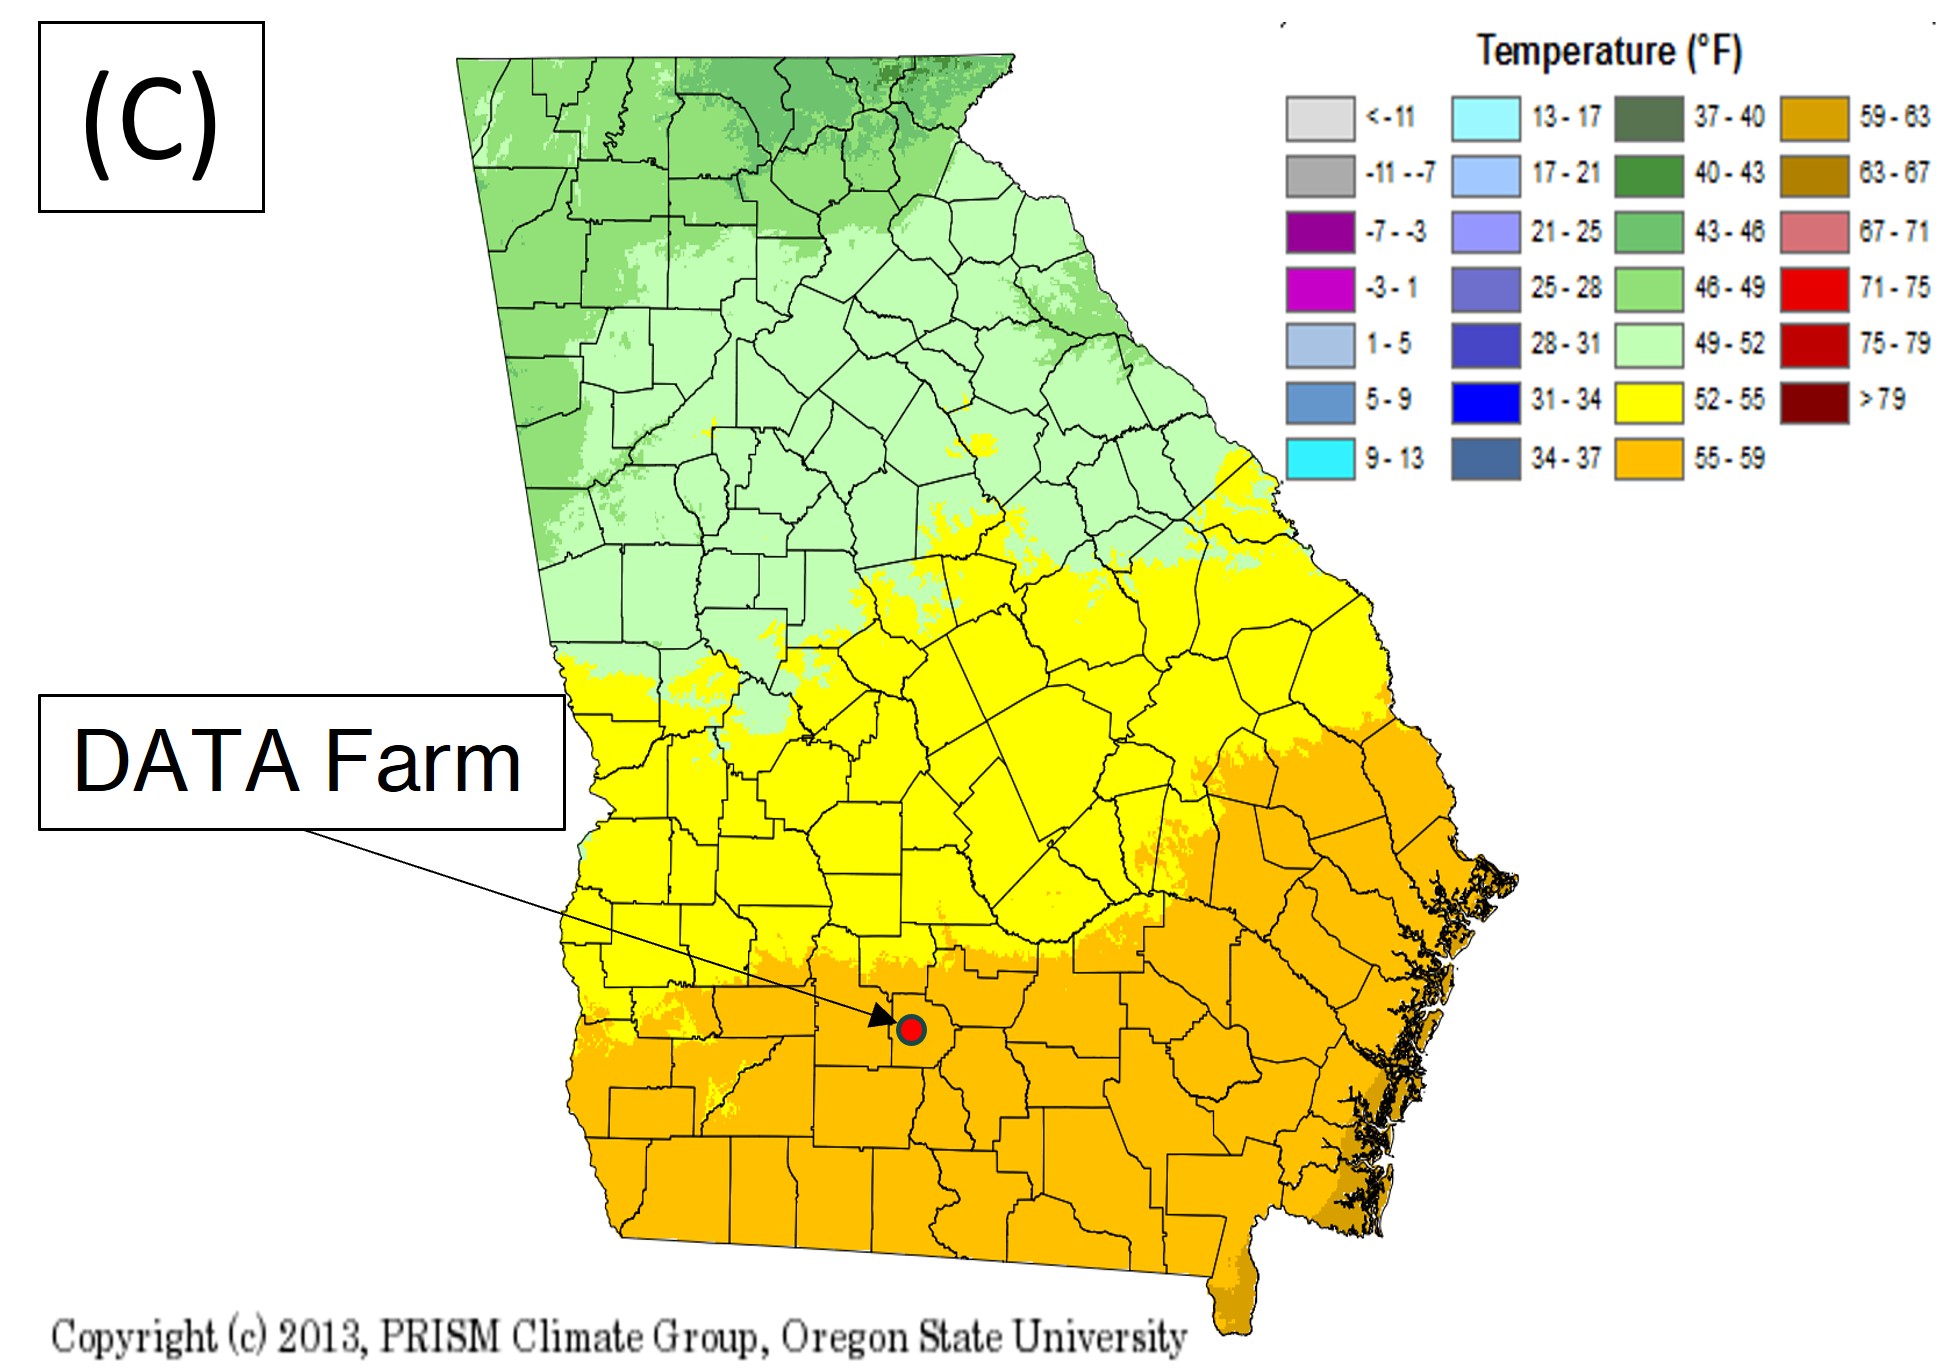
For historical comparison, Georgia climate maps based on data from 1981 to 2010 (UGA’s Weather Network) are shown in Figure 9 for the month of October.
The biggest weather impact during October was the continued drought conditions. Although 1.1 inches of rainfall was recorded at the DATA Farm during October, this was only 45% of the average (2.4 to 2.8 inches) for this period. The rainfall events in the second week of October delayed peanut harvest but were not enough to replenish soil moisture.
The average of recorded maximum temperatures for the month was 78°F, which is within the average historical range of 77°F – 80°F (Figure 9B), and the average of recorded minimum temperatures was 58°F, which is also within the average historical range of 55°F – 59°F (Figure 9C). October temperatures continued the cooling trend for the rest of the crop season.
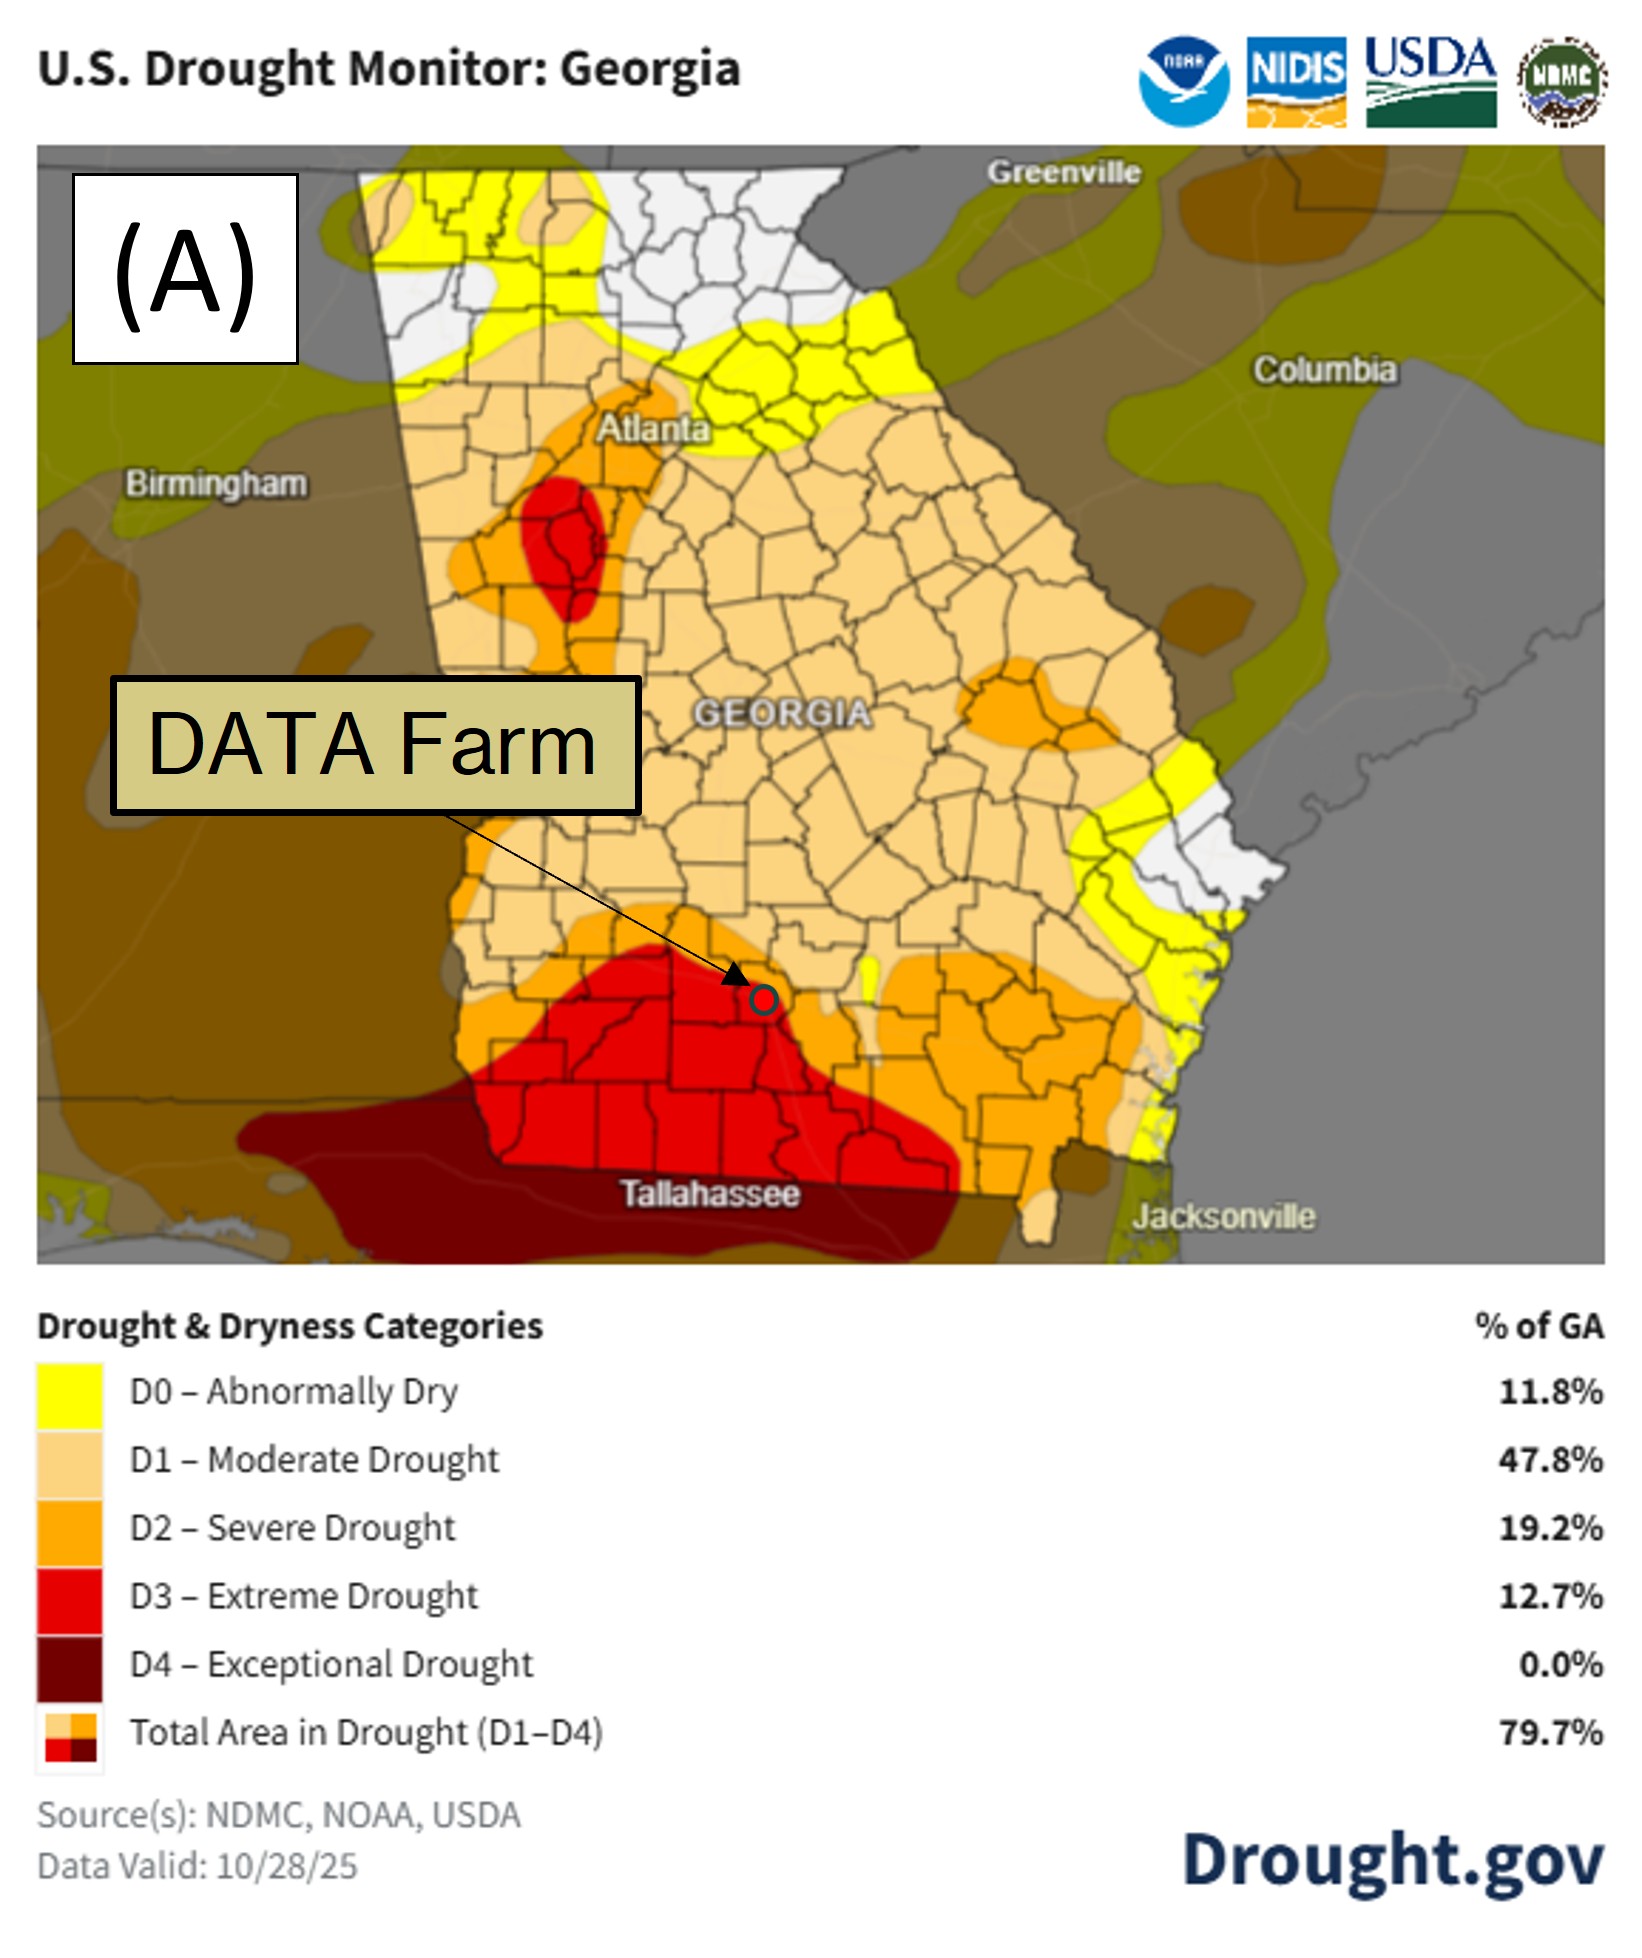
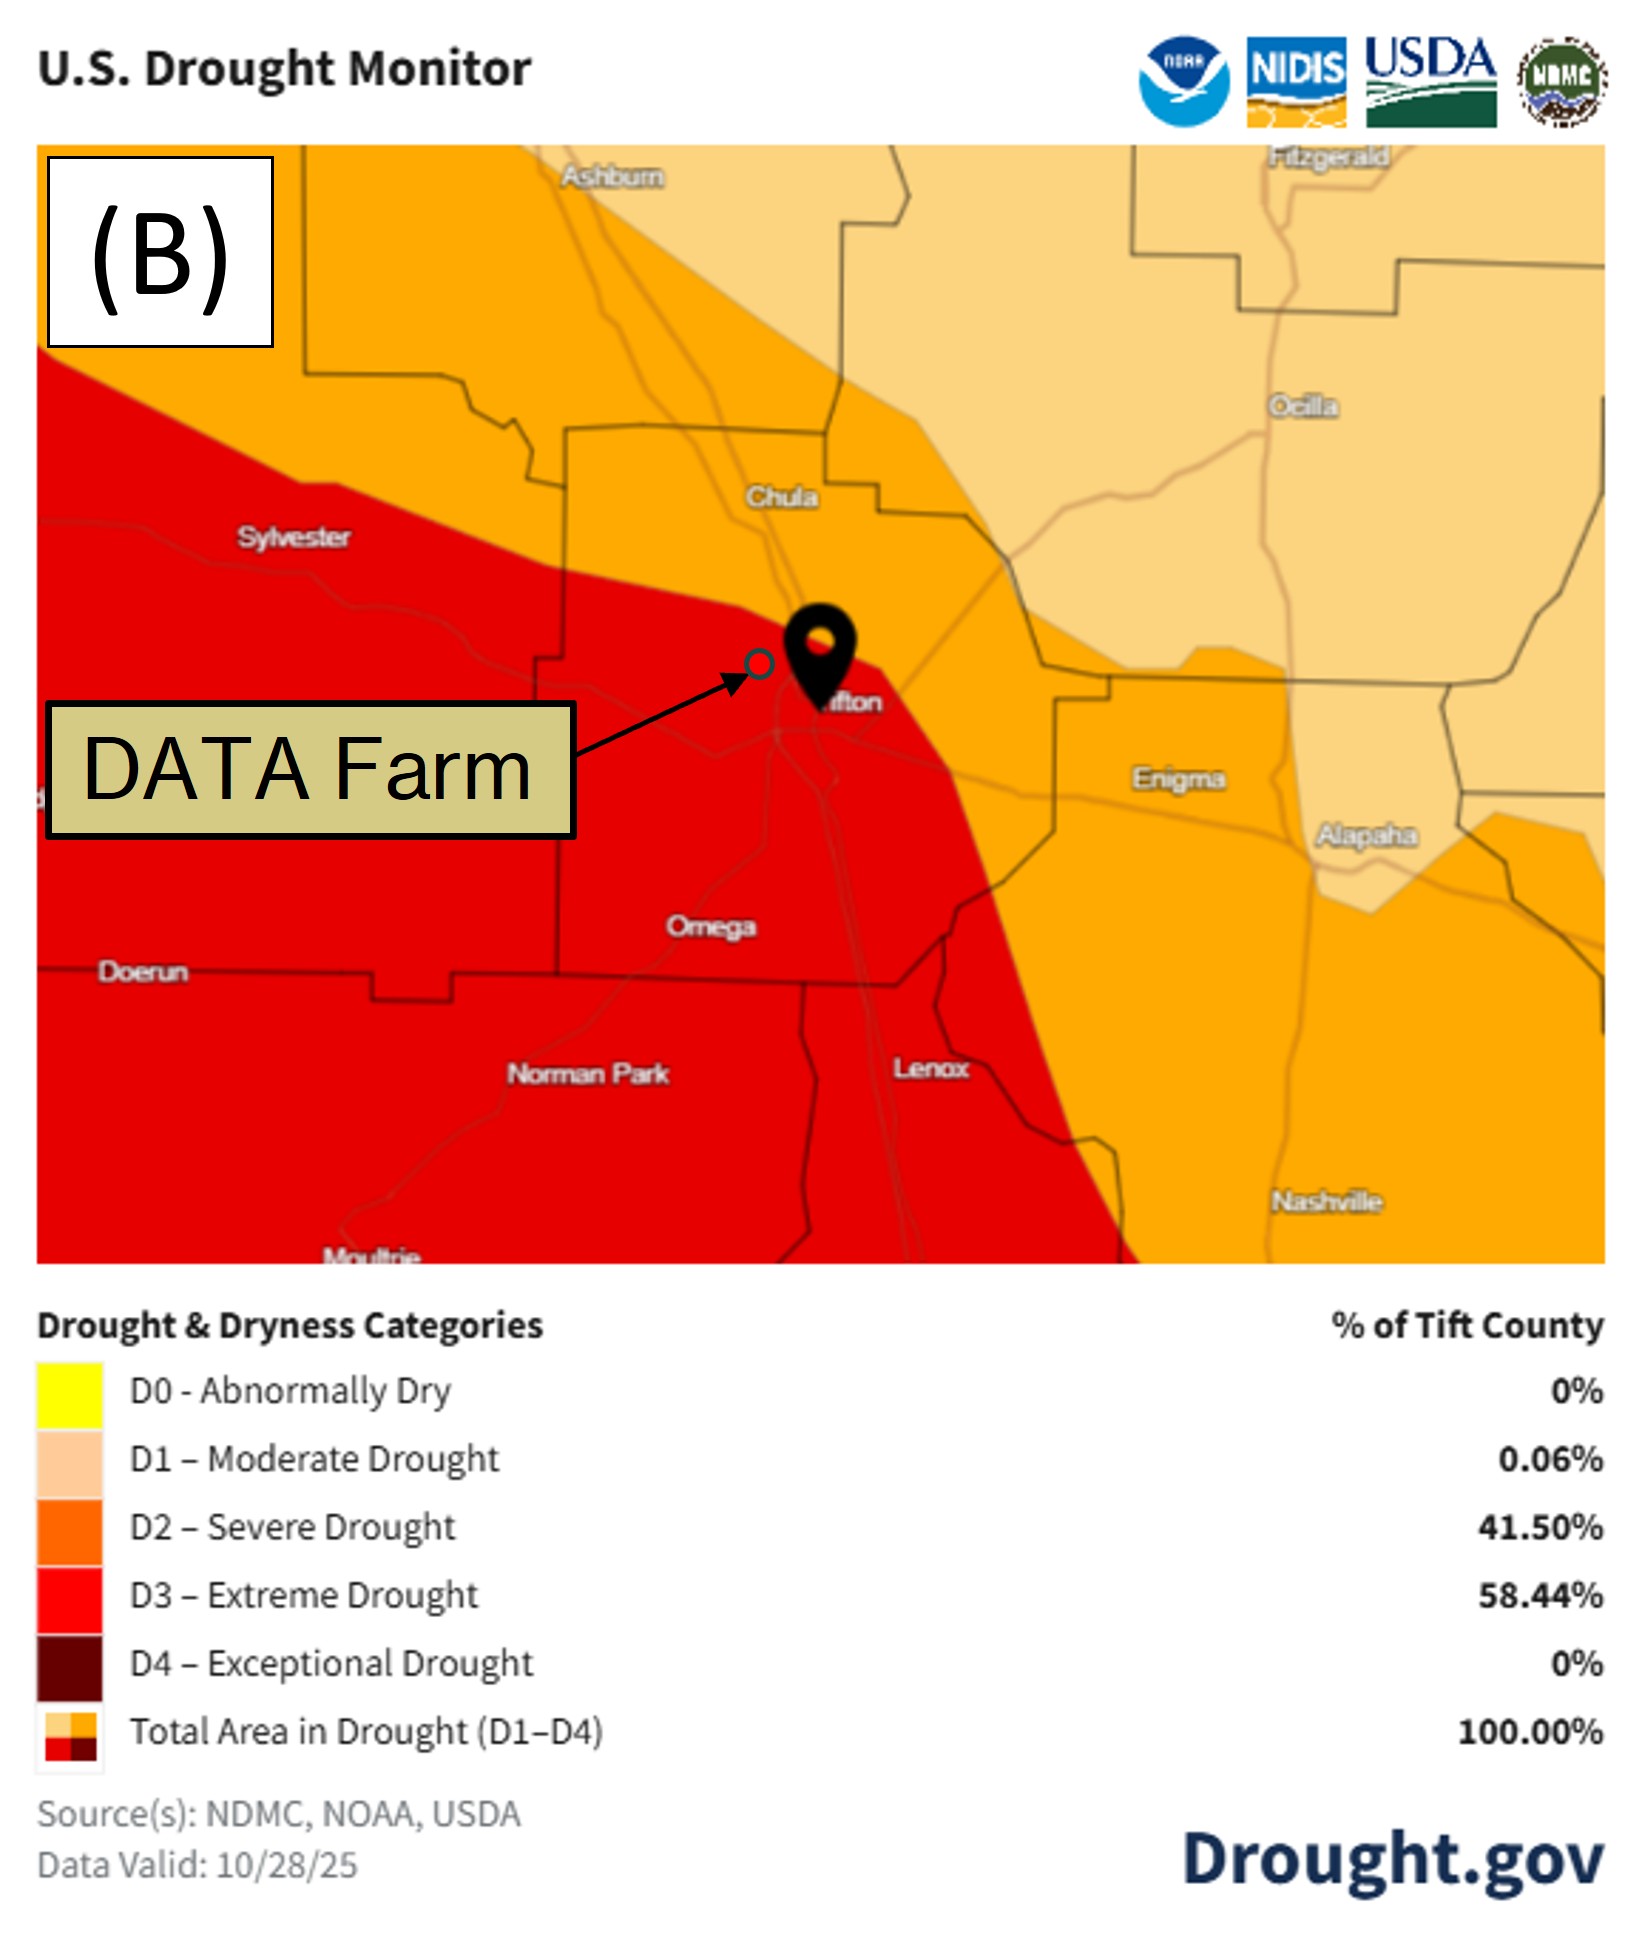
Figure 10A shows the drought monitor map as of October28th, from the National Integrated Drought Information System for Georgia. Abnormally dry conditions are now present in 11.8% of the state,with 47.8% experiencing moderate drought conditions, 19.2% experiencing severe drought conditions, and 12.7% experiencing extreme drought conditions. The total area of the state experiencing drought conditions is up to 79.7% from 52.8% at the end of September. Figure 10B shows 100% of Tift Countyis experiencing drought conditions which issplit between severe drought (41.5%) and extreme drought (58.44%) conditions. The DATA Farm is located within the area experiencing extreme drought conditions. These dry conditions caused issues with post-harvest tillage operations and delayed planting of the winter forage crop.
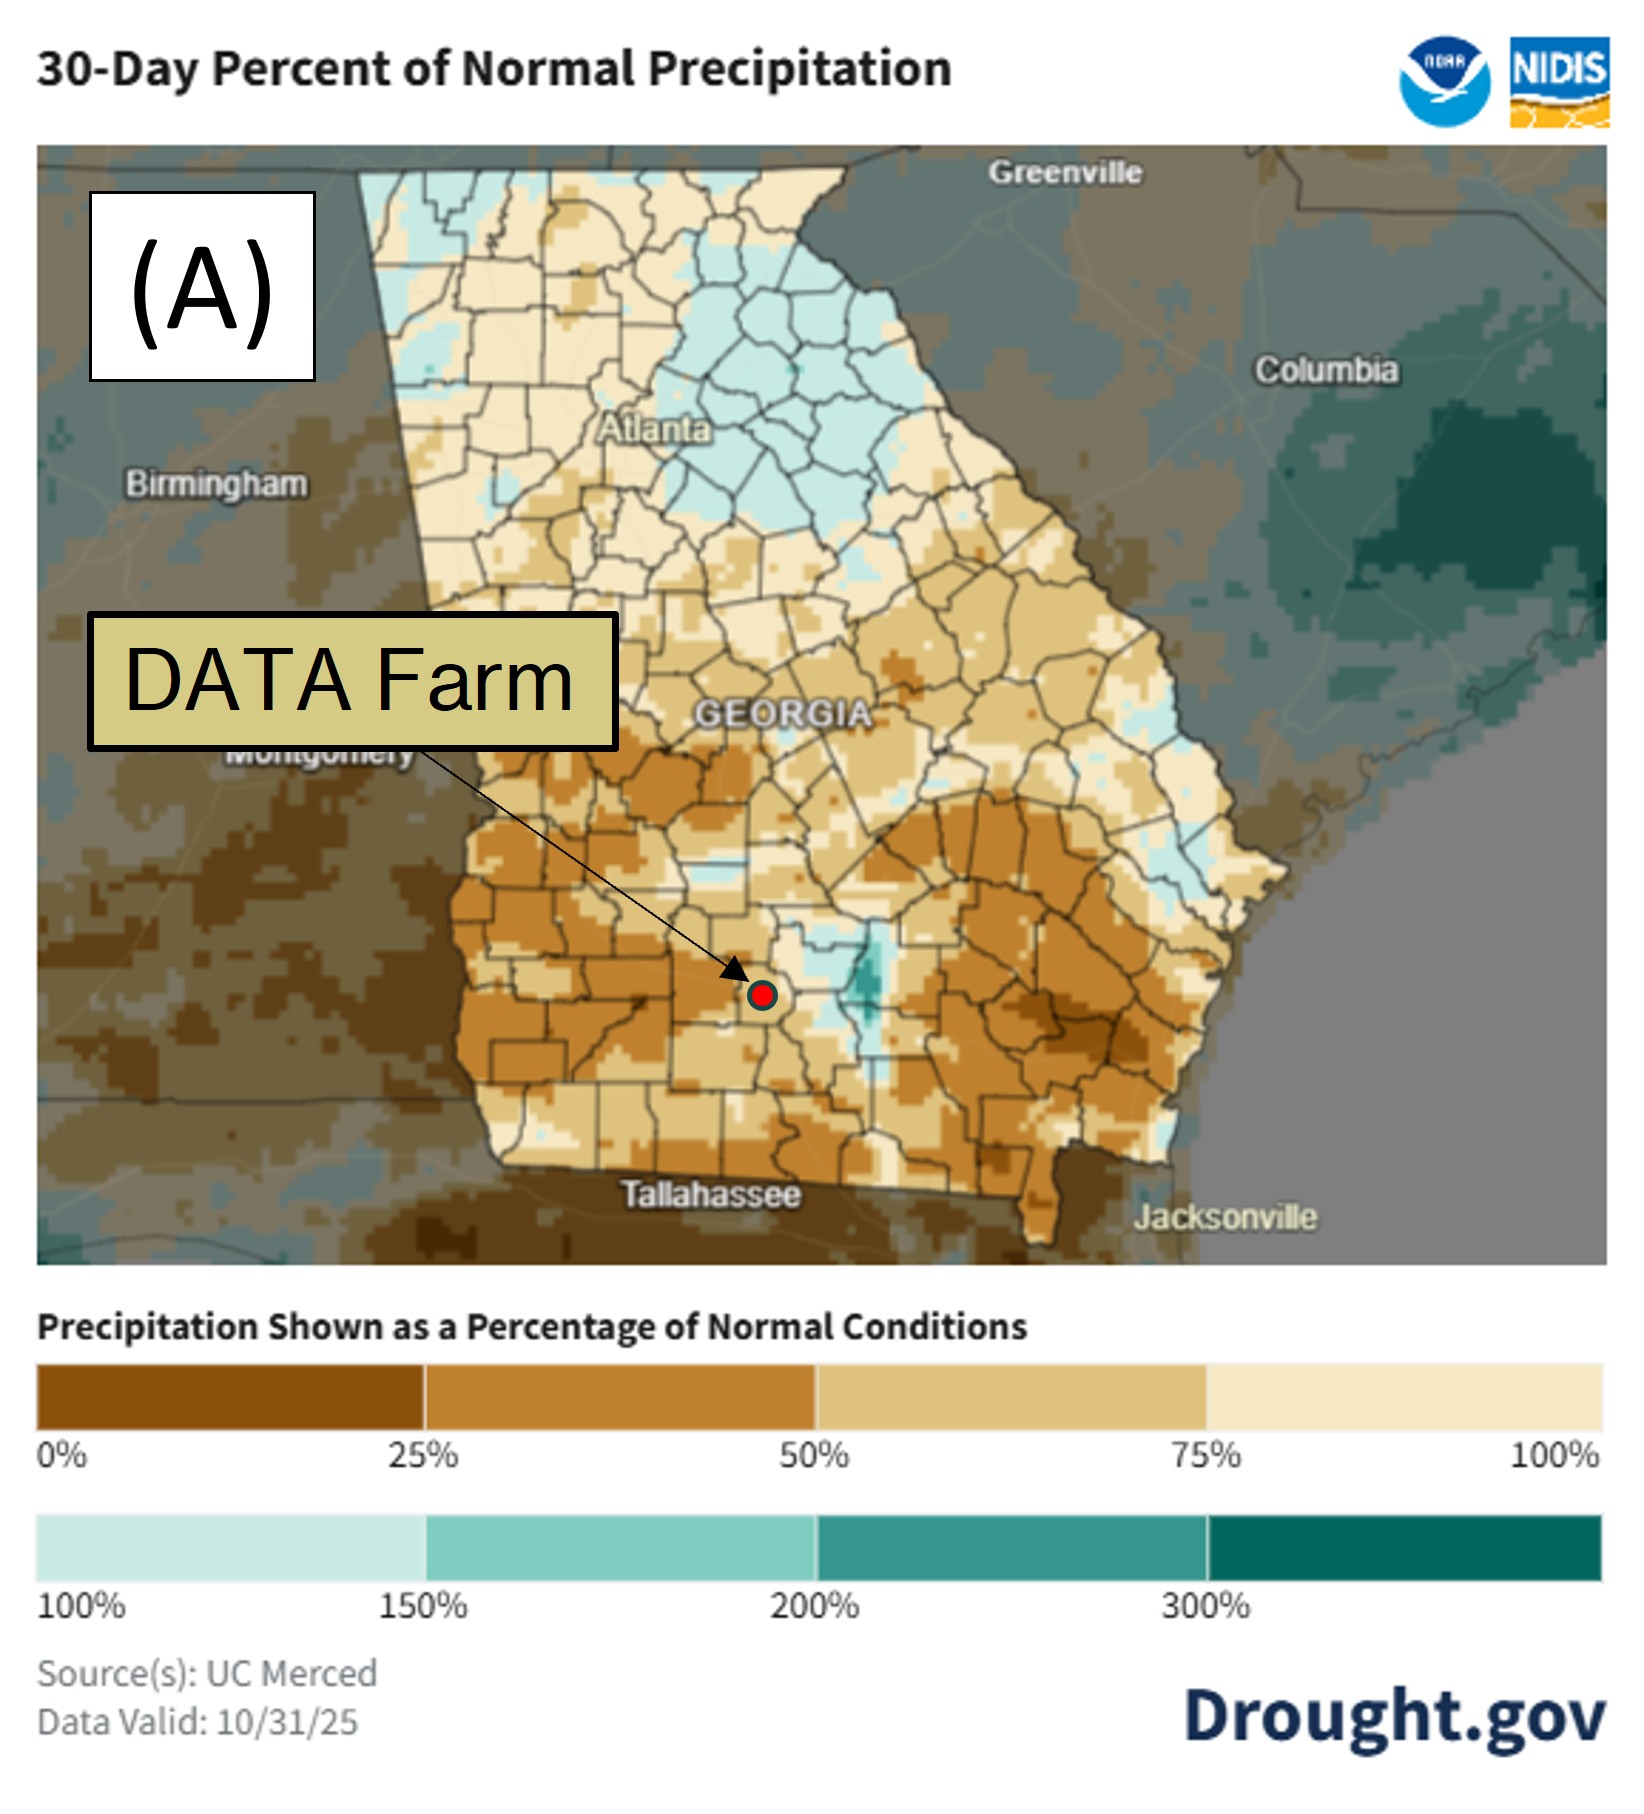
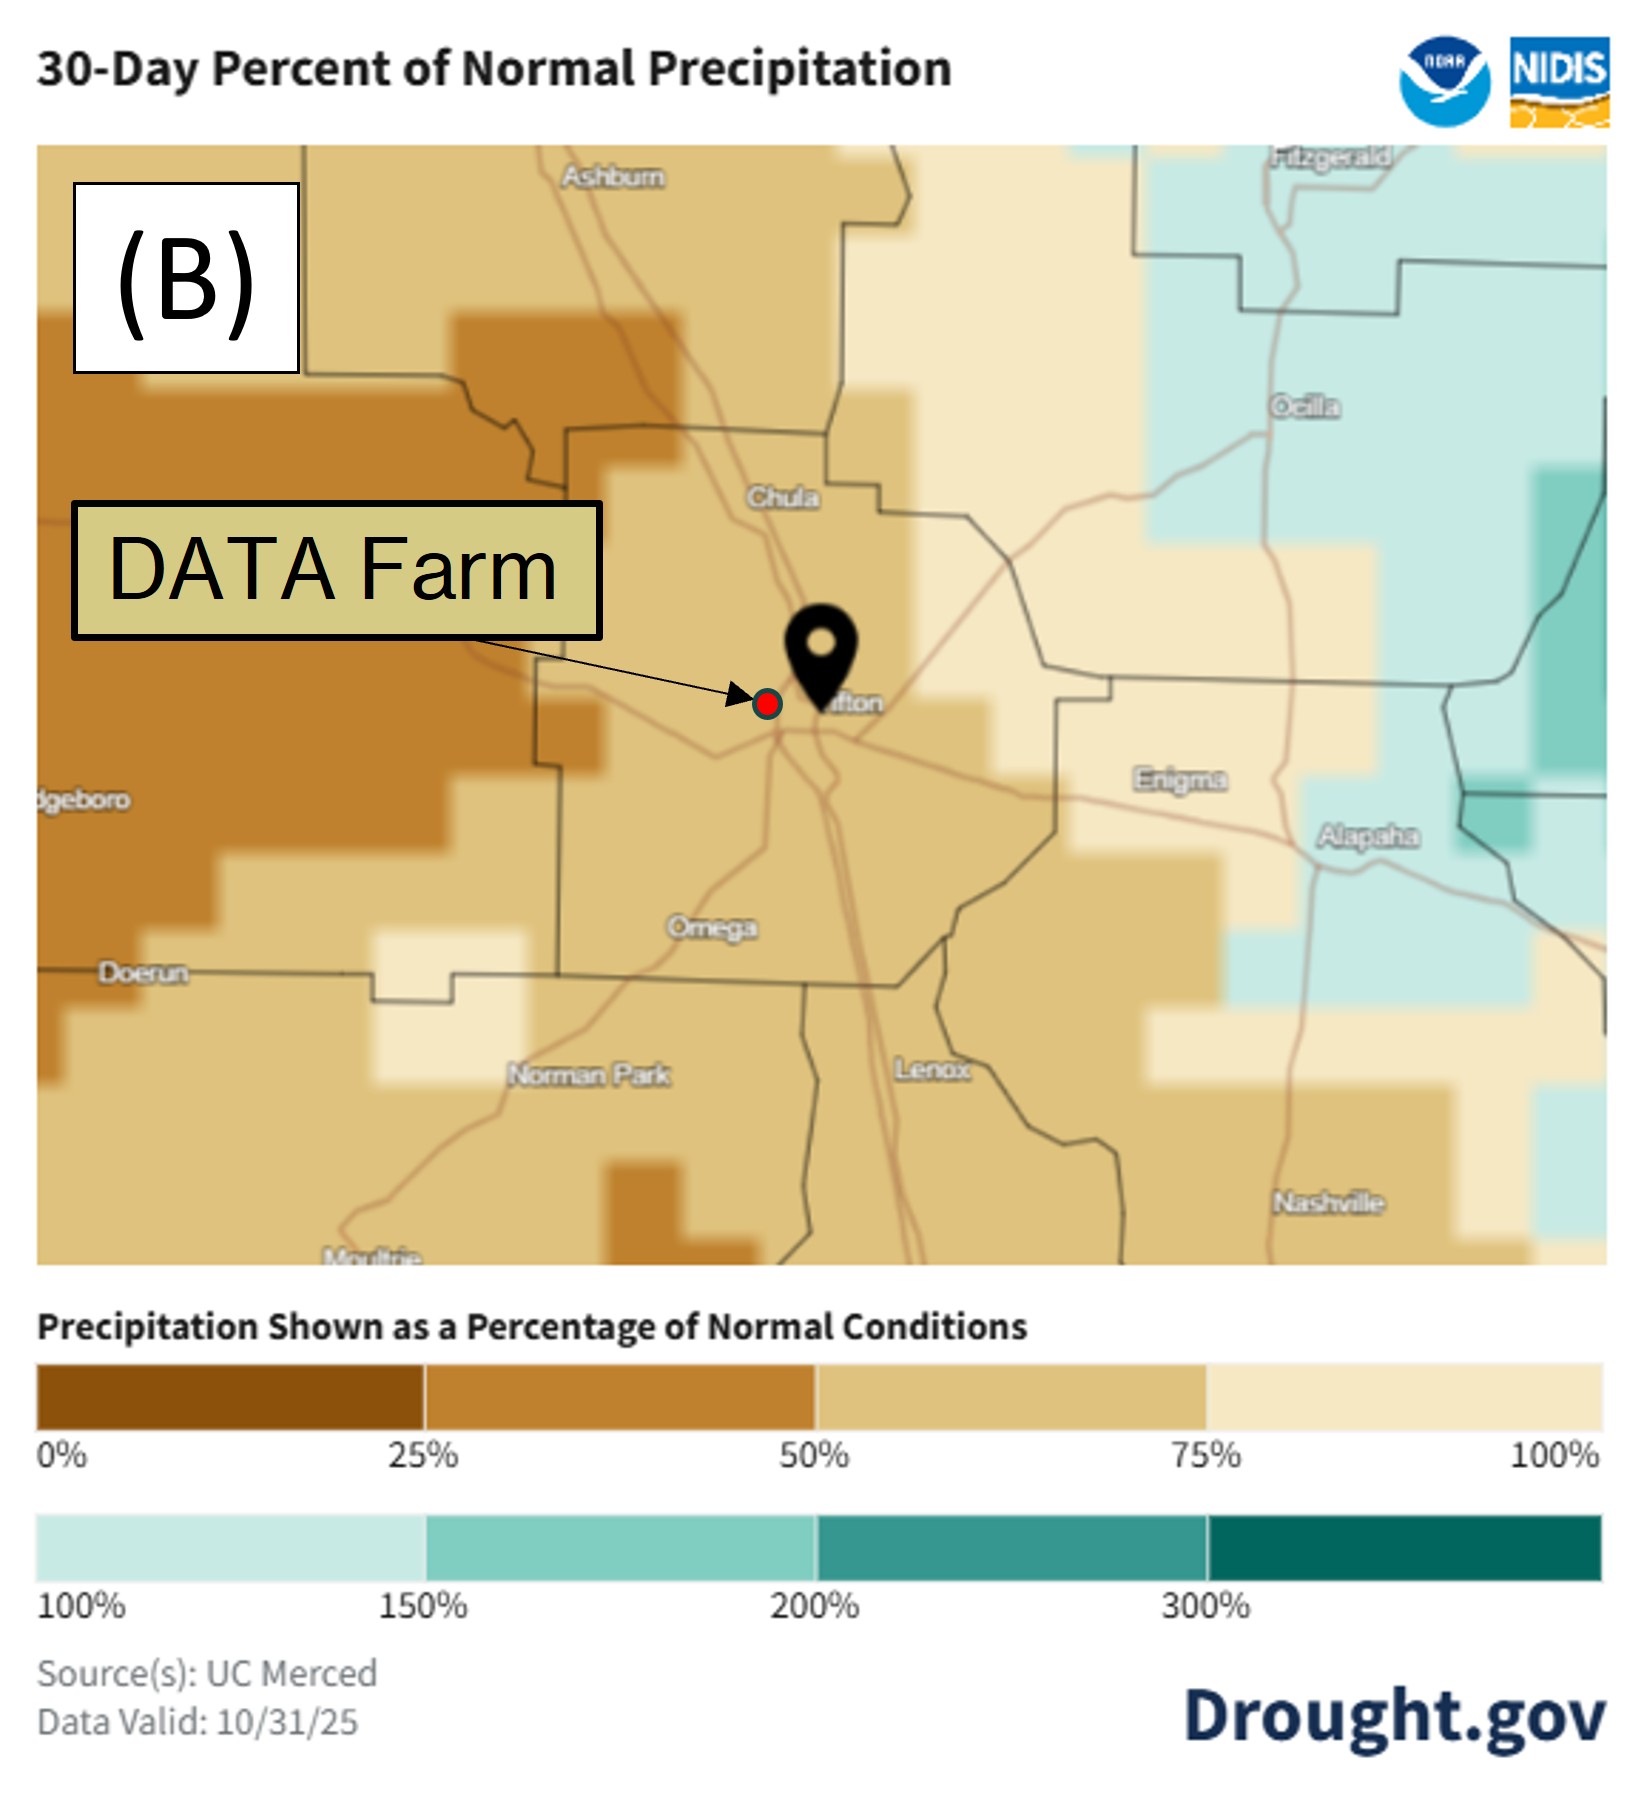
Precipitation trends shownas a percentage of normal conditions (average 1991–2020) for the 30 days prior to October31stare shown in Figure 11 for Georgia (A) and Tift County (B). These maps show the variation in rainfall received across the state, and that the area around the DATA Farm received between 25% and 50% belownormal rainfall during the previous 30 days.The on-site weather station measured approximately 1.3 inches below average. The regions experiencing lower than average rainfall align with the maps above in Figure 10,showing drought conditions increasing across the state.


