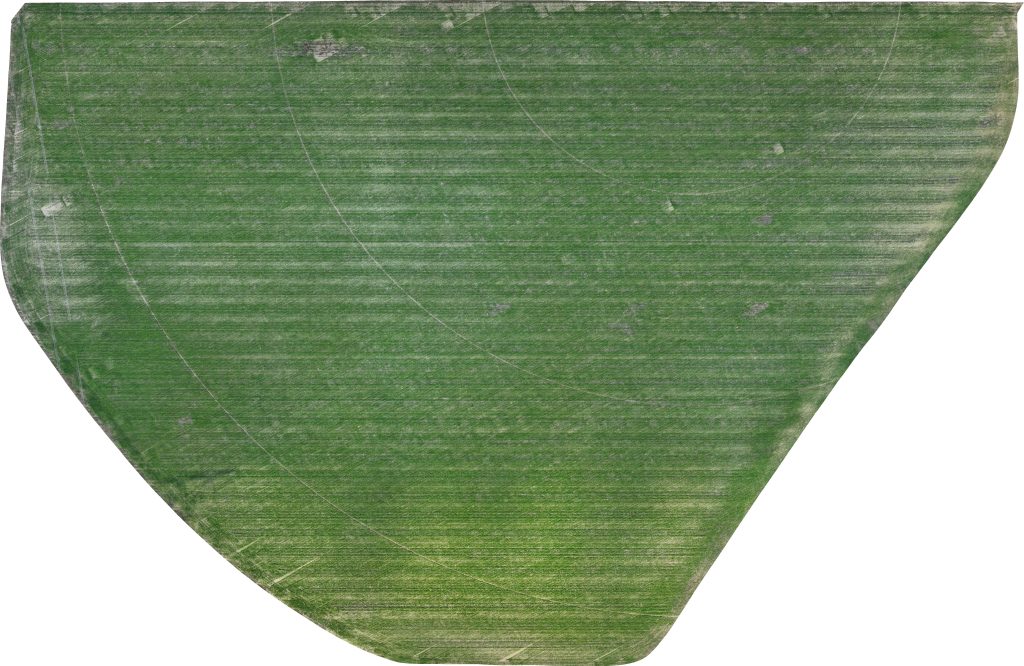
West Field – Cover: Winter Forage Mix, 33 DAP*; 2026 Crop: Dryland Cotton
*As of 12/1/2025
Overview of Activities
The continued drought conditions of November created an unusual need to irrigate winter cover crops. The rain predicted following the planting of South Pivot and West Field resulted in only 0.4 inches of rainfall. On November 3rd an application of 0.5 inches of irrigation was applied to South Pivot to ensure seed germination for the winter grazing mix planted at the end of October. The following day an irrigation application of 0.75 inches was made on North Pivot to settle the deep tilled soil for planting of the grazing mix. On the morning of November 8th, the DATA Farm received 0.5 inches of rain, which also helped settle the soil. Front Field and North Pivot were planted by an ABAC student on November 13th using the same John Deere 450 grain drill used previously. The drill was set at the same rate of 98 pounds per acre for the winter grazing mix.
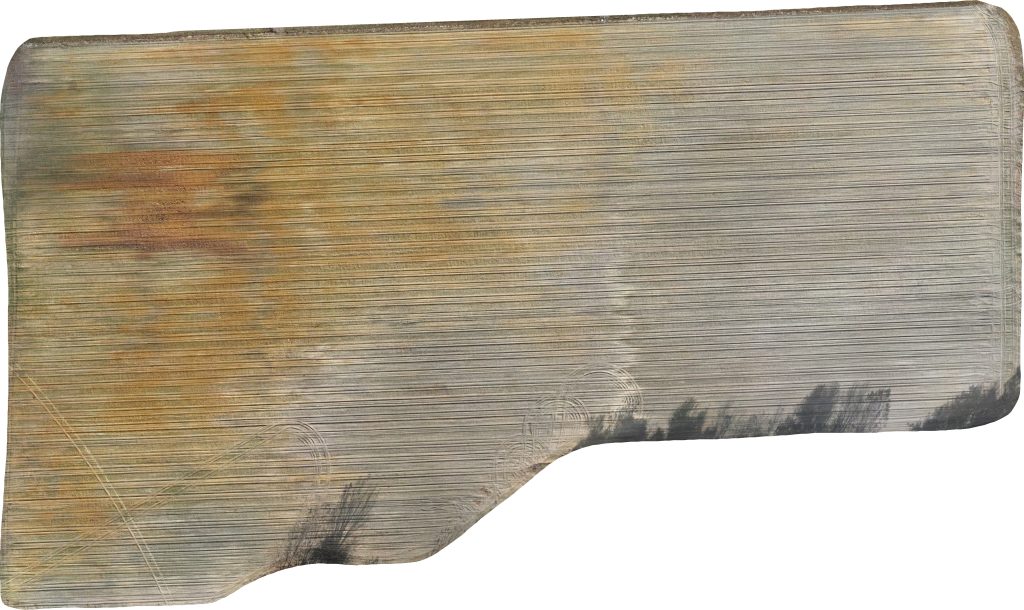
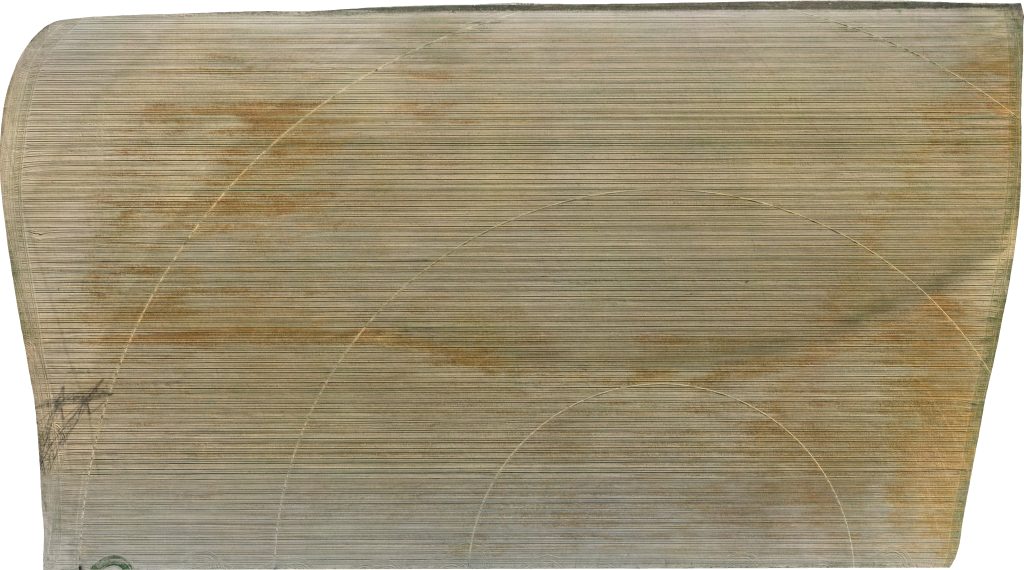
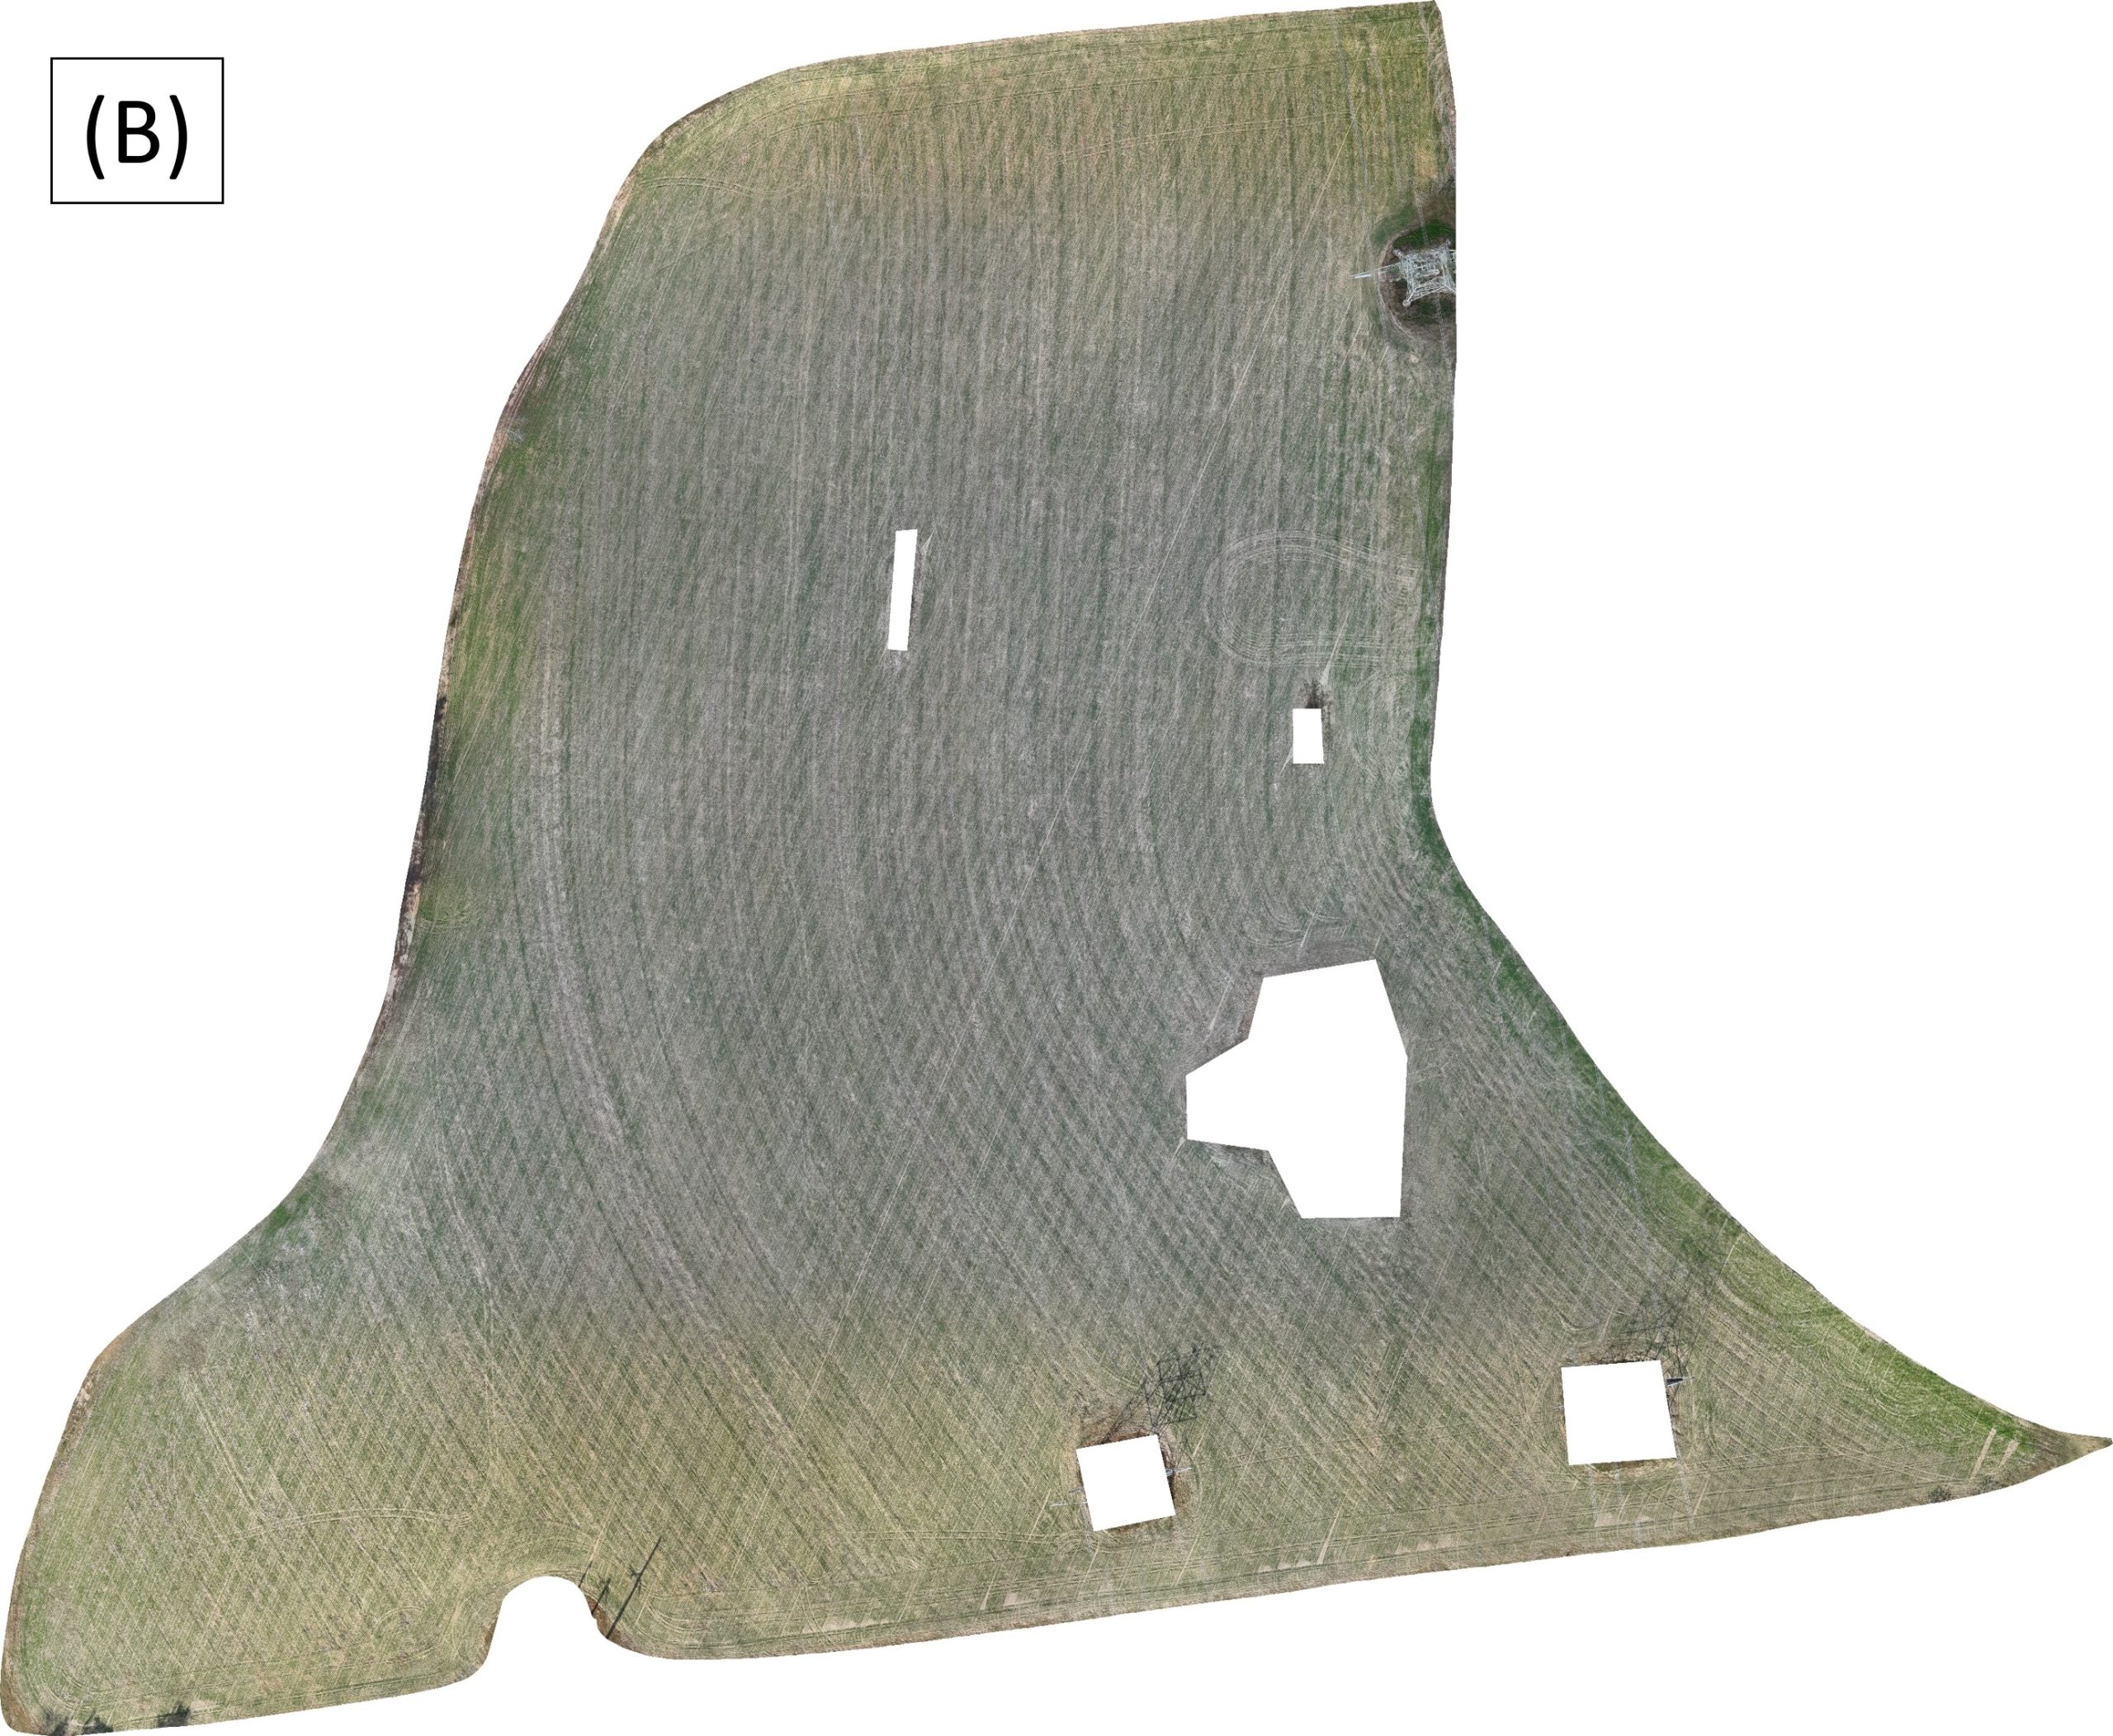
Due to the continued dry conditions with warmer temperatures (3°F above average) after planting North Pivot on November 13th, an irrigation application of 0.5 inches was made on this field. The following day, another application was made to South Pivot to provide moisture for the actively growing seedlings. As dry conditions persisted, a third irrigation application of 0.5 inches was made on both North Pivot and South Pivot on November 18th and 19th, respectively. The application in North Pivot was to reduce crusting as the seedlings were emerging from the soil, and the application to South Pivot was to facilitate the actively growing crop. The growth advantage provided by irrigation can be seen visually by comparing UAV images of South Pivot (Fig 1A) and West Field (Fig 1B) that were planted a day apart.
The monthly temperature trends and rainfall recorded by the on-site weather station for Novemberare showninFigure2.
Figure 2. Monthly weather for November 2025.
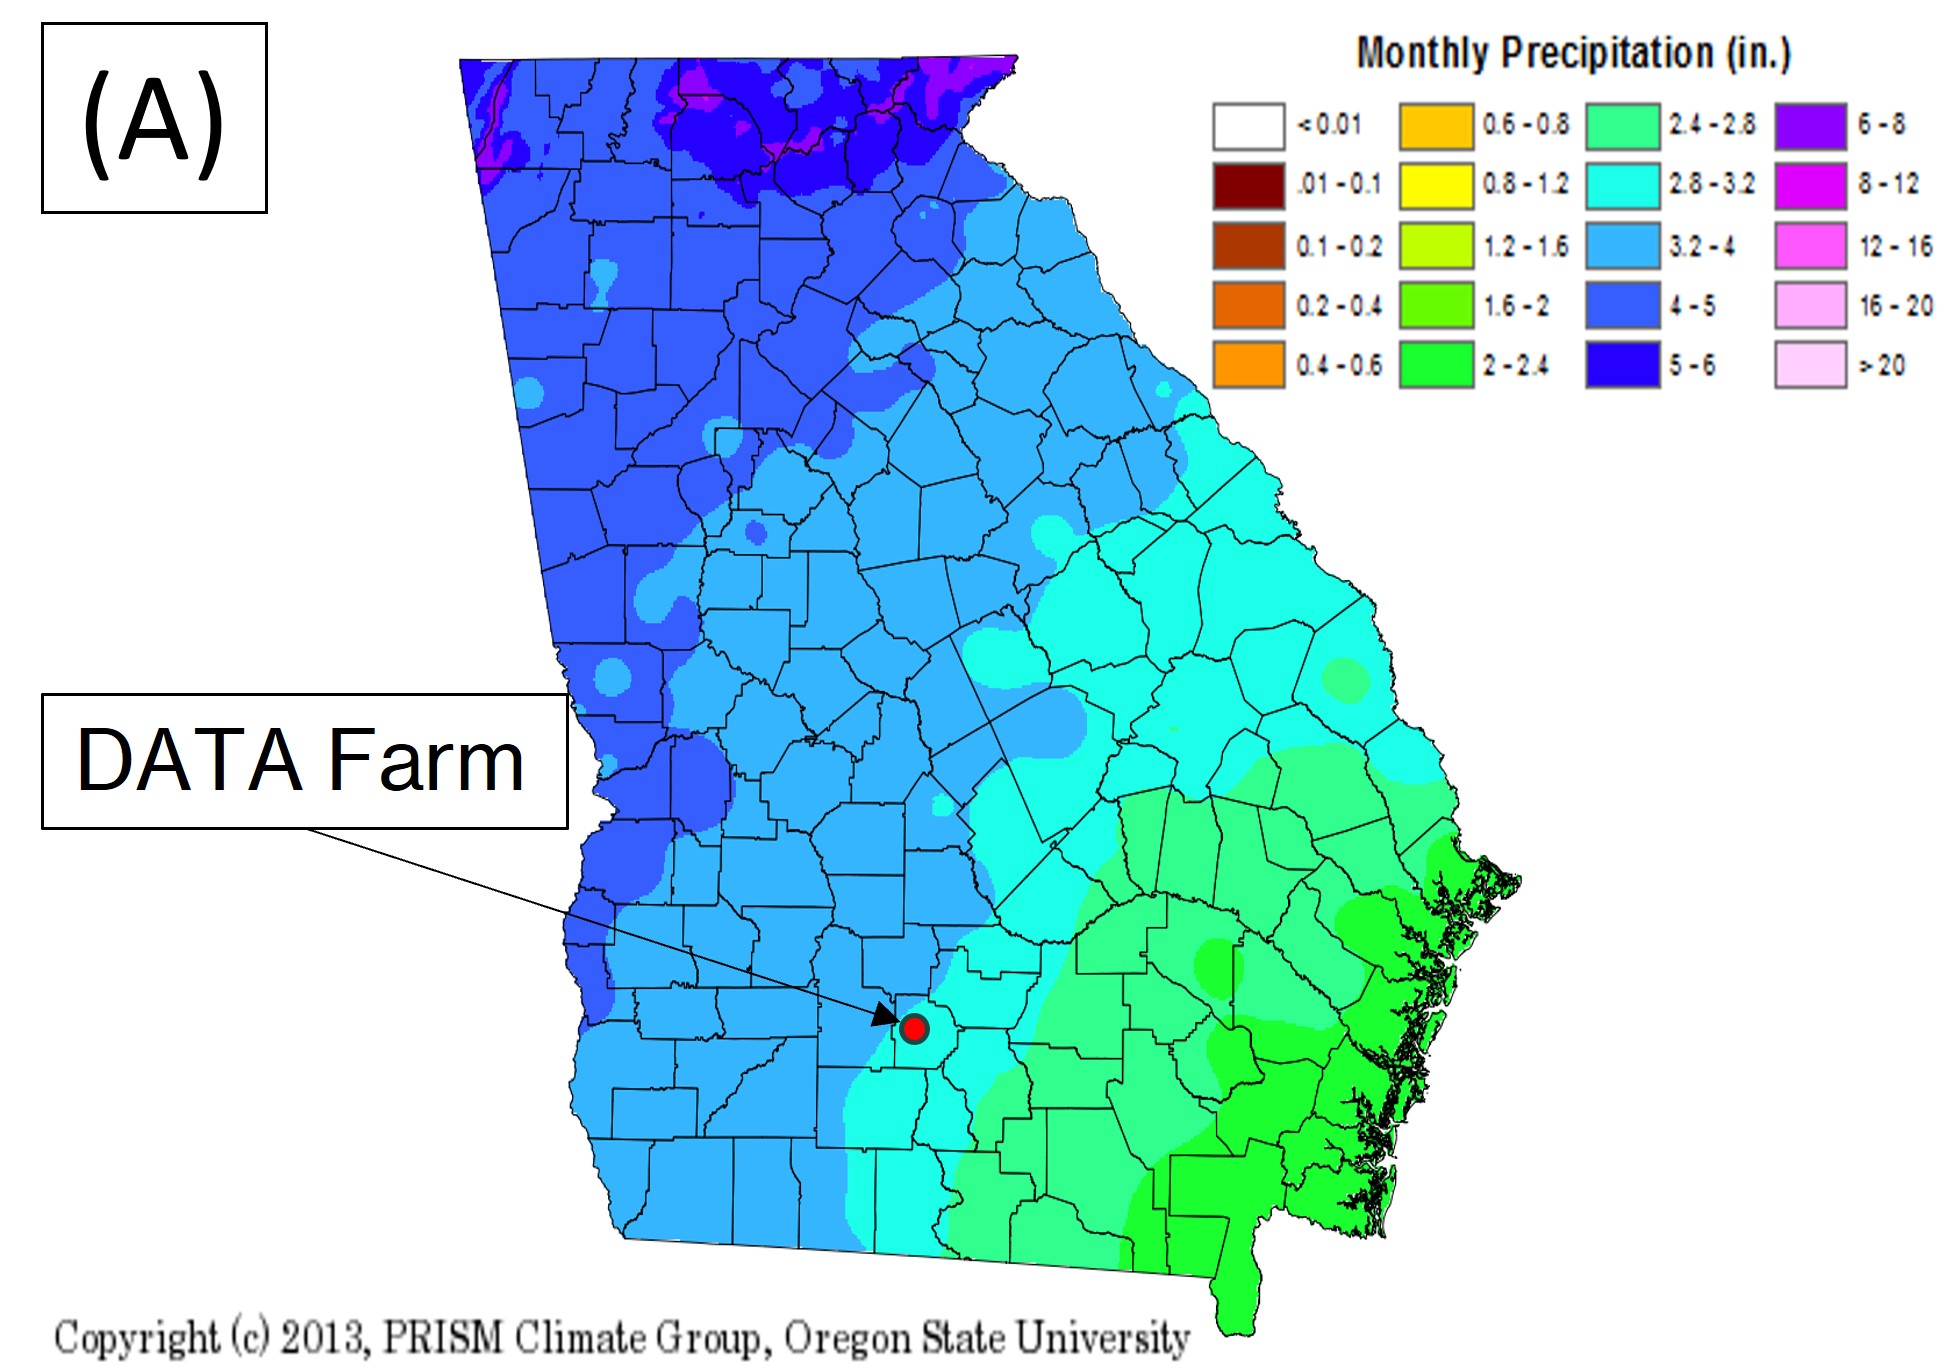
For historical comparison, Georgia climate maps based on data from 1981 to 2010 (UGA’s Weather Network) are shown in Figure 3 for the month of November.
The biggest impact of the weather during November was the continuation of drought conditions. Only 0.6 inches of rainfall was recorded at the DATA Farm during November, extremely below the average (2.8 – 3.2 inches). The DATA Farm weather station has only recorded 1.9 inches of rainfall over the previous three months, which is 8 inches below the average for this period. This lack of rainfall delayed planting of winter grazing crops and created the need to use irrigation after planting.
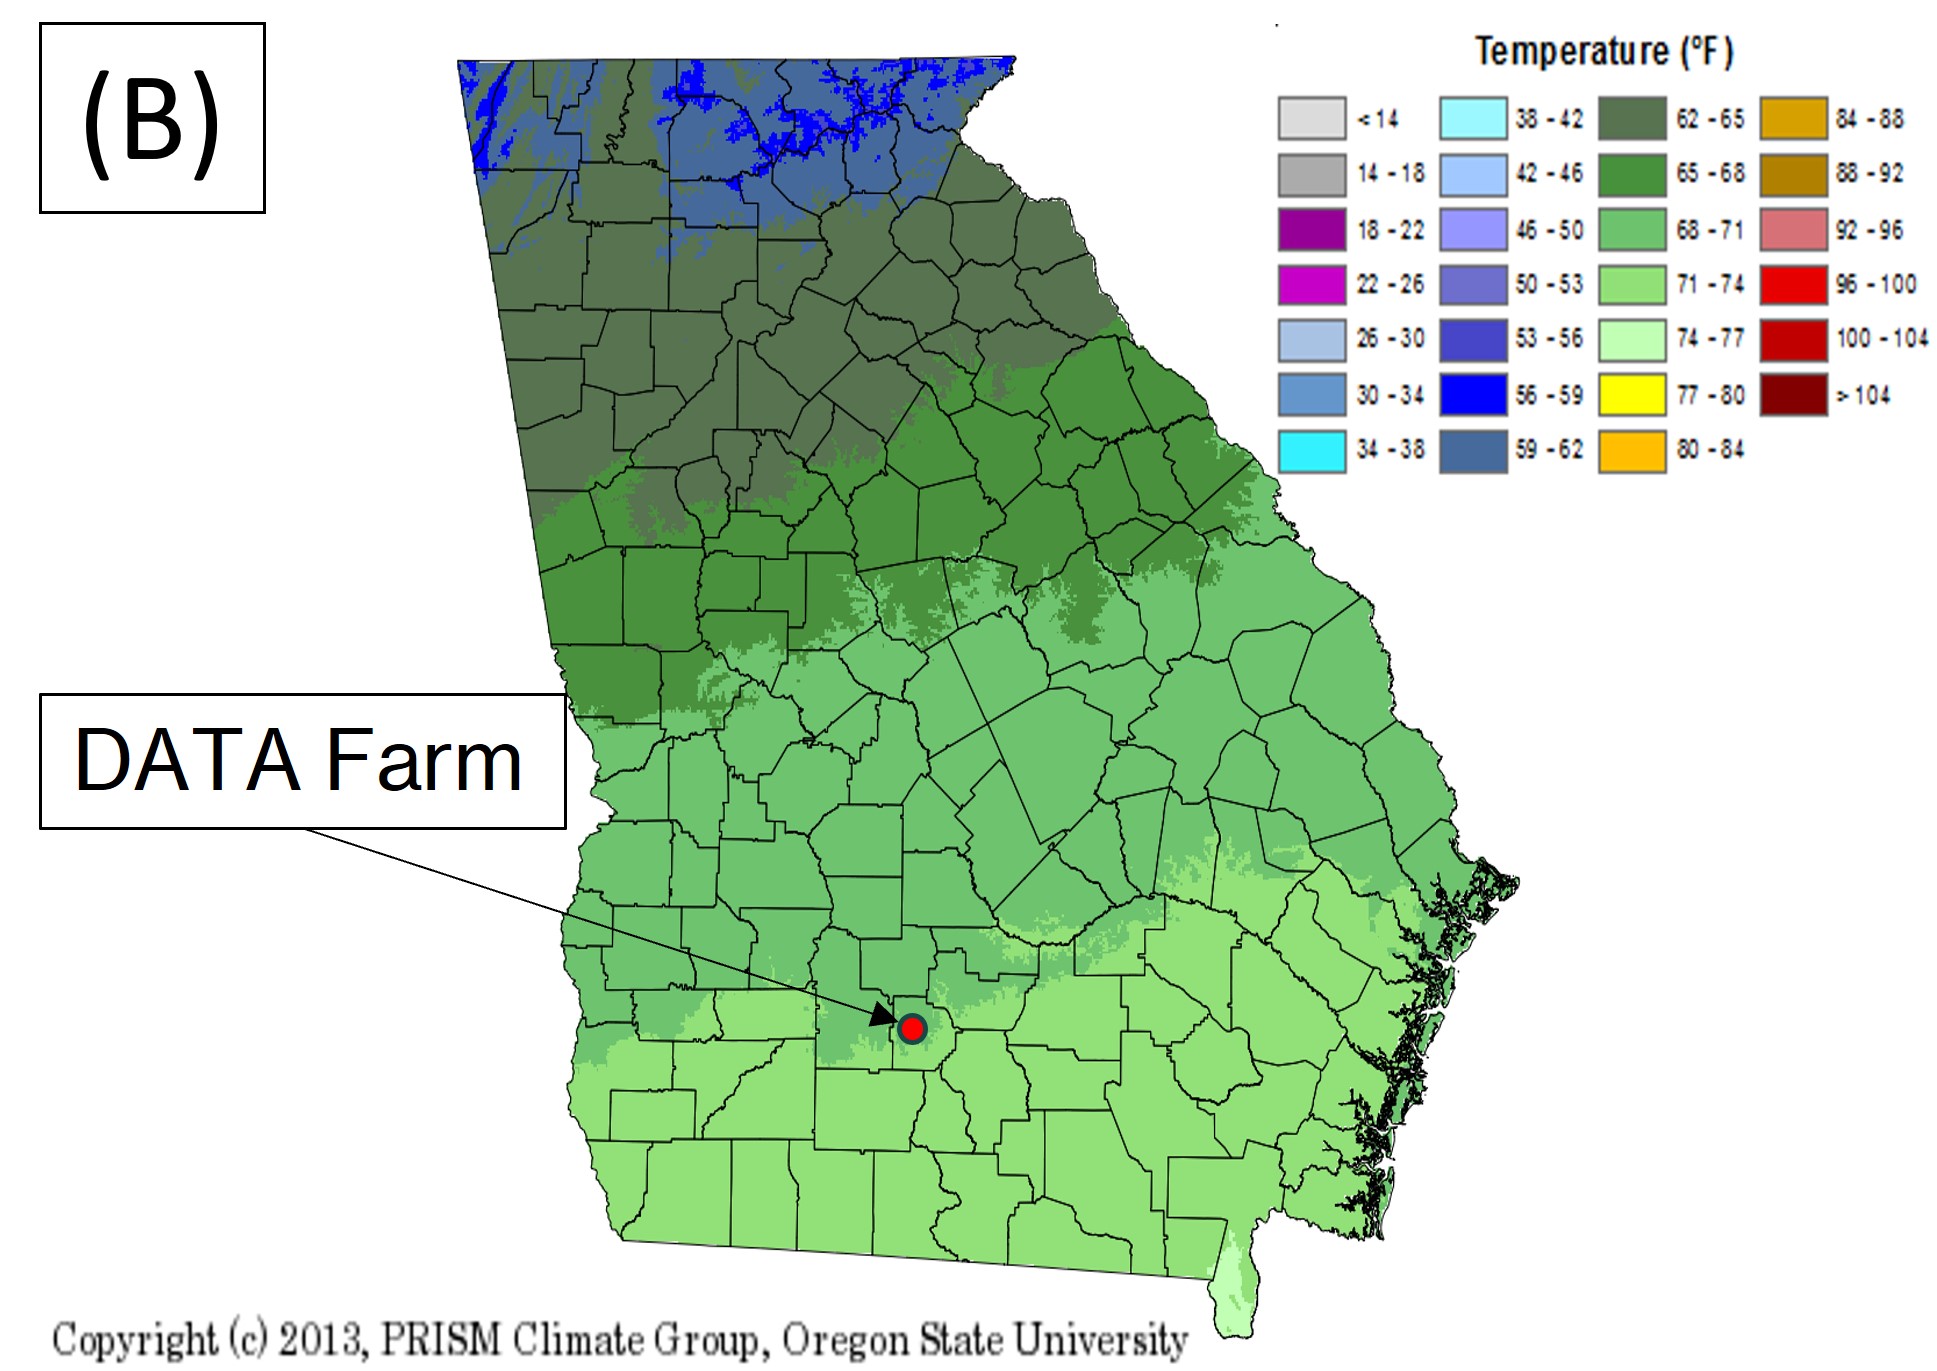
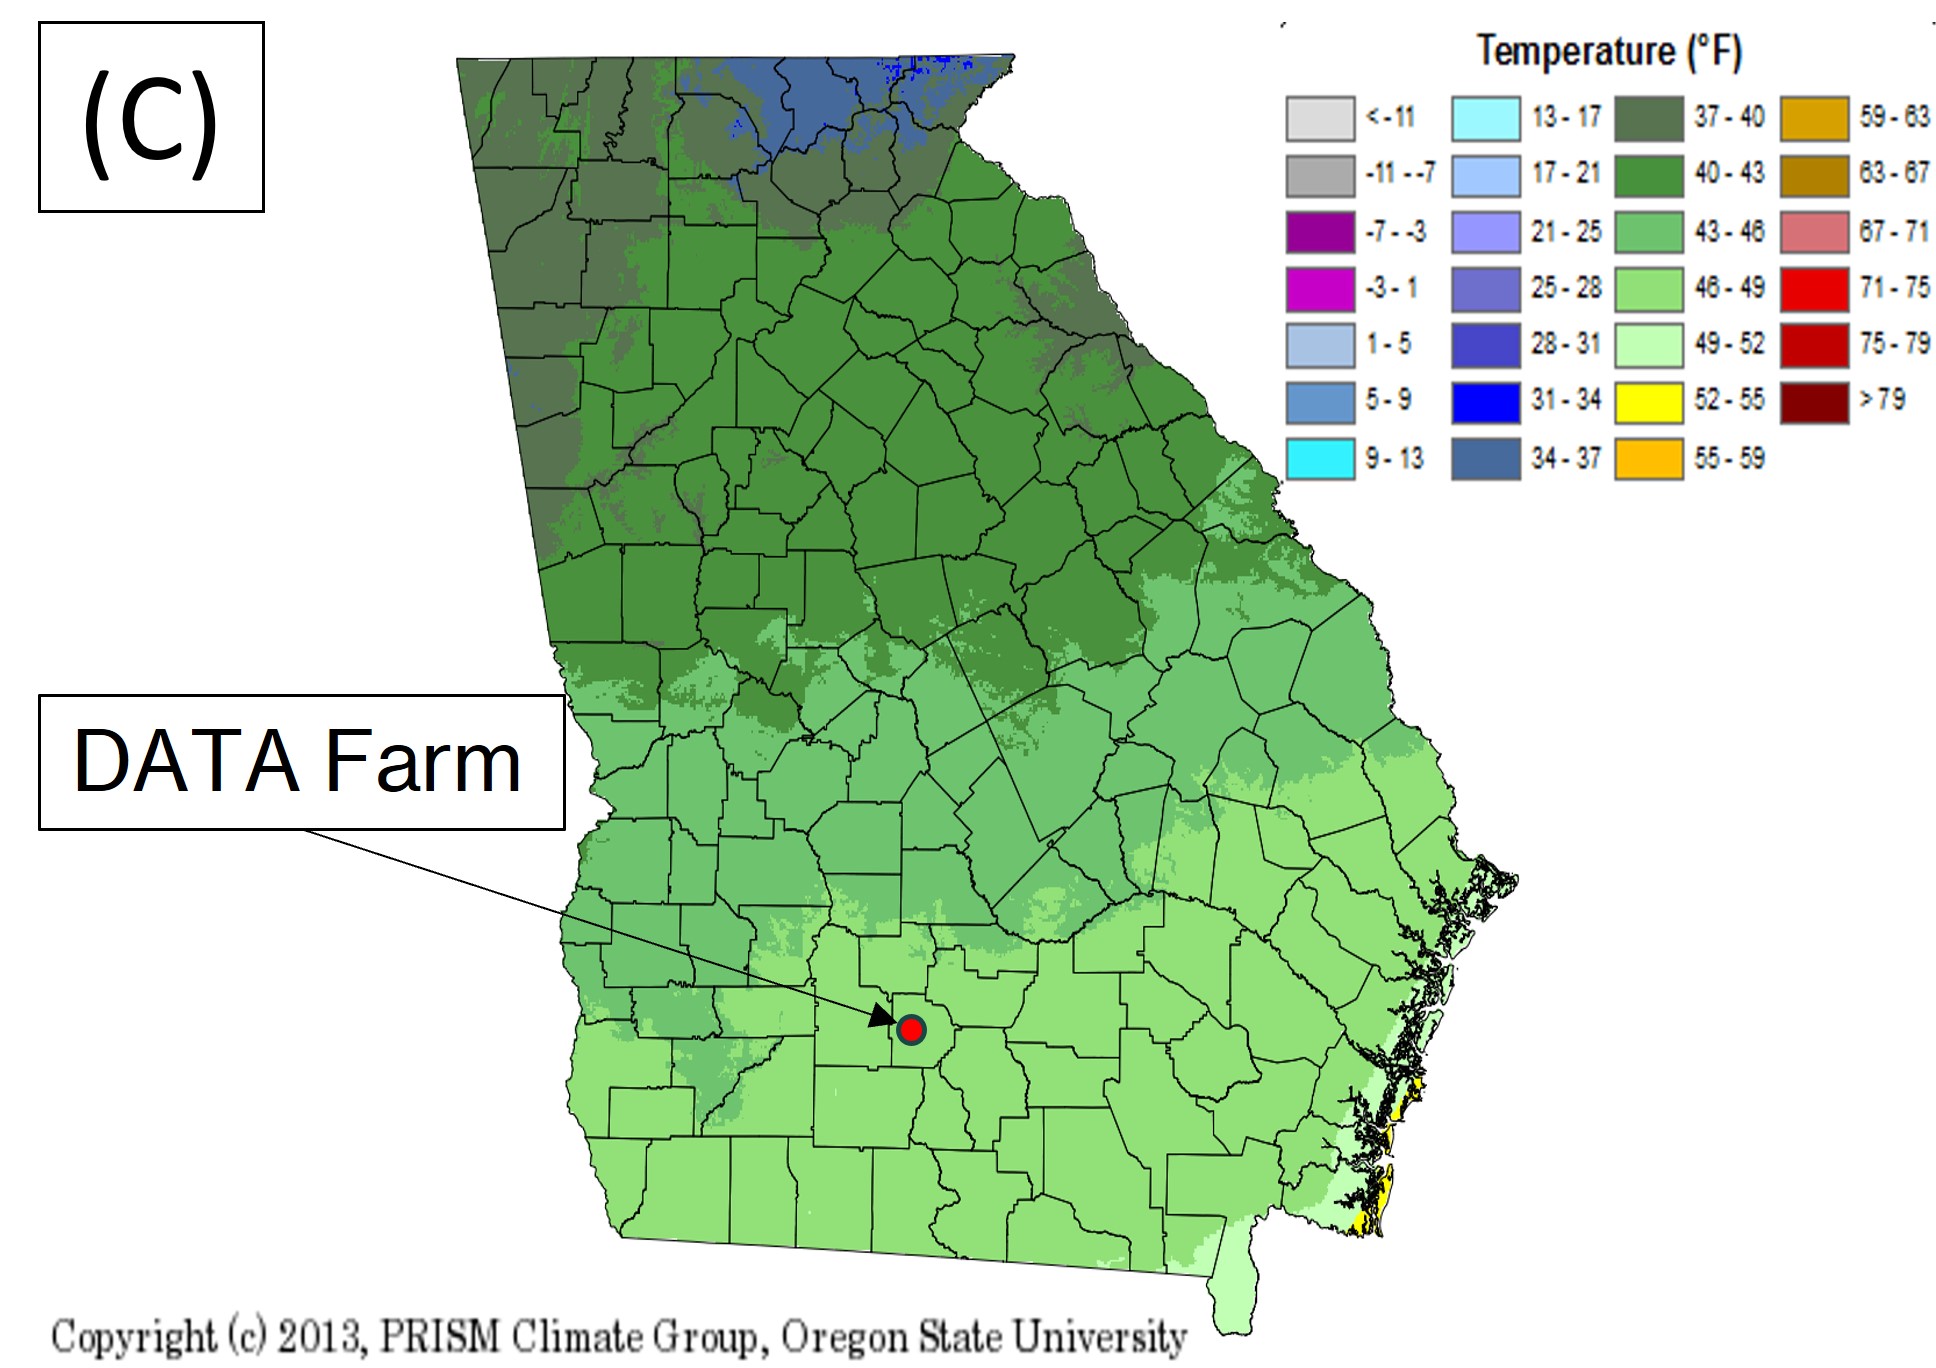
The average of recorded maximum temperatures for the month was 74°F, which is 3°F higher than the average historical range of 68°F – 71°F (Figure 3B), and the average of recorded minimum temperatures was 47°F, which is within the average historical range of 46°F – 49°F (Figure 3C). Even though temperatures were slightly above normal, November temperatures continued the cooling trend for the end of the 2025 crop season.
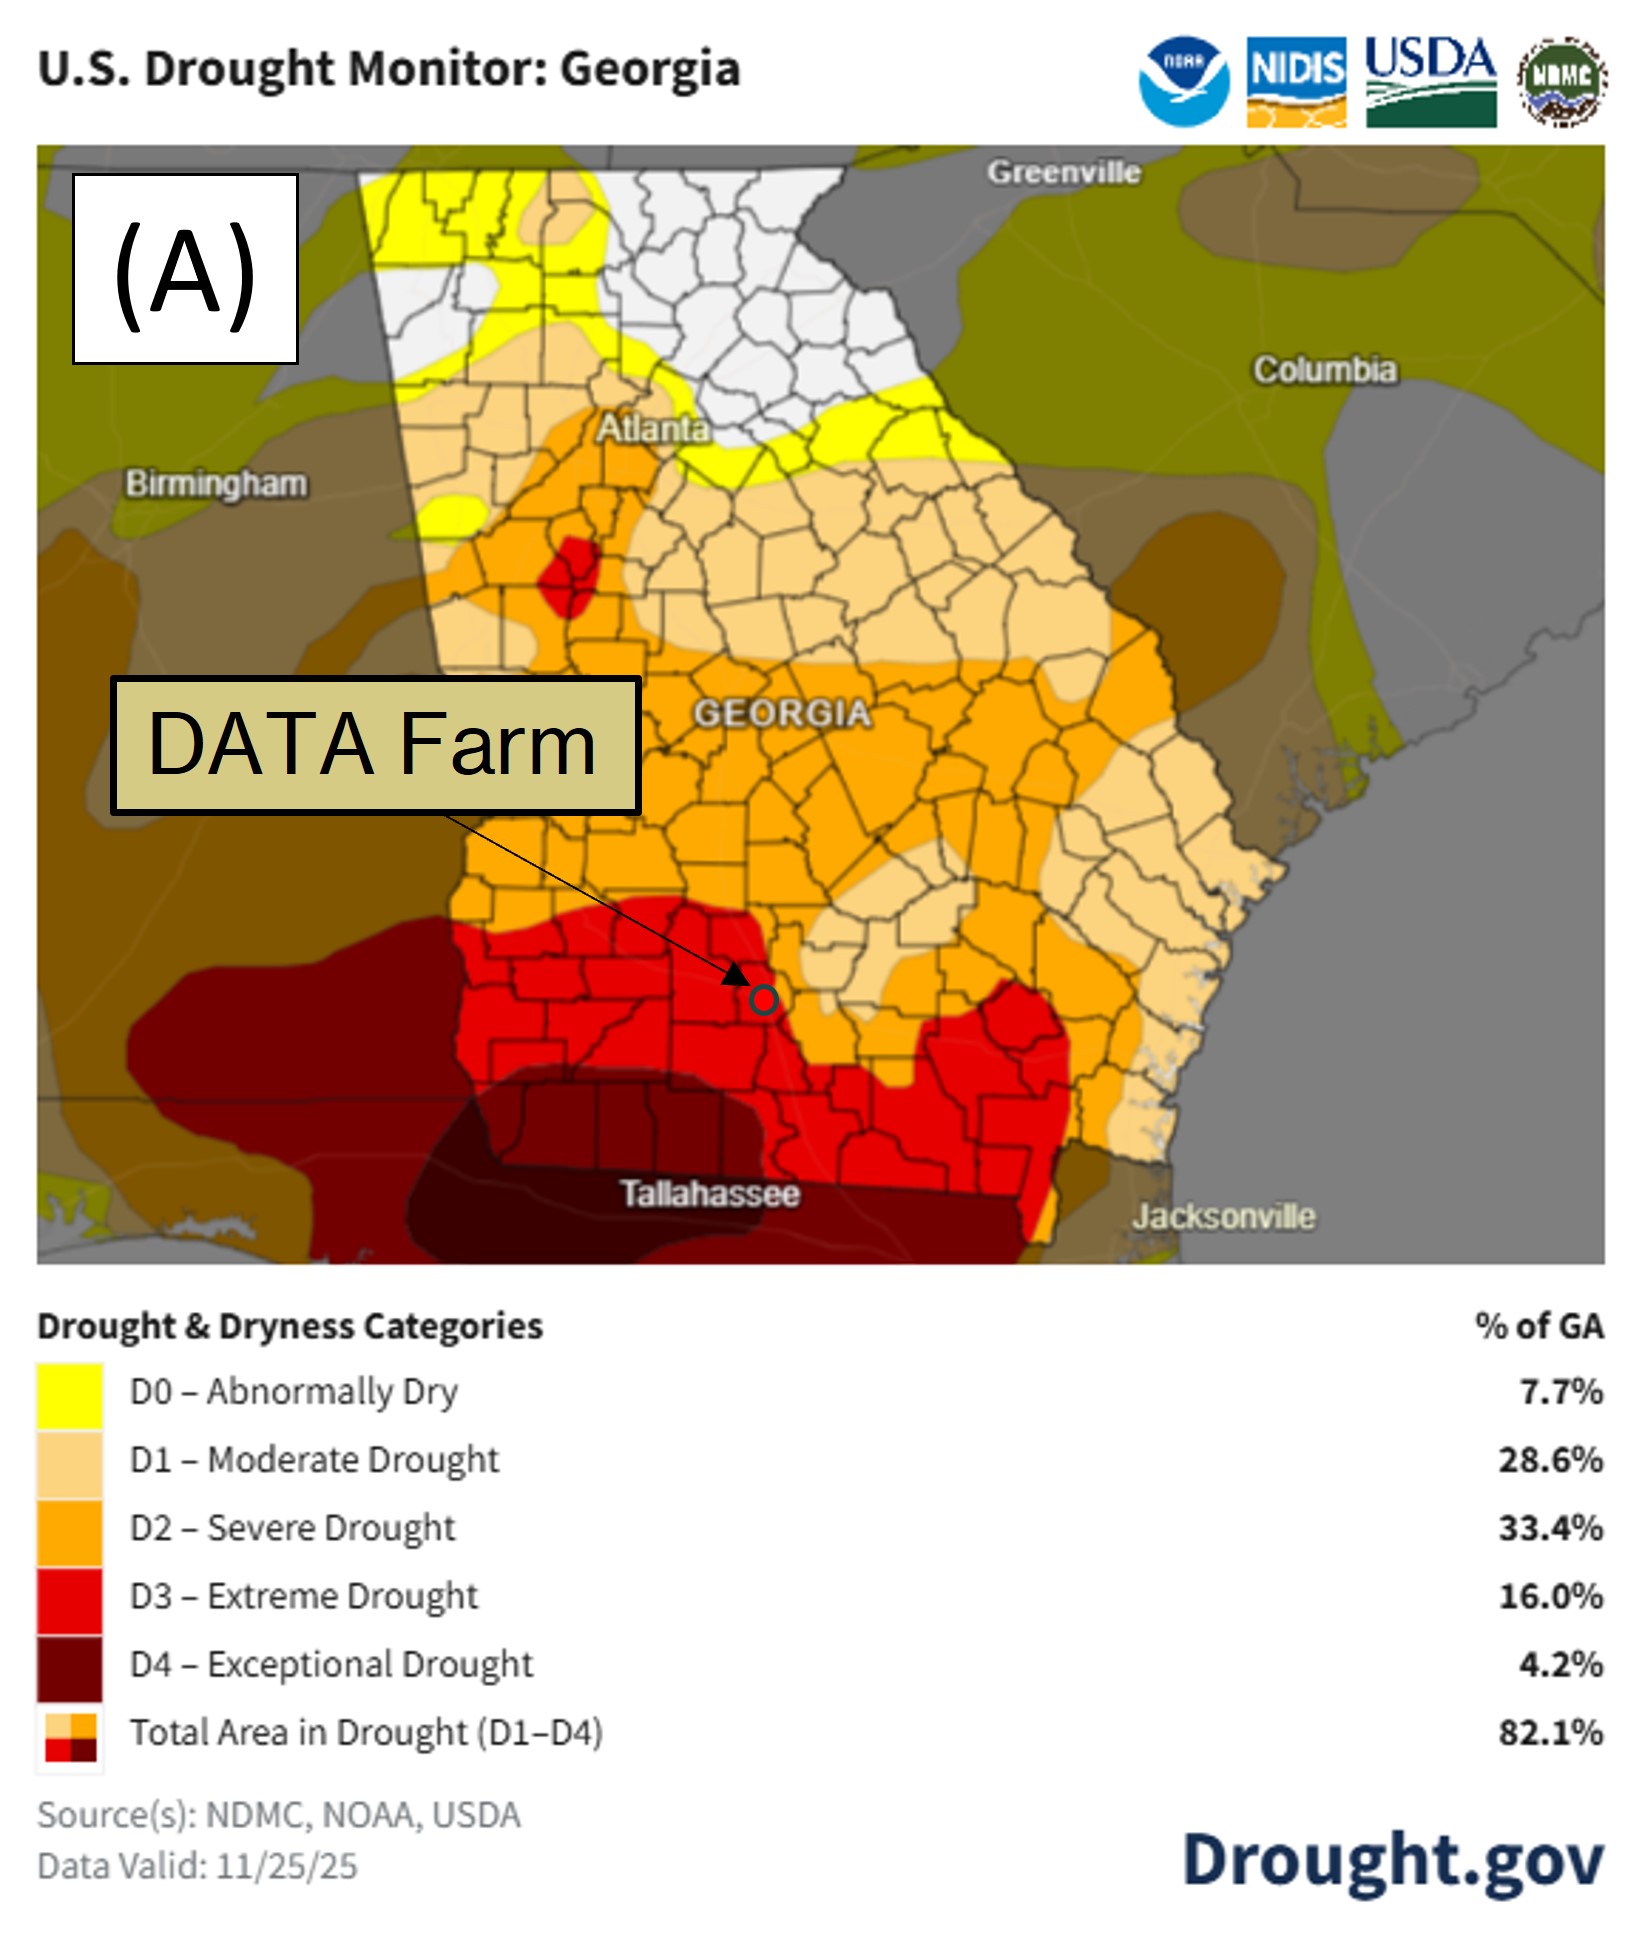
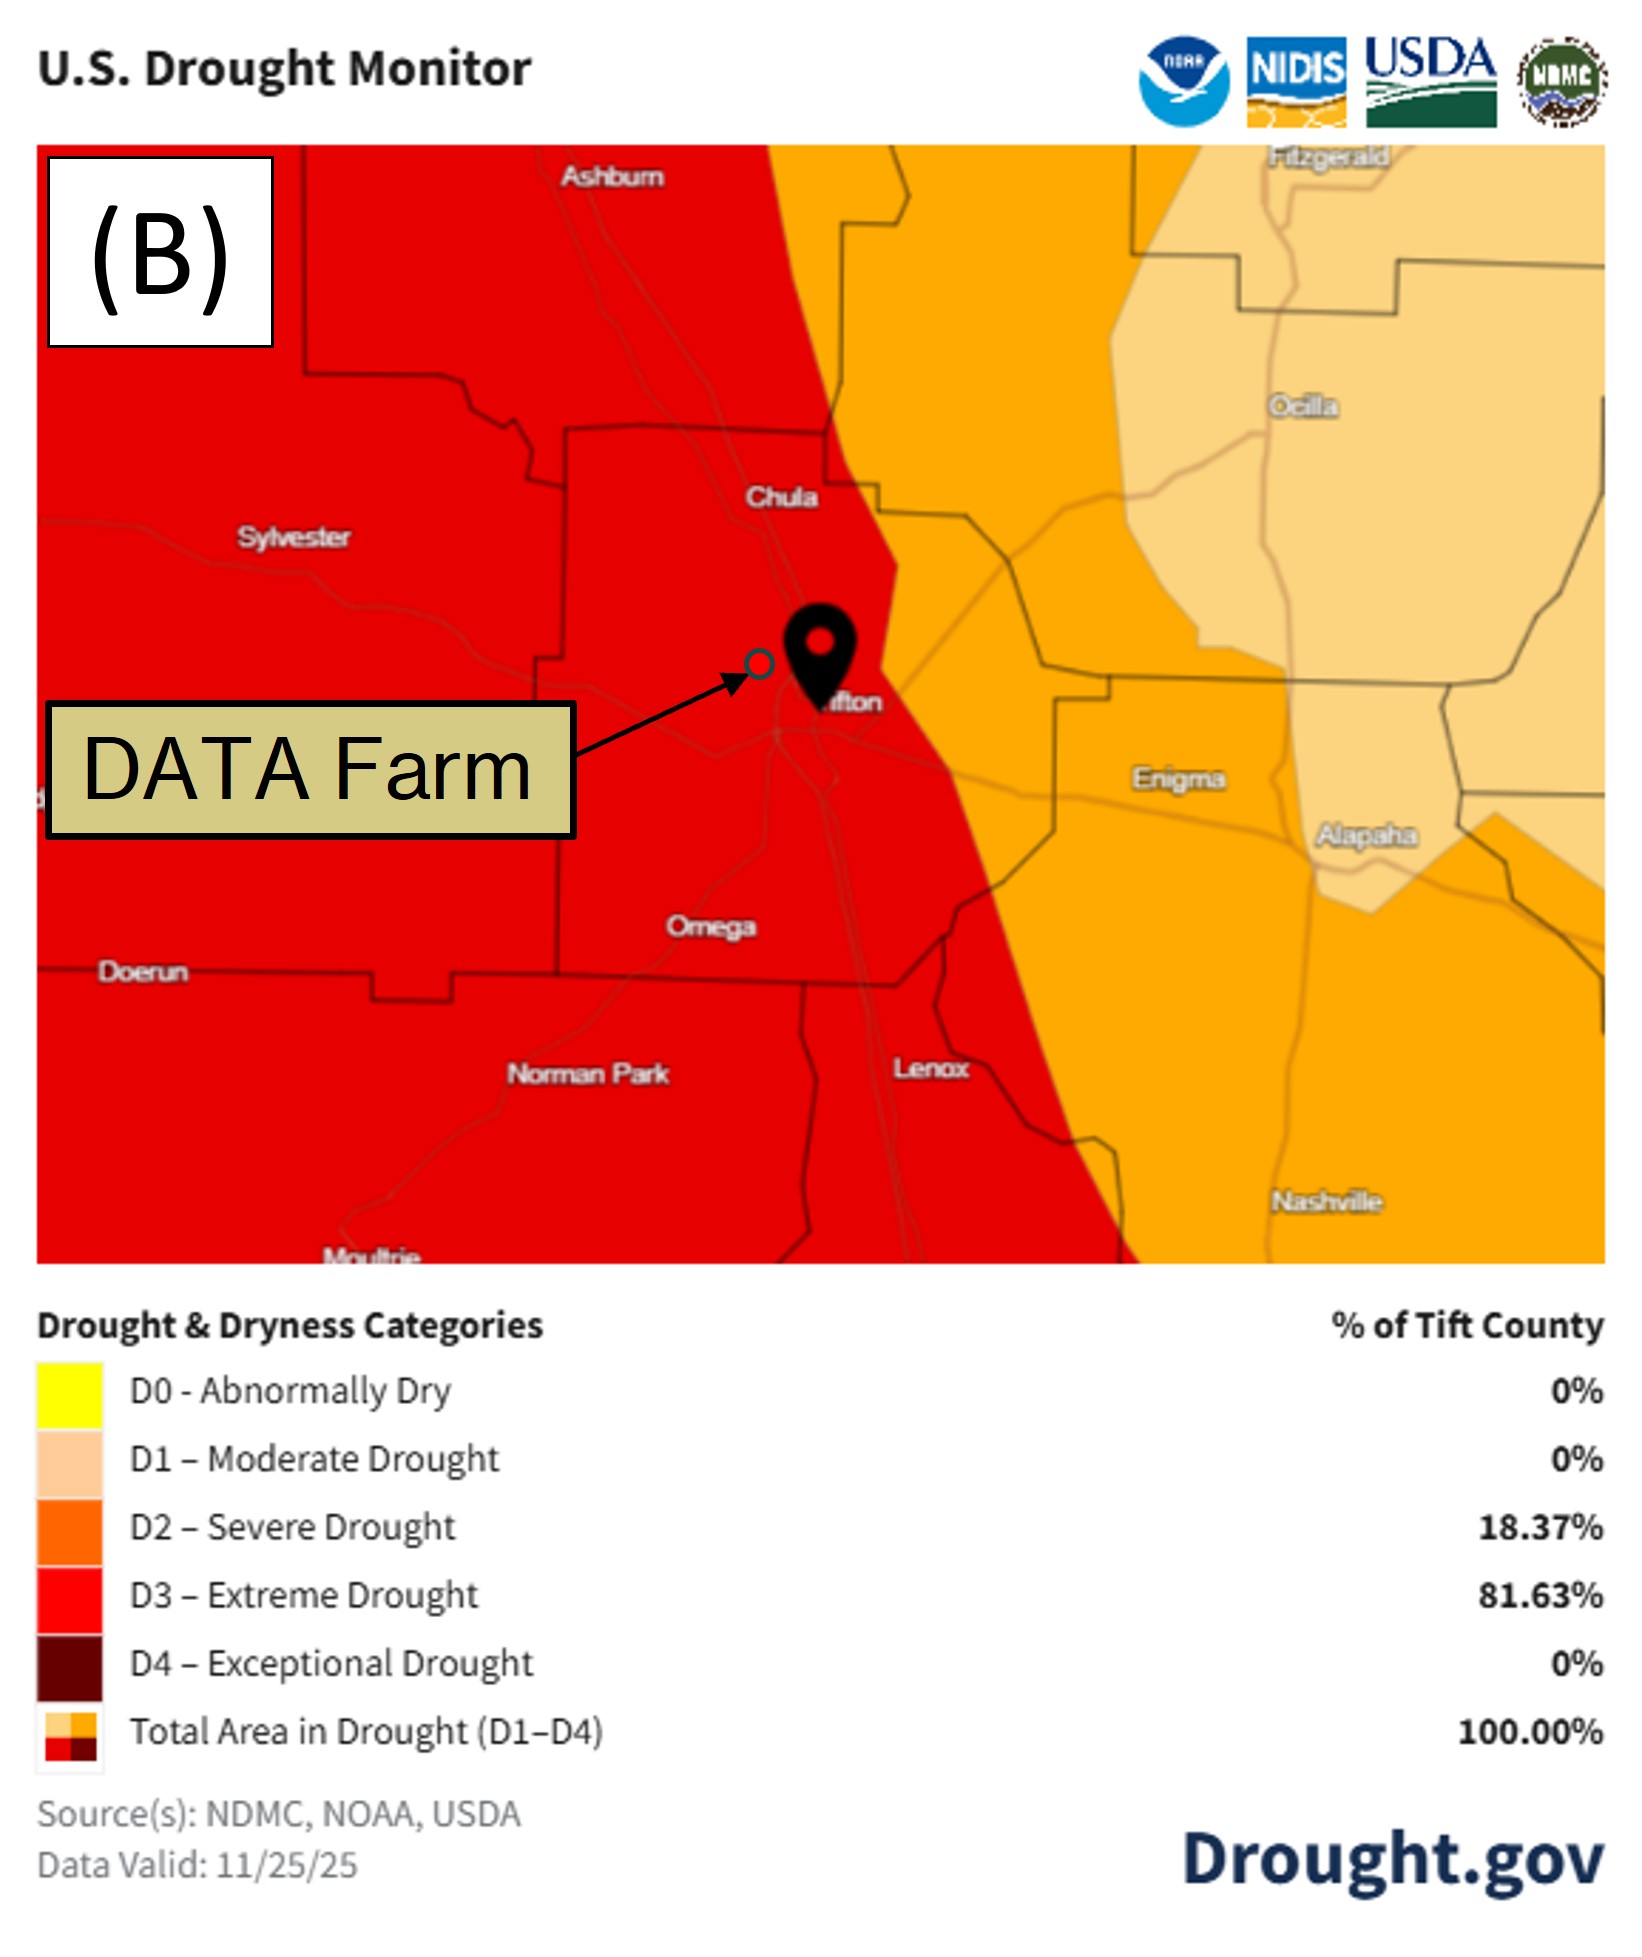
Figure 4A shows the drought monitor map as of November25th, from the National Integrated Drought Information System for Georgia. Abnormally dry conditions are now present in 7.7% of the state,with 28.6% experiencing moderate drought conditions,33.4% experiencing severe drought conditions, 16% experiencing extreme drought conditions, and 4.2% experiencing exceptional drought conditions. The total area of the state experiencing drought conditions is 82.1%, an increase of 2.4%from 79.7% at the end of October. Figure 4B shows that100% of Tift Countyis experiencing drought conditions which is predominantly experiencing extreme droughtconditions (81.63%) with 18.37% experiencing severe droughtconditions. The DATA Farm is located within the area experiencing extreme drought conditions.These dry conditions caused issues by delaying planting of the winter grazing crops and created the need to irrigate them. These conditions also prevented us from running the Veris implement to measure soil electrical conductivity (EC) before planting the cover. The Veris Q1000 Owner’s Manual1 recommends field conditions with at least 20% available water for proper operation.
Precipitation trends shownas a percentage of normal conditions (average 1991–2020) for the 30 days prior to November28thare shown in Figure 5for Georgia (A) and Tift County (B). These maps show the variation in rainfall received across the state, and that the area around the DATA Farm received between 0% and 25% ofnormal rainfall during the previous 30 days.The on-site weather station measured approximately 2.4 inches below average during this period. The rainfall deficit over the past 3 months (Sep 1st – Nov 30th) is 8.2 inches below average for this period. A substantial amount of rainfall over the winter will be needed to overcome this growing deficit before the spring planting season.


