
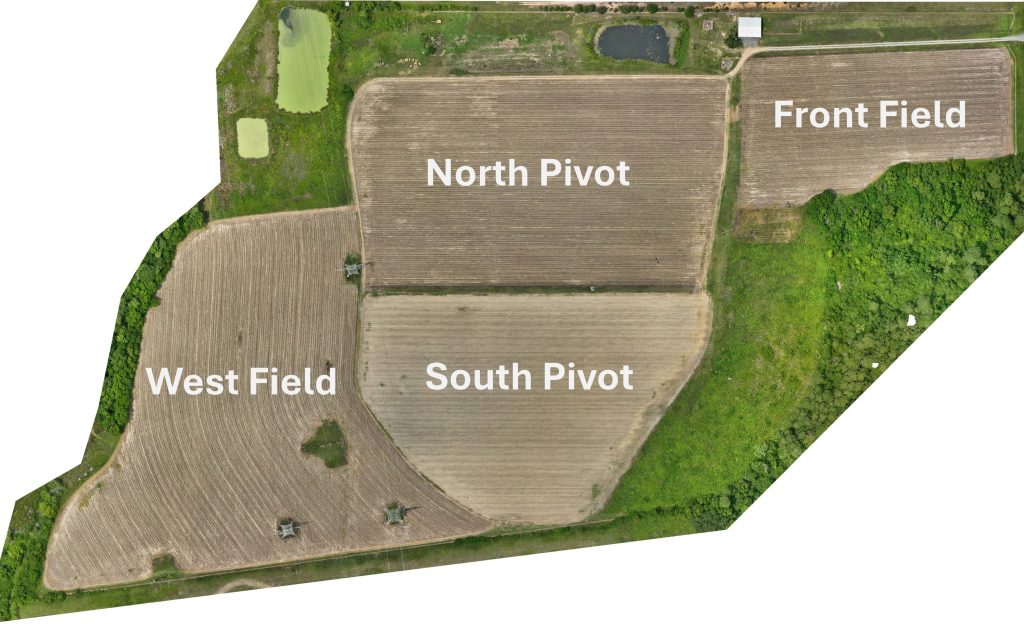
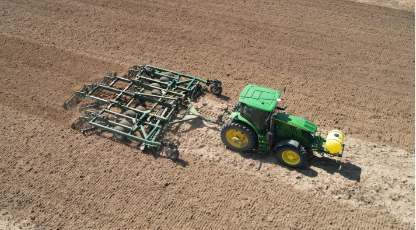
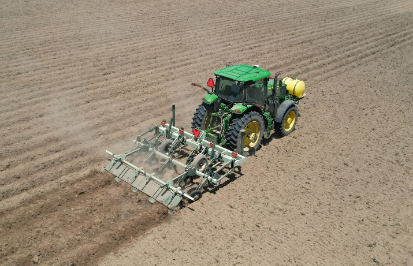
May was a busy month of field activities getting the 2025 row crops in the ground. The month started off dry so the initial cotton plant date was pushed back until rain chances increased. The forecast for the second week showed promise of rain at the end of the week, so the planter was set up for planting cotton. On May 5th the planter’s insecticide hoppers were calibrated for AgLogix insecticide to apply 5 lb/ac at a speed of 5.5 MPH. After calibration West Field was planted, then the following day, May 6th, Front Field and North Pivot were planted. Figure 1 shows the planter planting cotton in West Field on the 5th.

On May 7th the cotton fields were treated with the planned pre-emerge herbicide mix of Reflex (10 oz/ac) and Warrant (32 oz/ac). The burndown spray in April and the Pre-Emerge spray after planting resulted in very clean overall weed control.
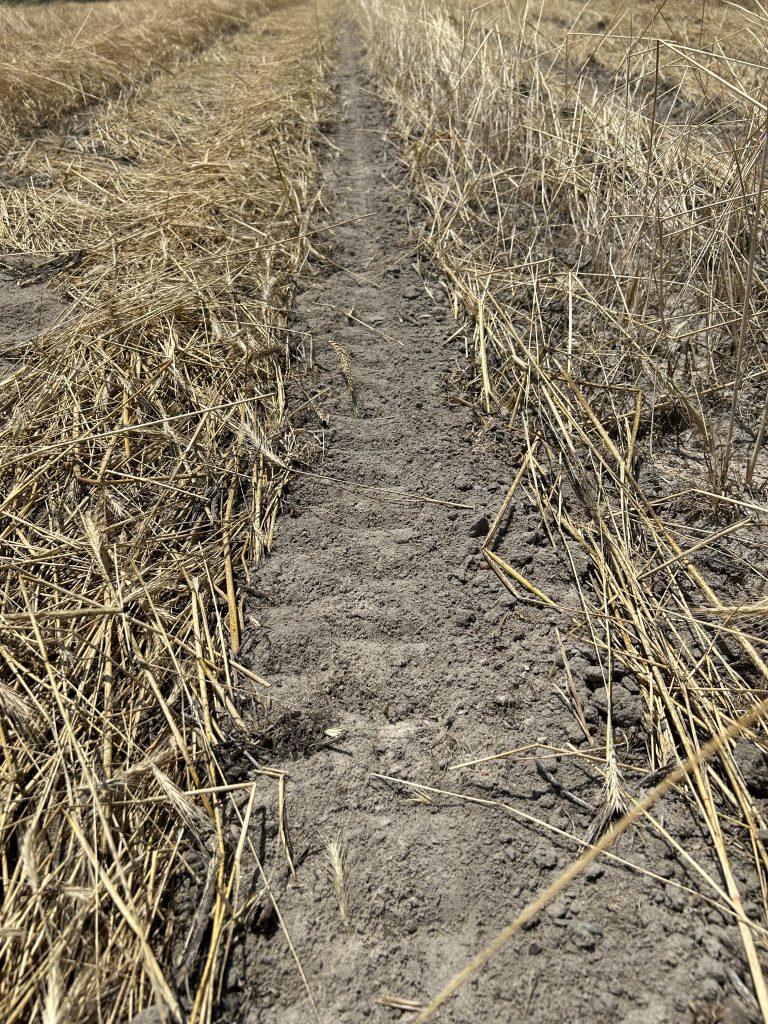
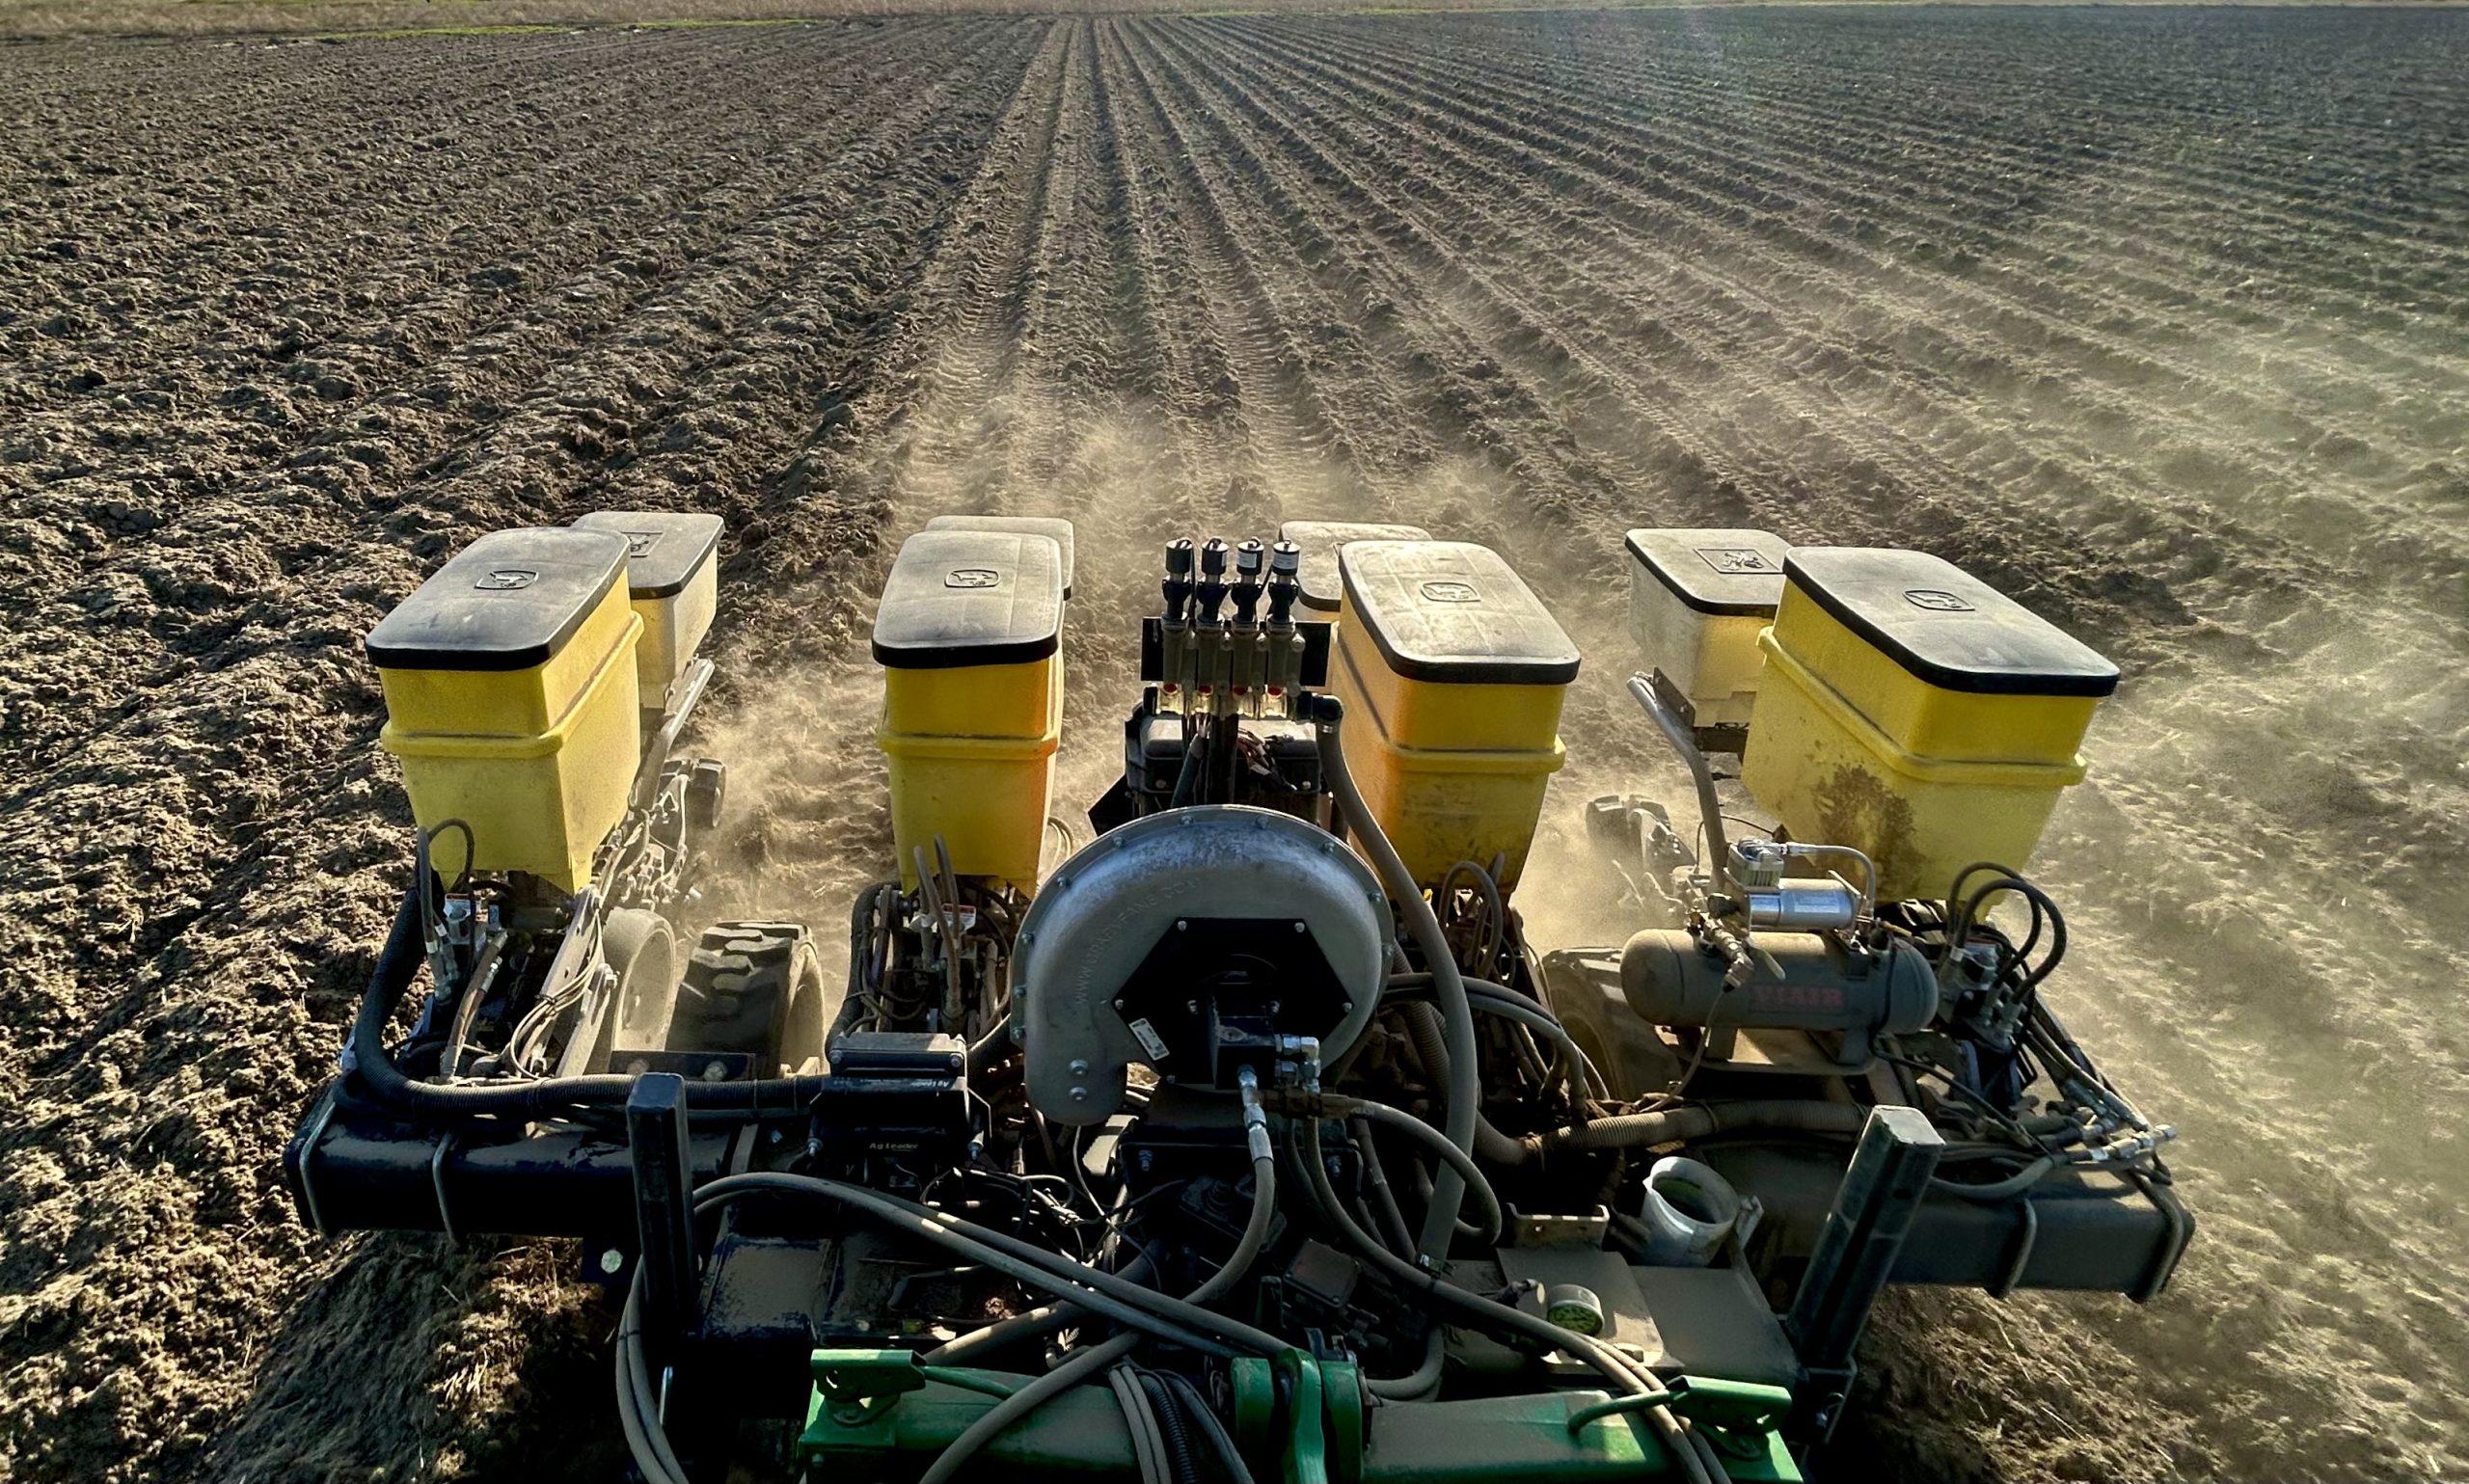
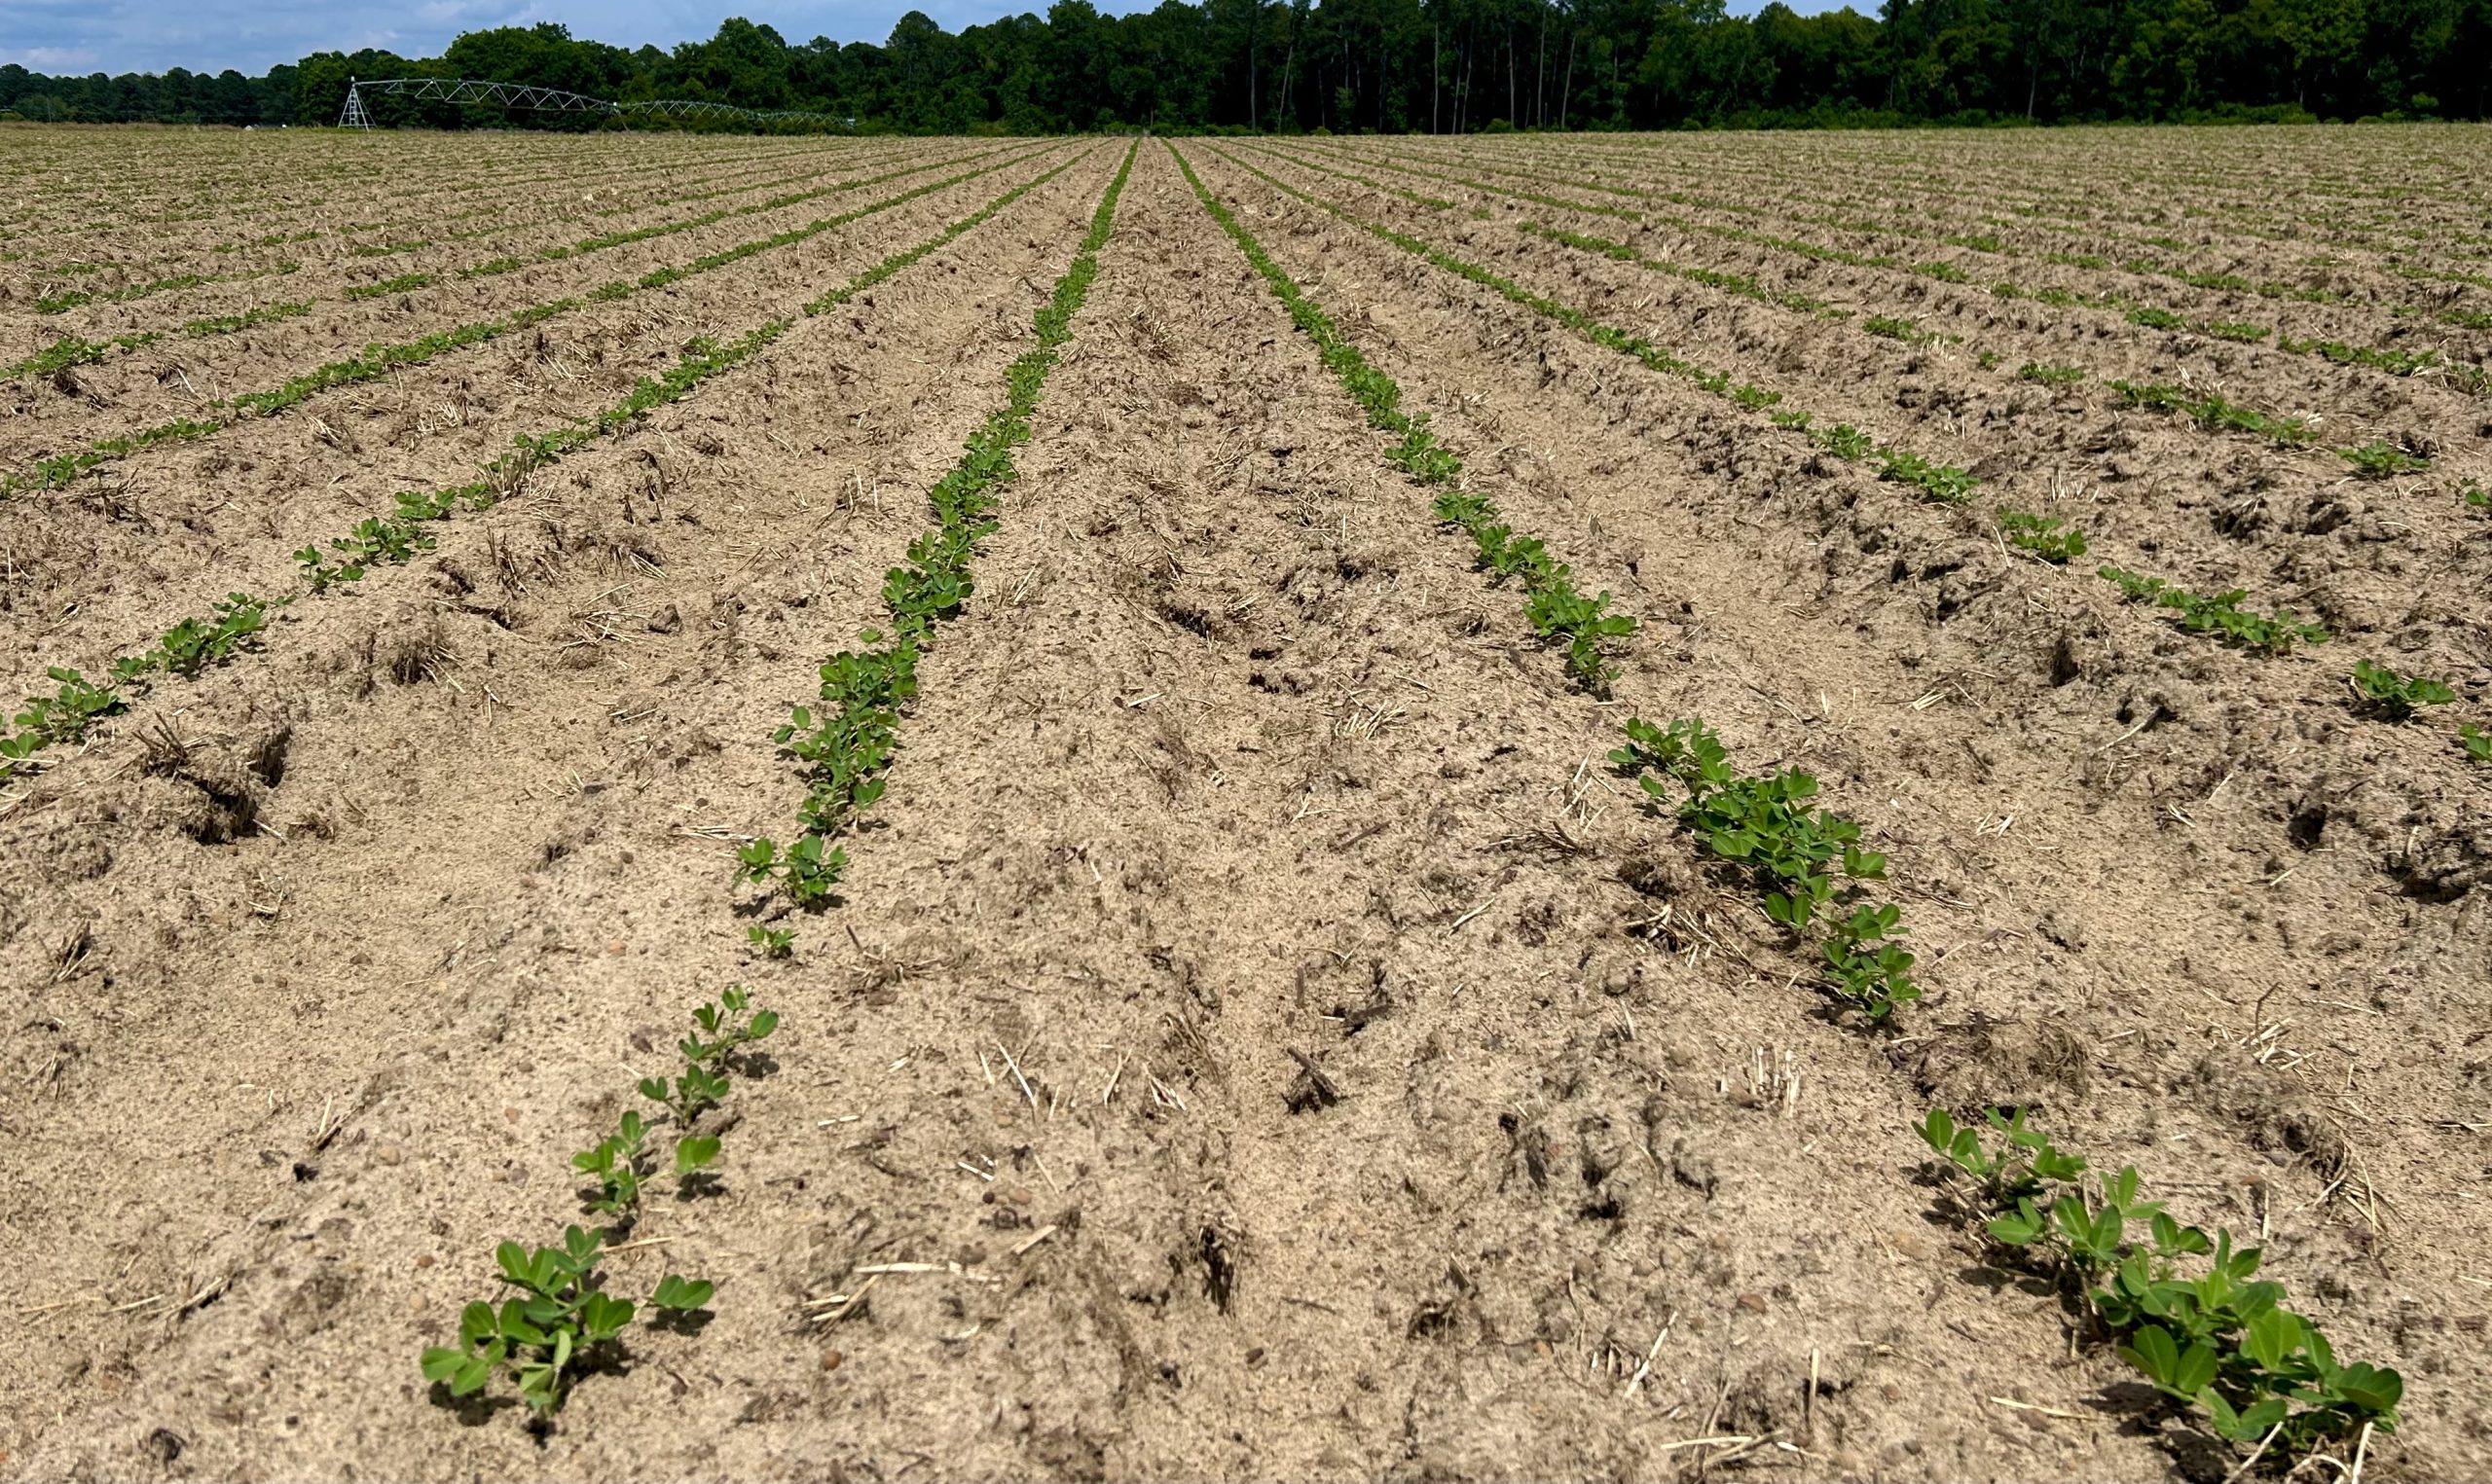
After planting it was discovered that the implement profile used for the strip-till operation was incorrect. The profile used had an off-center shift of 1.8 inches, so the planter did not align in the center of the strips. Figure 2 shows the track of the closing system running just on the side of the dirt slot in the residue. The cotton in all three fields had spotty emergence which could have been caused by this along with environmental conditions. After planting, the DATA Farm experienced periods of intermittent rainfall as well as high temperatures. The fields did not receive beneficial rain after planting until May 10th. The next 4 days the DATA Farm received a total of 2.15 inches of rain but after this rainfall the DATA Farm did not receive rain for the next 8 days. The inconsistent planting depth due to residue coupled with moisture extremes during germination could have caused the emergence issues. Dr. Wes Porter’s team conducted a stand count of all three fields, and a low drone flight was made to use image analysis to count emergence. This data will be in next month’s update after analysis.
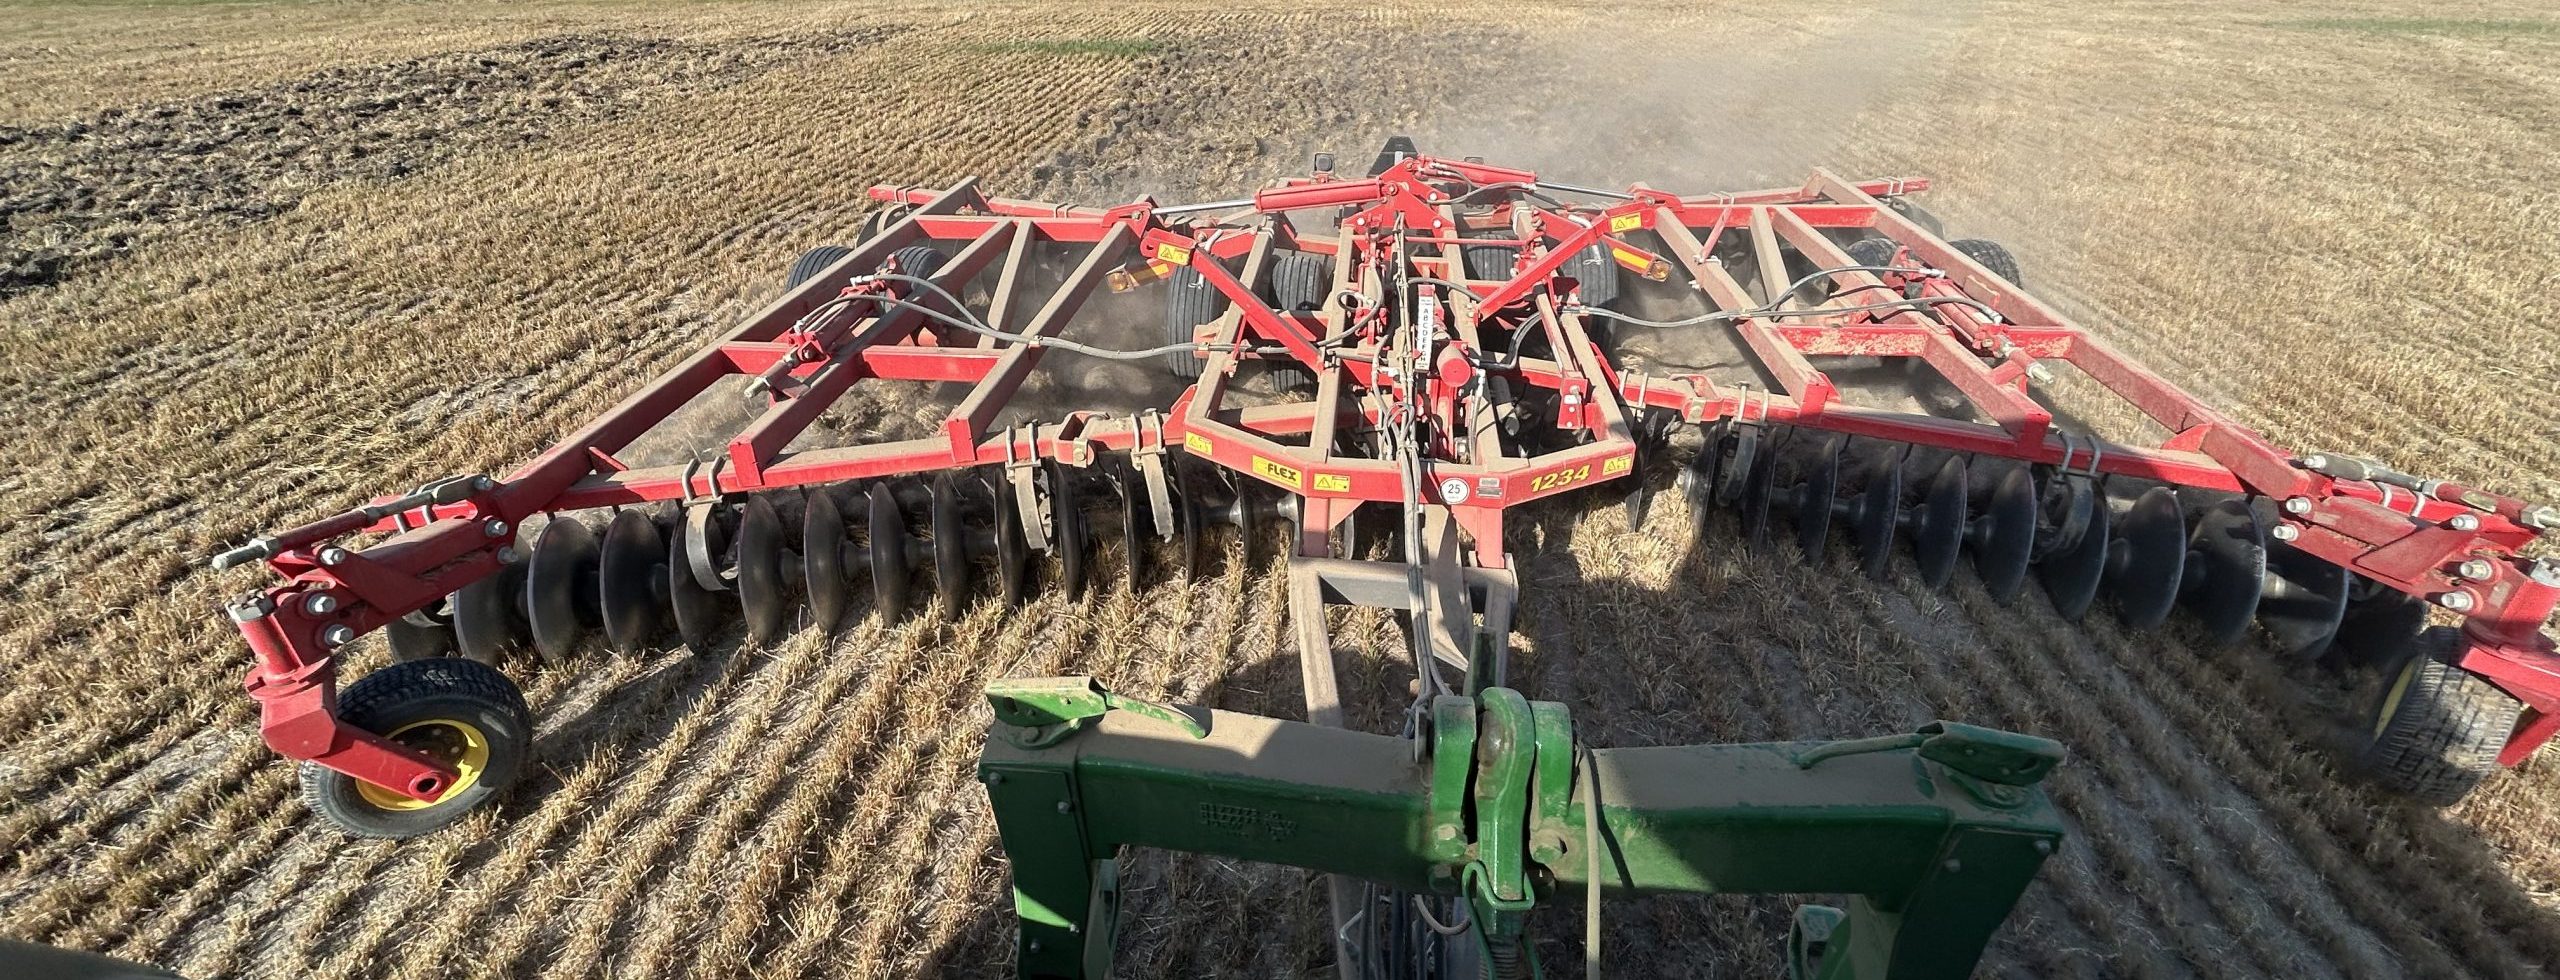
The dry conditions also delayed peanut planting slightly because moisture was needed to prepare the field. South Pivot required several tillage passes to transition from the annual ryegrass to clean beds for the planter. On May 2nd a Sunflower 1234 disk (Figure 3) was run in South Pivot to start cutting up the ryegrass roots and residue. A second pass with the disk was performed on May 5th to further break up the residue.
A third pass across the field was made on May 15th with a KMC Resi-Till vertical tillage implement (Figure 4) after receiving 2.2 inches of rain since disking. This pass was made to break up any remaining dirt or root clods before creating the beds with a KMC 6800 Ripper-Bedder (Figure 5). The KMC 6800 has a sub-soiler shank for each row that runs in front of the bedder to break up any compaction and create optimal conditions for the peanut taproot to grow. This implement was run on May 15th following the Resi-Till.
On May 16th after planting the peanuts, the pre-emerge herbicide mixture of Prowl (29 oz/ac), Brake (12 oz/ac), and Valor (3 oz/ac) was applied. After spraying, the pivot was started to apply 0.75” of irrigation to activate the herbicides. According to the UGA Pest Management Handbook, the herbicide Brake needs 0.5” of water to activate it but Prowl needs a minimum of 0.75” of water if you are spraying after planting.
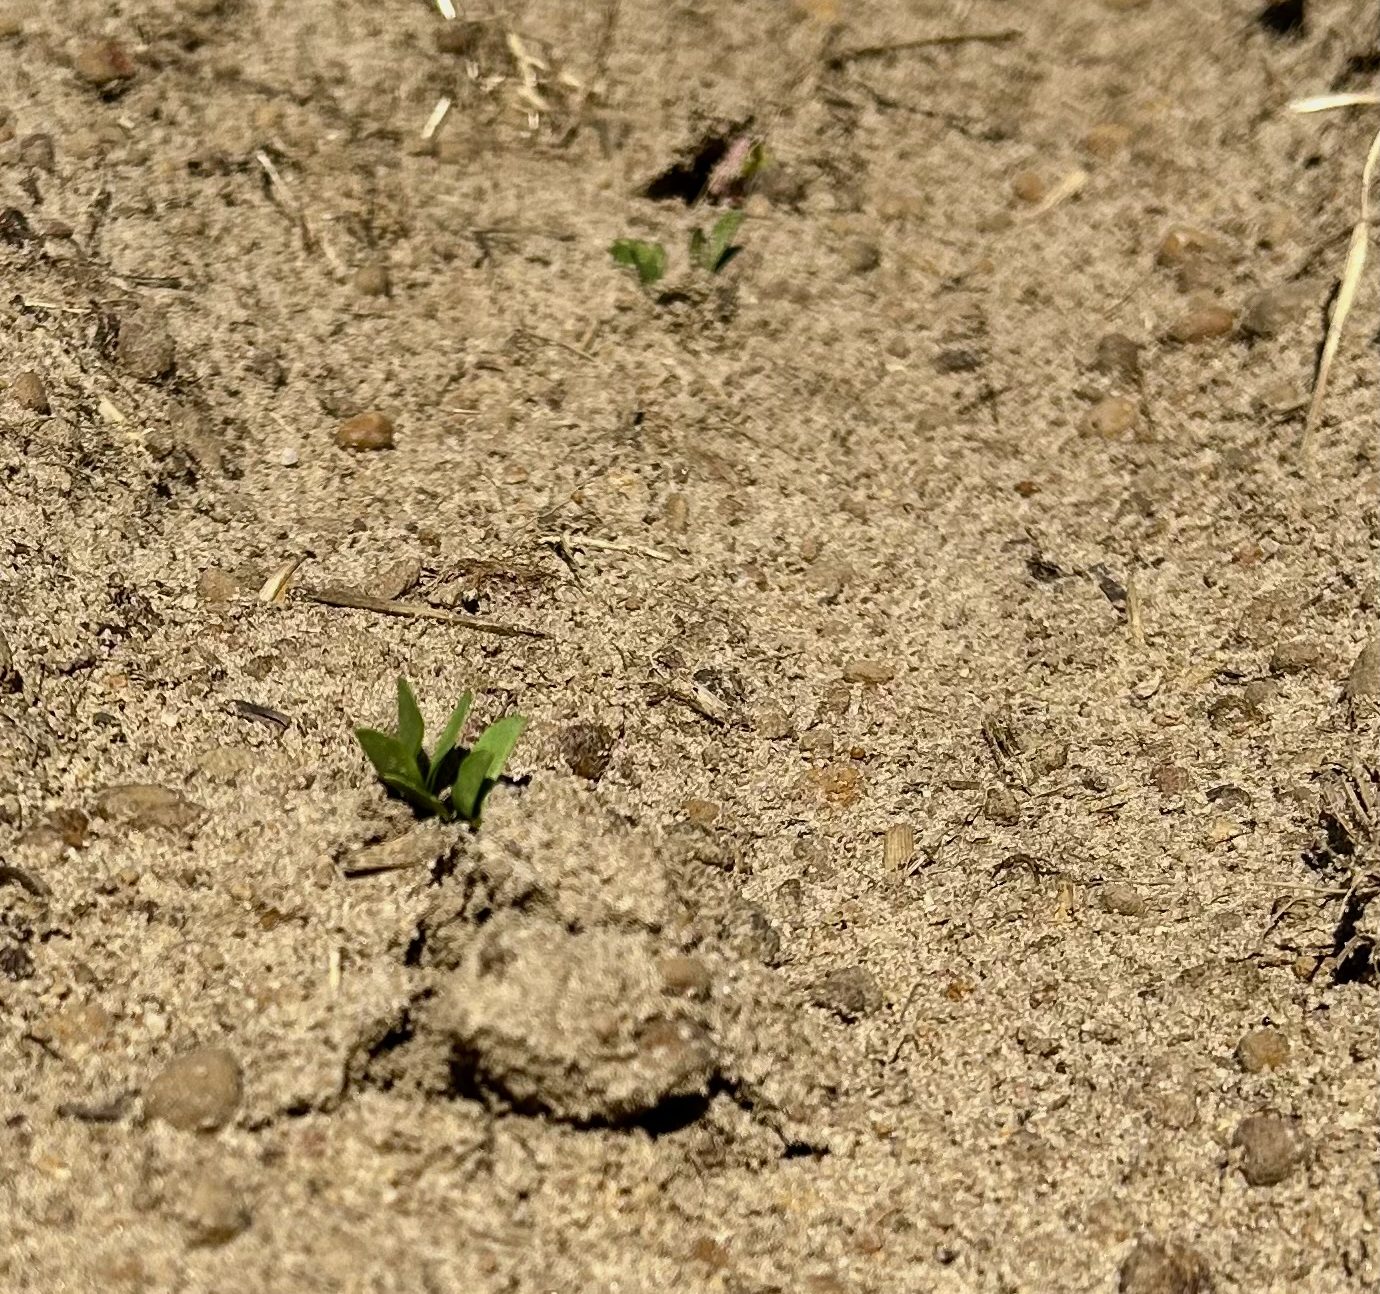
On May 22nd peanut plants were observed cracking the surface (Figure 7), and on May 27th they had fully emerged (Figure 8).
The monthly temperature trends and rainfall recorded by the on-site weather station for May are shown in Figure 9. Total rainfall was 3.4 inches.
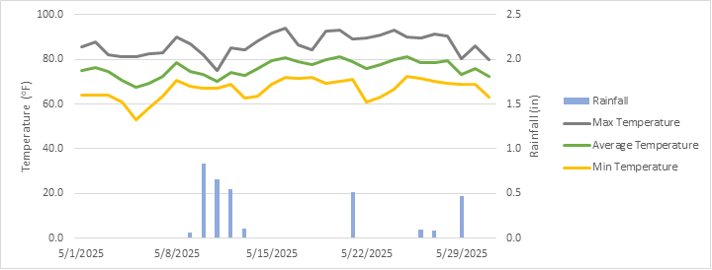
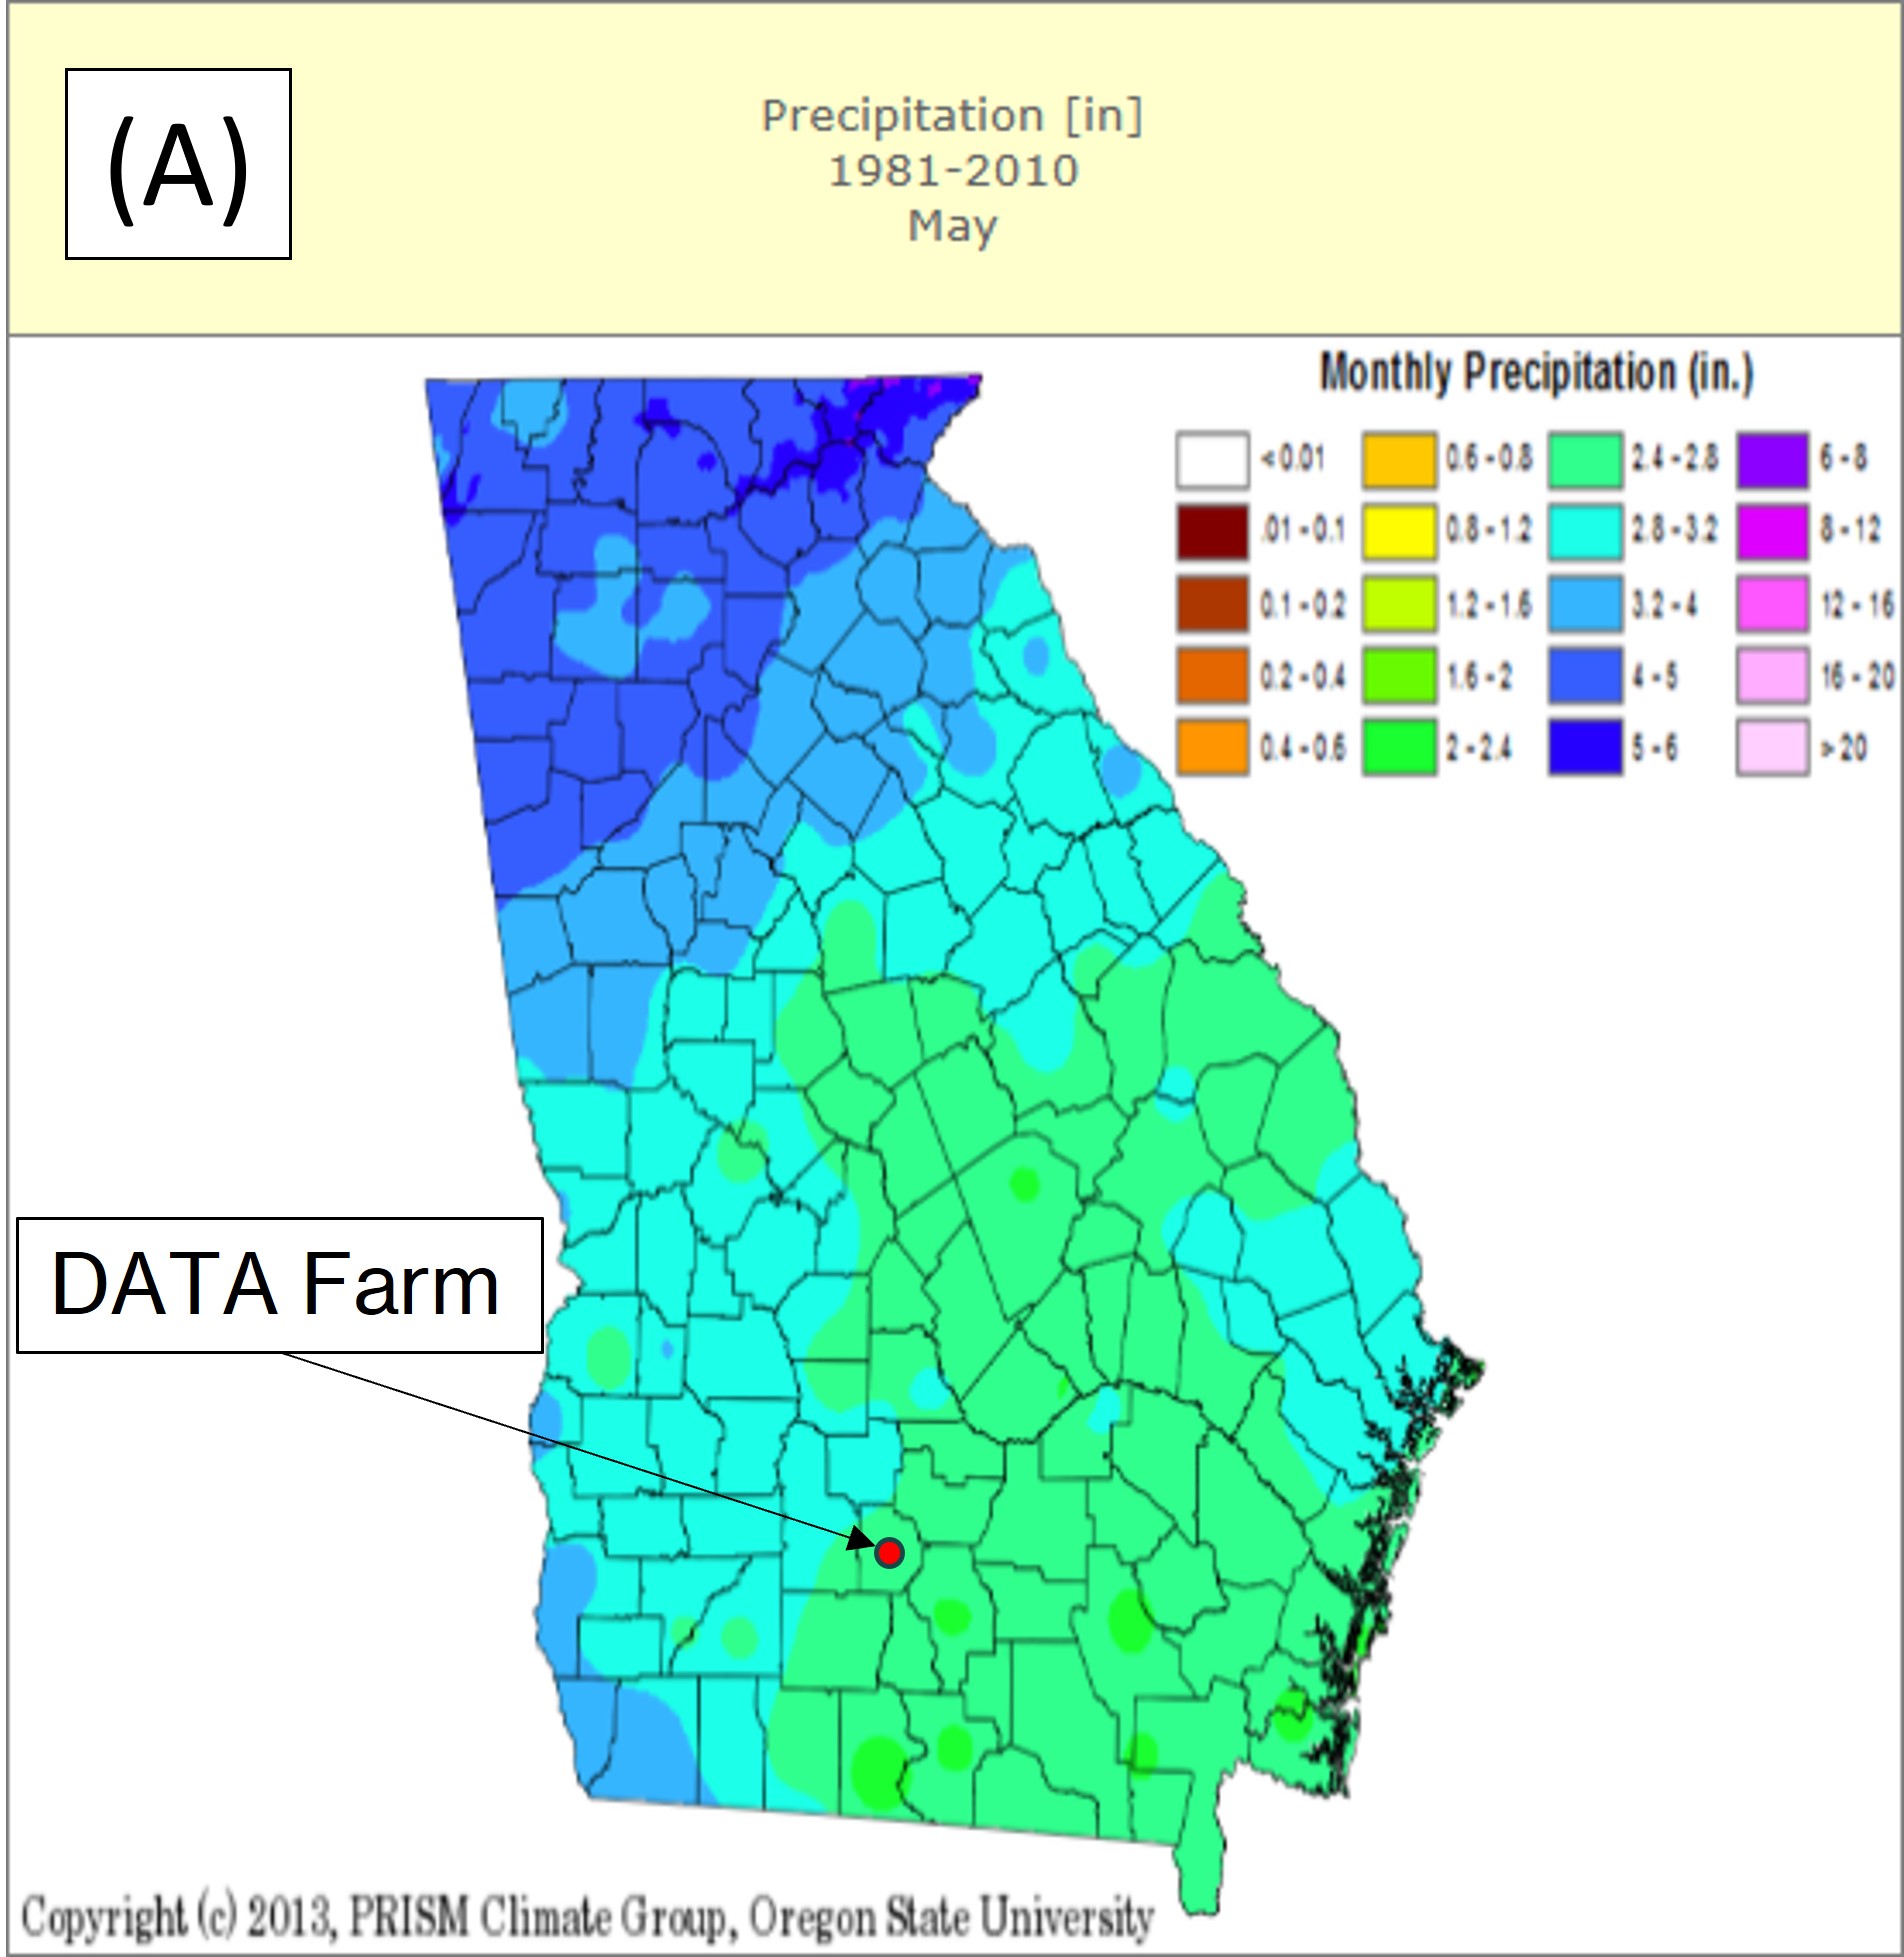
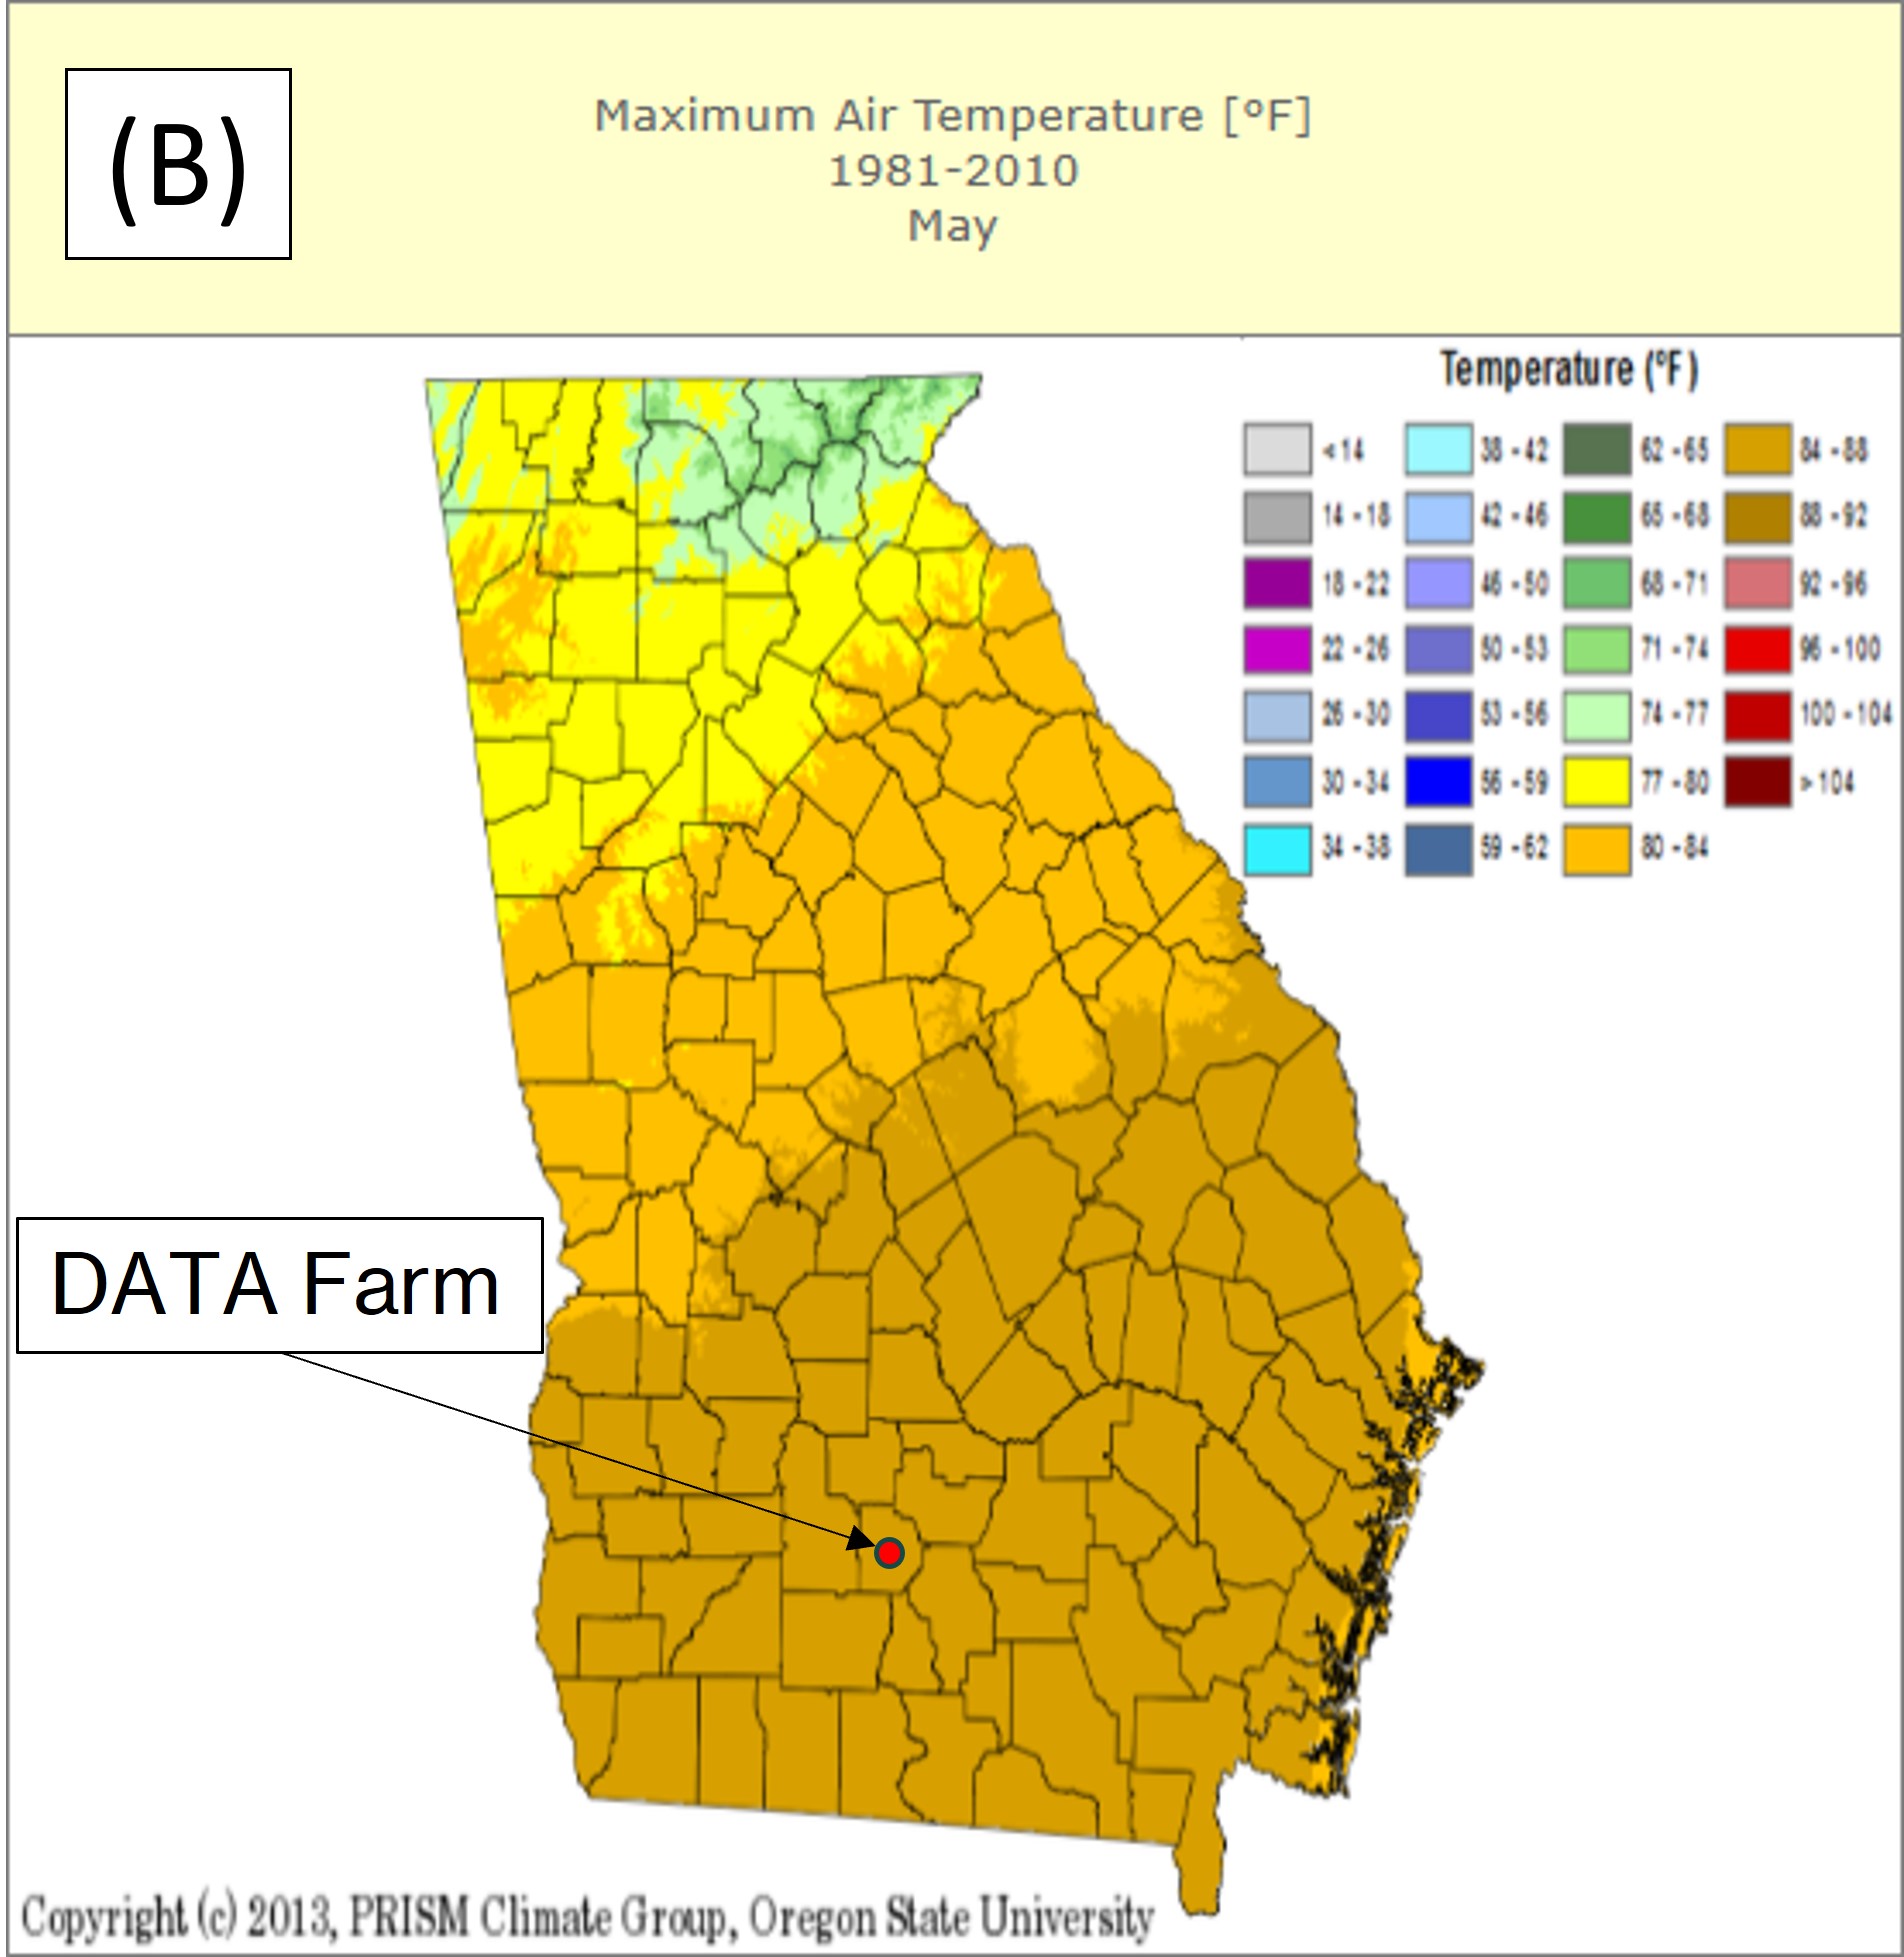
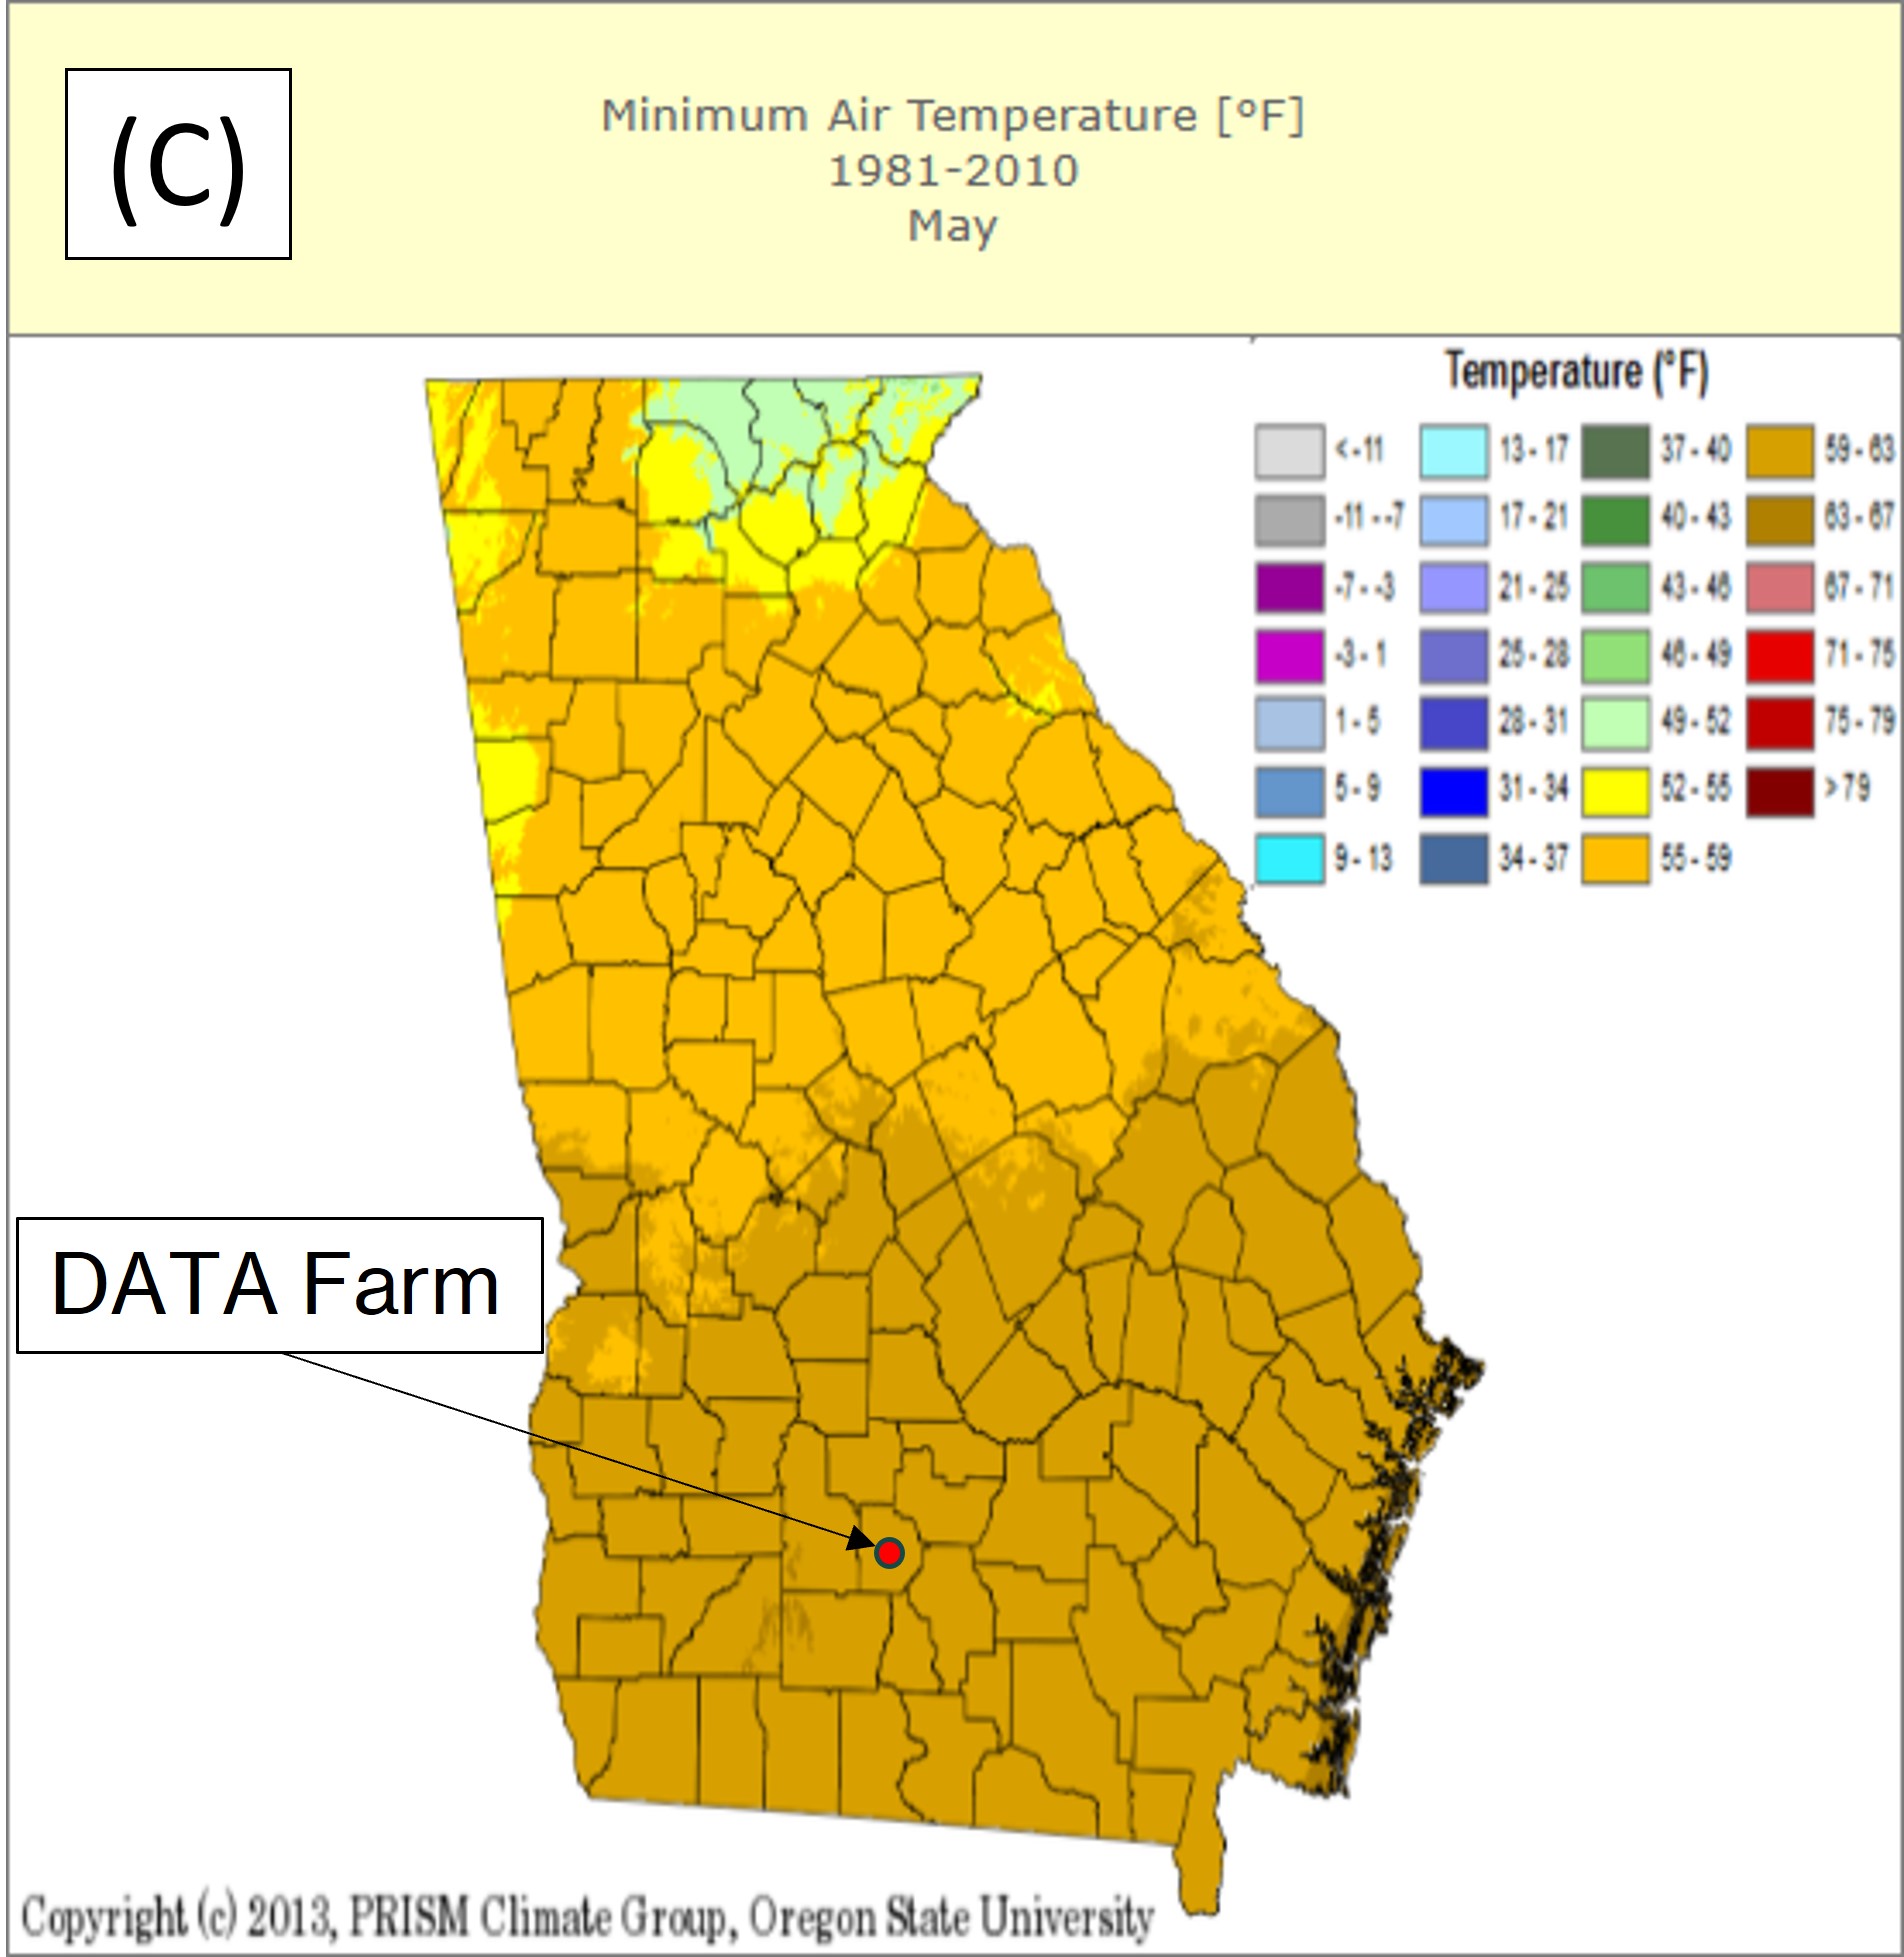
For comparison, Georgia climate maps based on data from 1981 to 2010 (UGA’s Weather Network) are shown in Figure 10 for the month of May for historical reference. The rainfall recorded at the DATA Farm during May is just above the average (2.4 to 2.8 inches) for this period. This has resulted in abnormally dry conditions that continue to persist in our area. The target plant date of May 1st for cotton was altered due to the dry conditions and weather forecast showing no rain for the first week of May. At the start of the second week of May the forecast showed chances of rain at the end of the week. The decision was made based on this forecast to start planting cotton on the afternoon of May 5th. The chart in Figure X shows that the DATA Farm started receiving rain on 5/9/25 which continued over the next 4 days. The average of recorded maximum temperatures for the month was 87°F which is in the average historical range of 84°F – 88°F (Figure 6B), and the average of recorded minimum temperatures was 66°F which is slightly higher than the average historical range of 59°F – 63°F (Figure 6C).
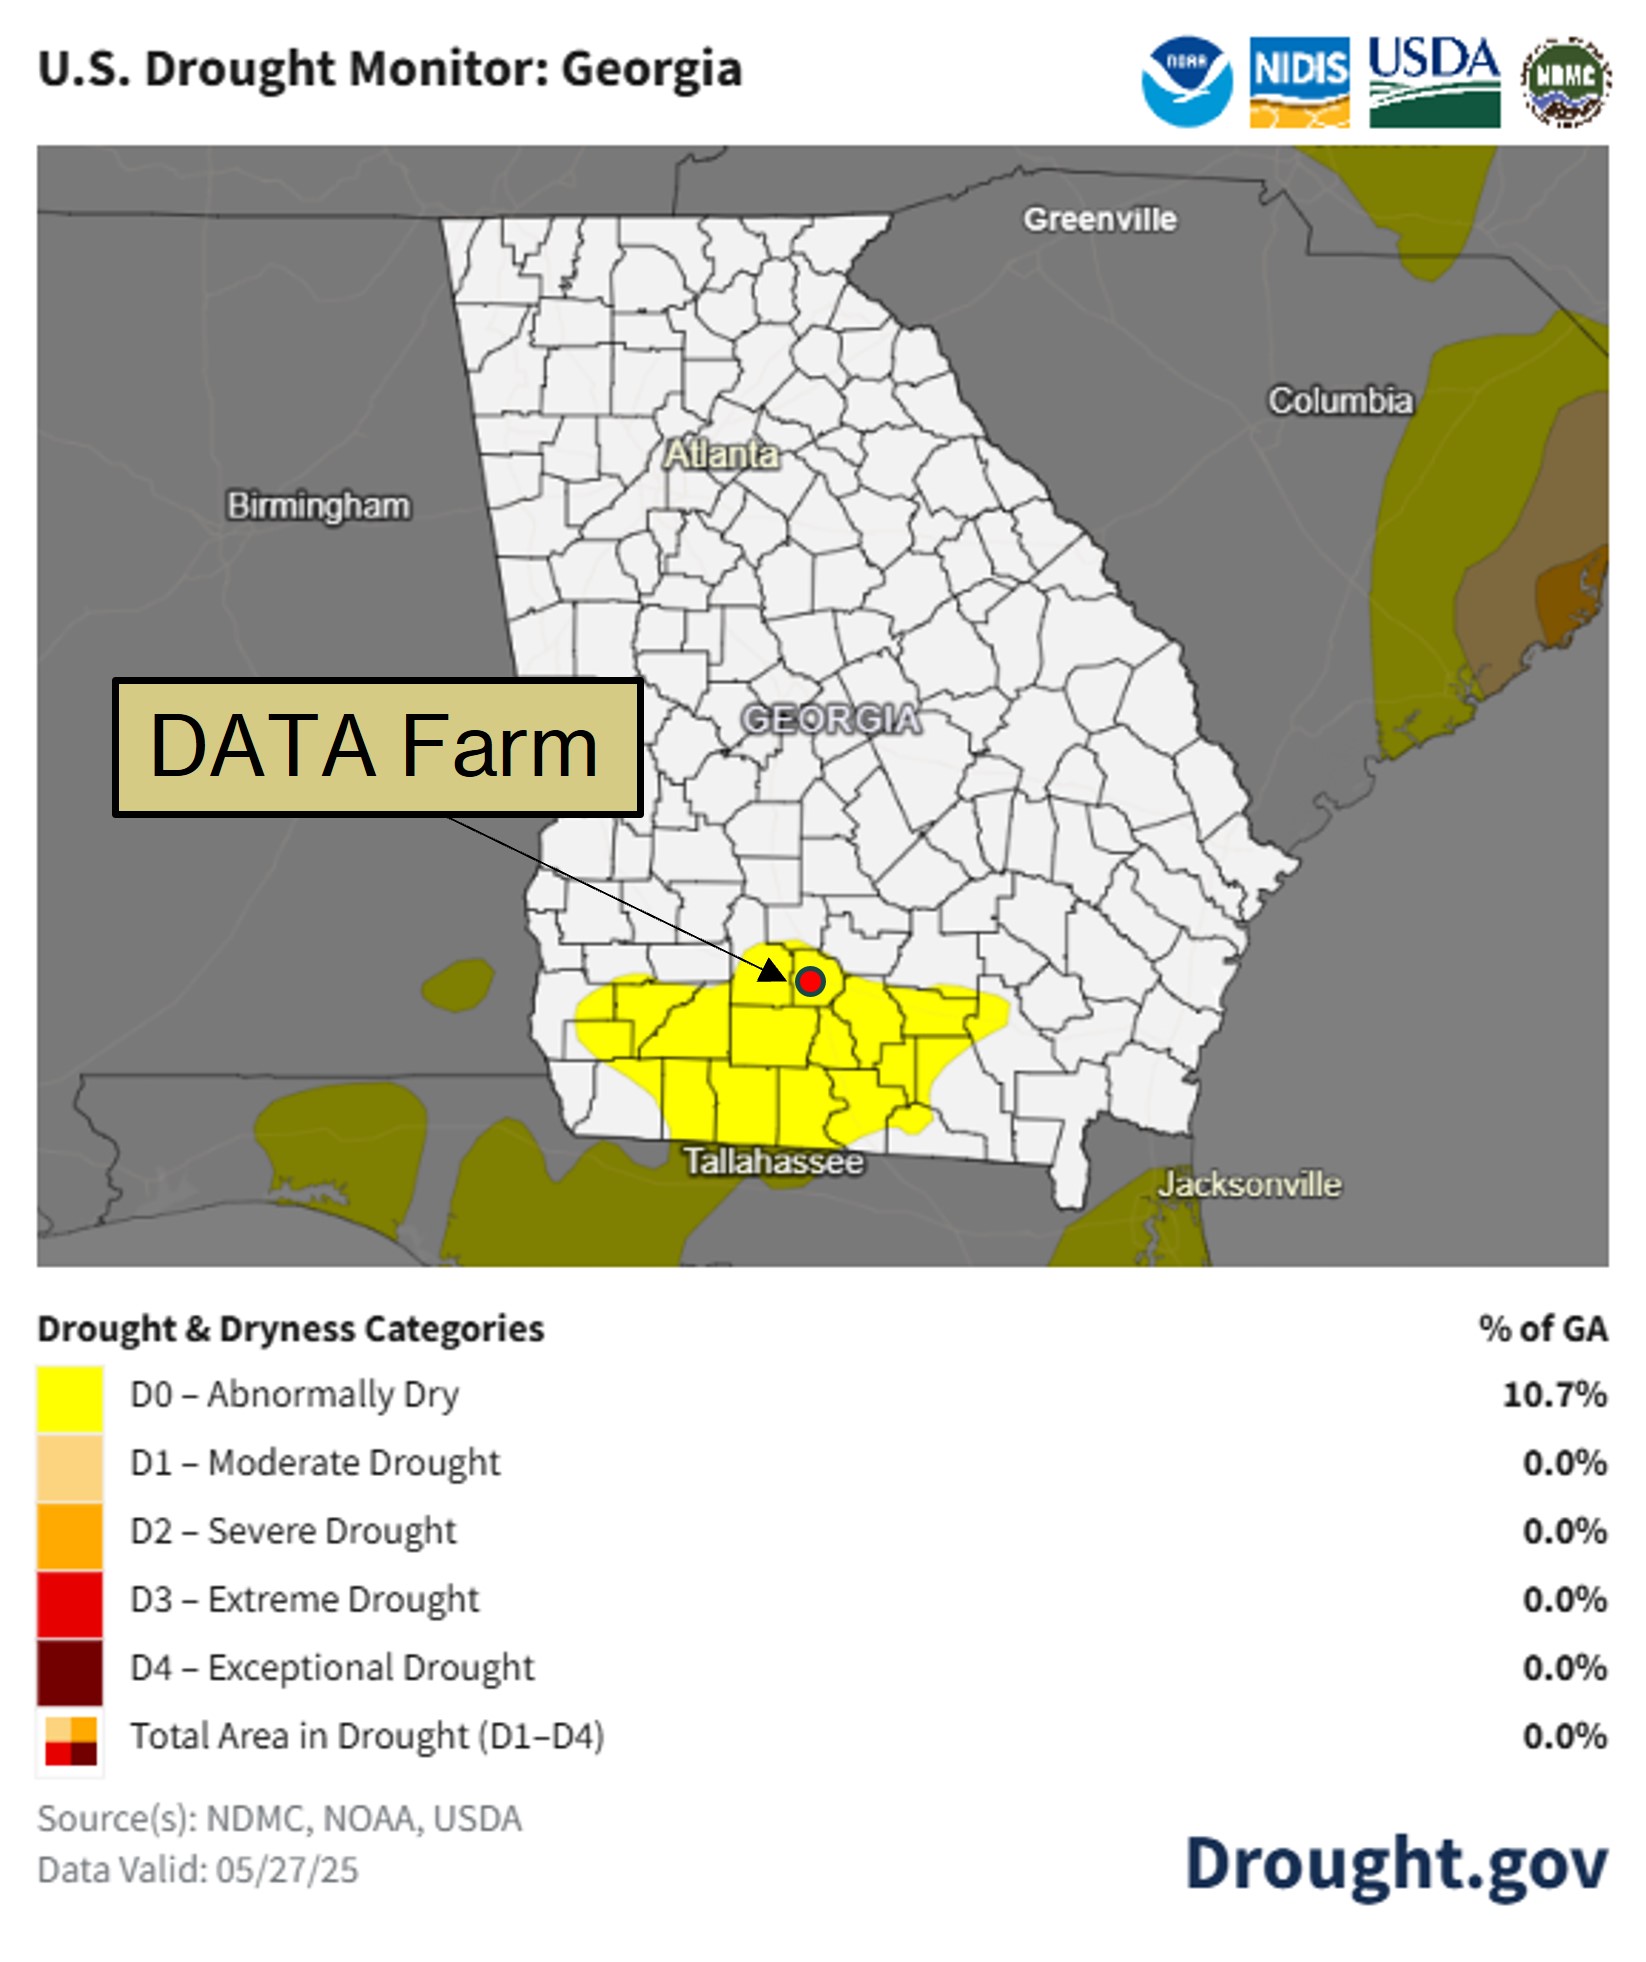
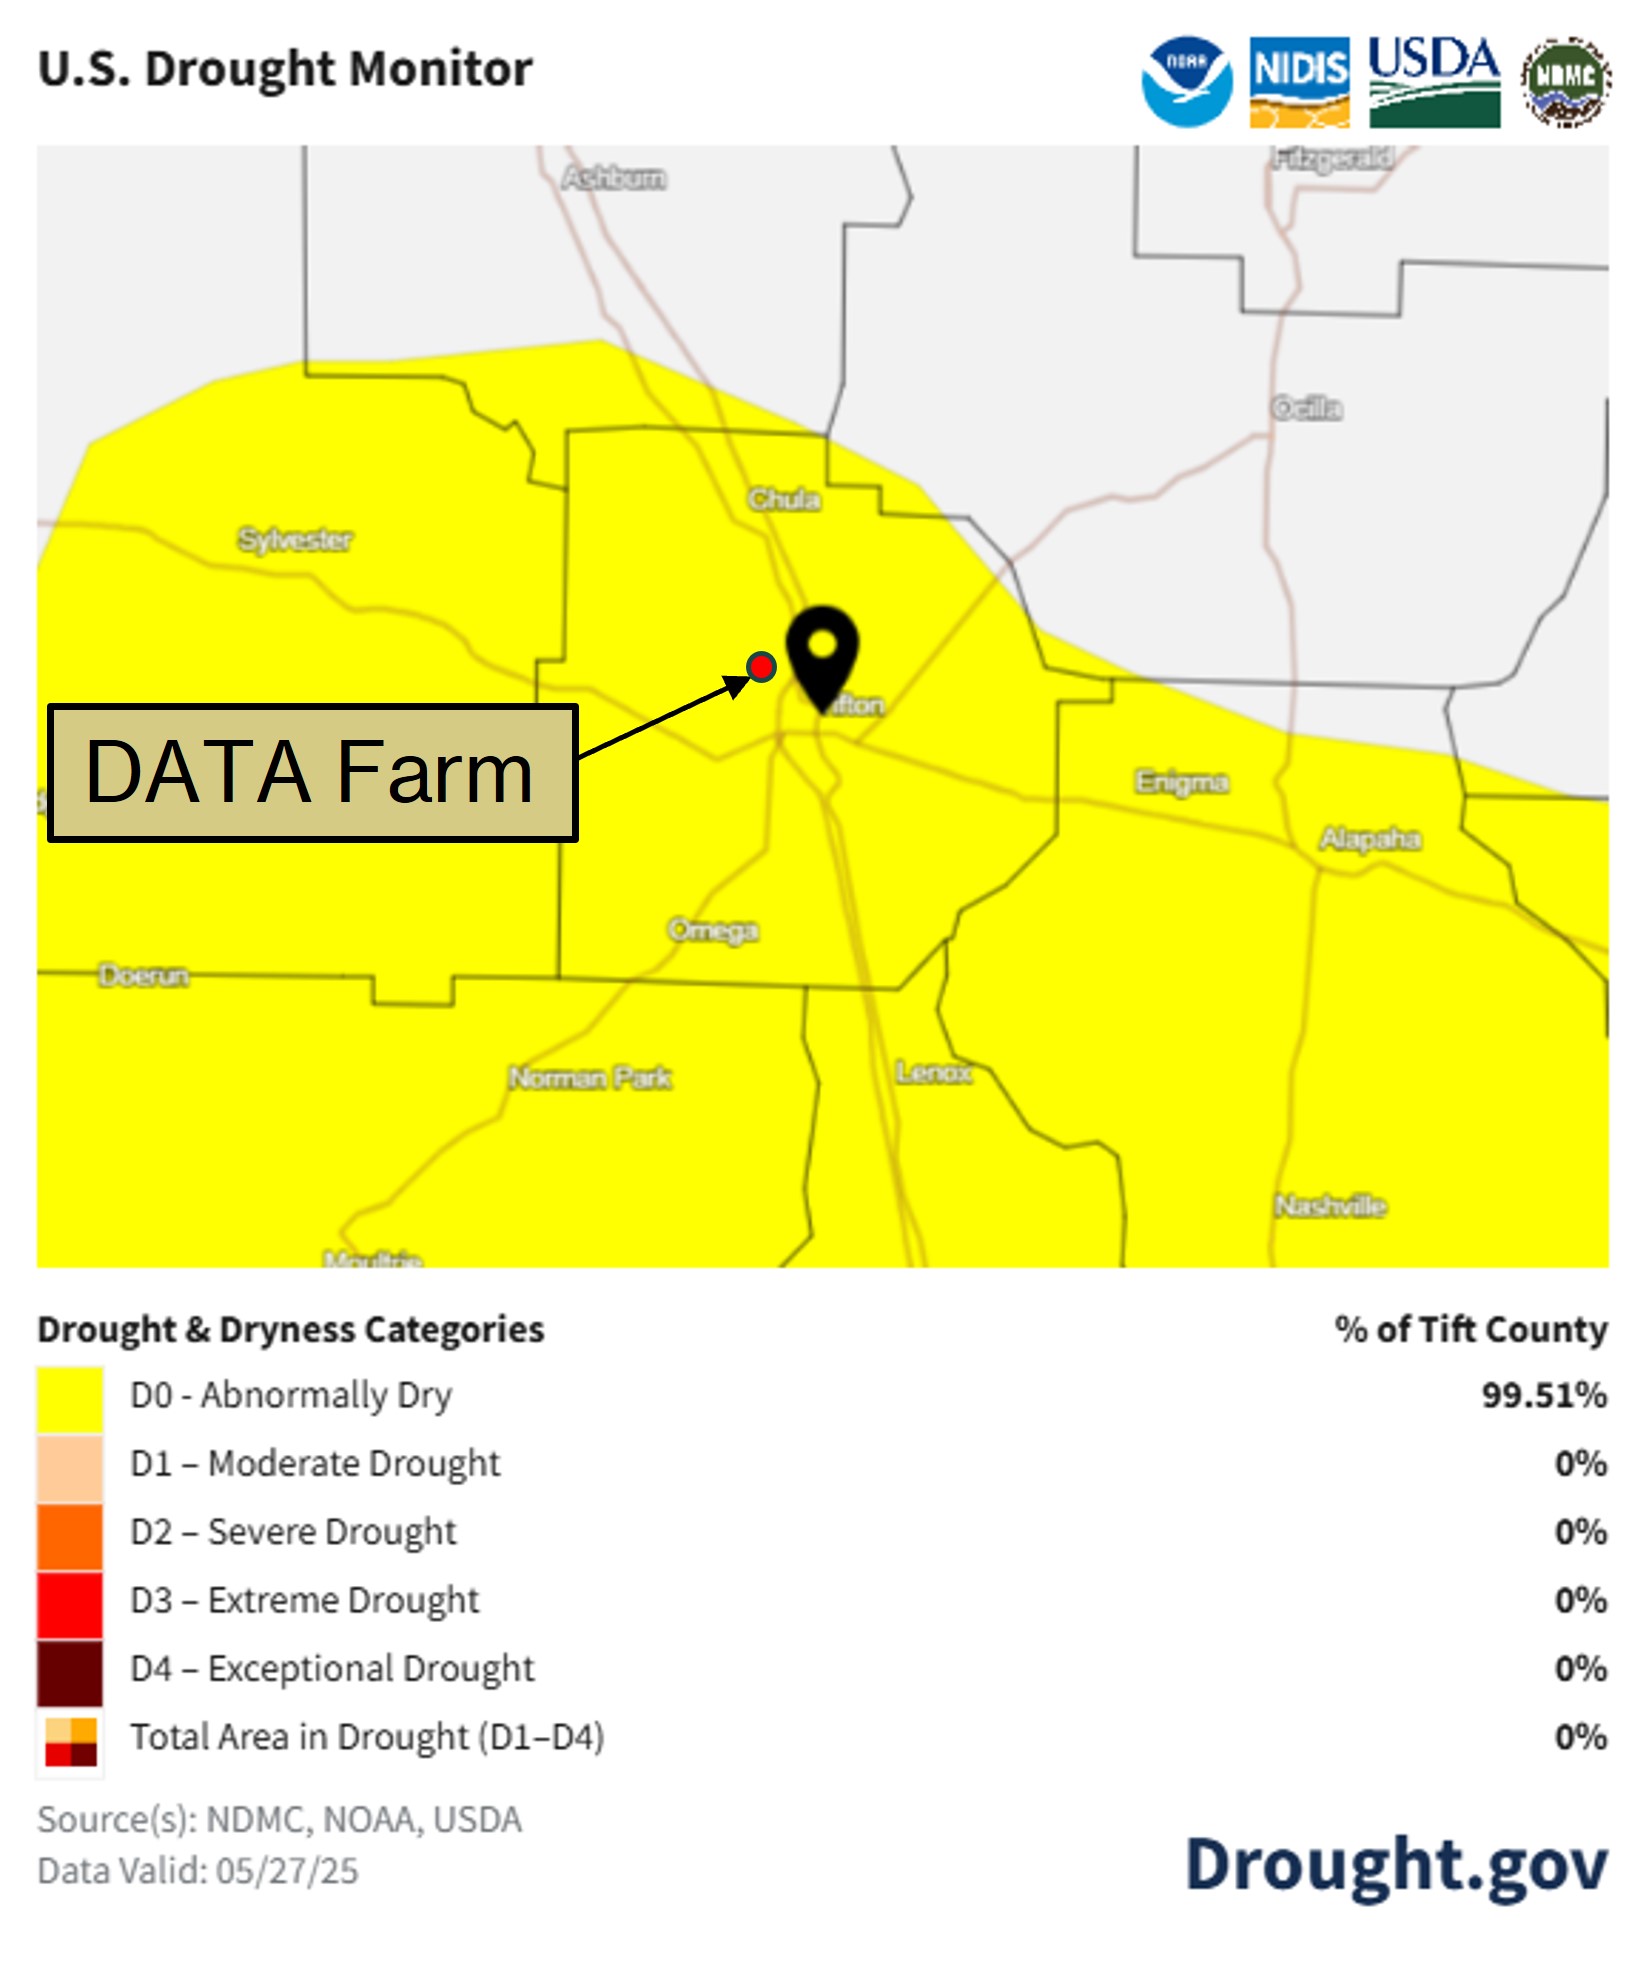
Figure 11 shows the drought monitor map as of June 4th, from the National Integrated Drought Information System for Georgia. Abnormally dry conditions are present in 10.7% of the state and moderate drought conditions decreased from 13.1% of the state on April 4th to 0%. Figure 3B shows drought conditions for Tift County where the 4D Farm is located. The county is now mostly in the abnormally dry (99.51%) range and no areas in the county are in the moderate drought range. There is a small area in the northeast corner of the county outside of any drought condition category.
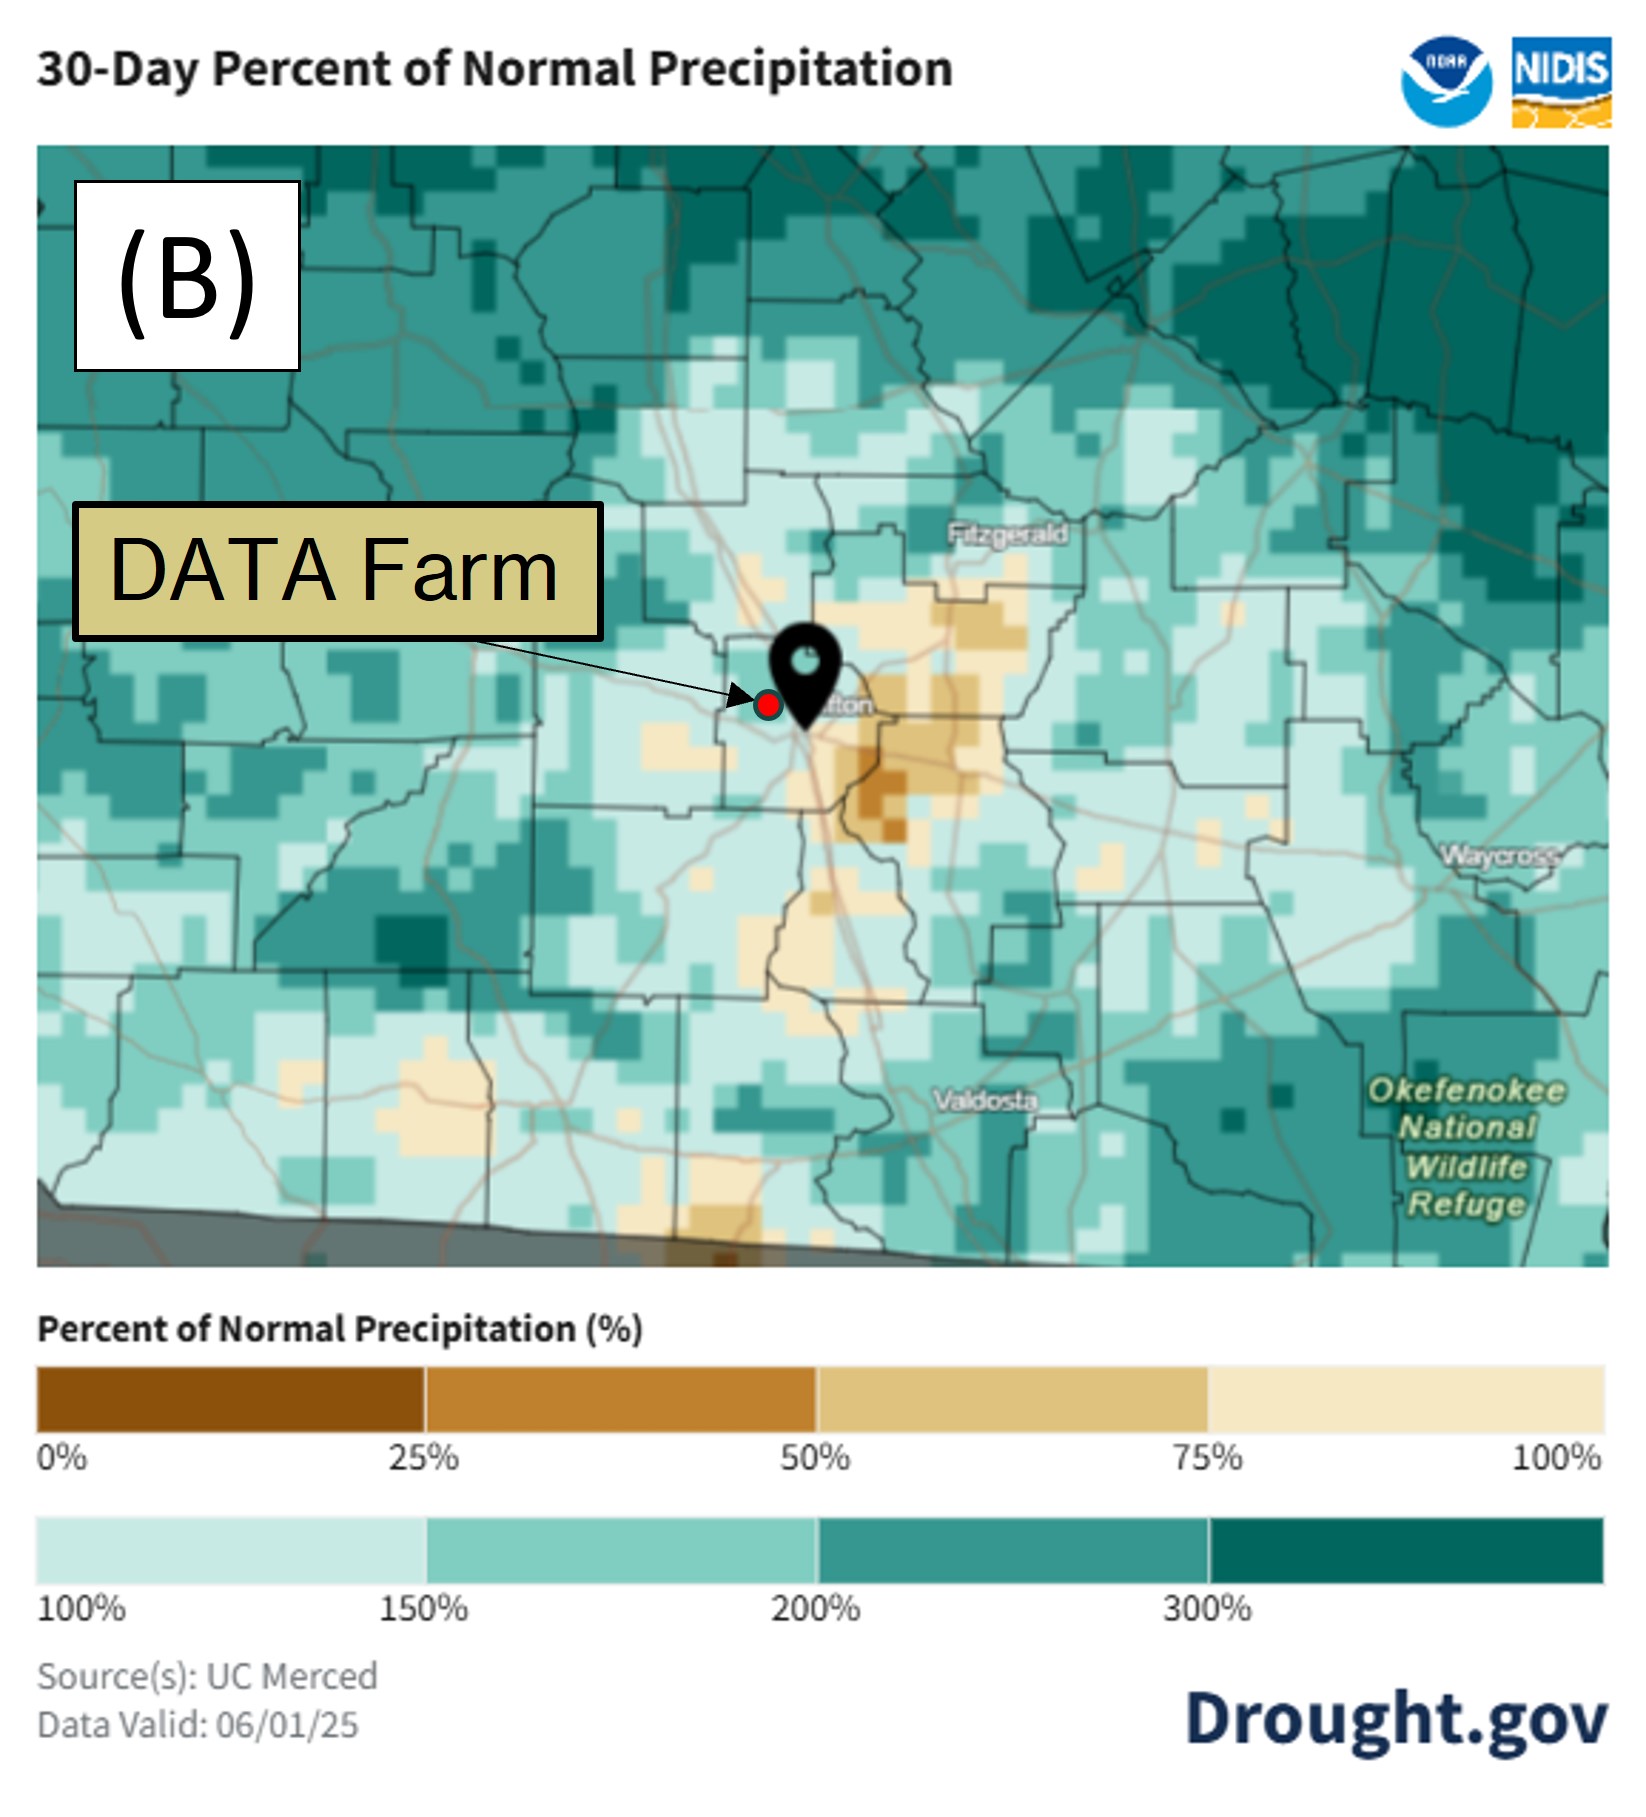
Figure 12 maps show precipitation for the past 30 days for the state of Georgia and the Tift County area as a percentage of the historical average (1991–2020) for the same time period. Green/blue shades indicate above-normal precipitation, while brown shades indicate below-normal precipitation. These maps show the variation in rainfall received across the state and that the area around the DATA Farm normal precipitation and slightly less than normal.
Operations:
Subscribe to get the latest posts sent to your email.