
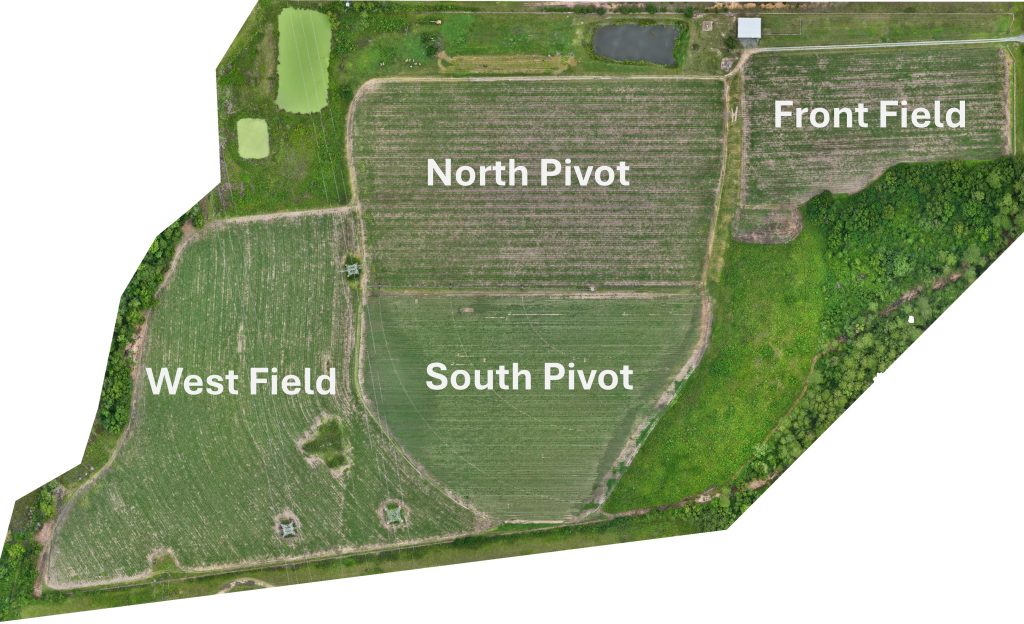
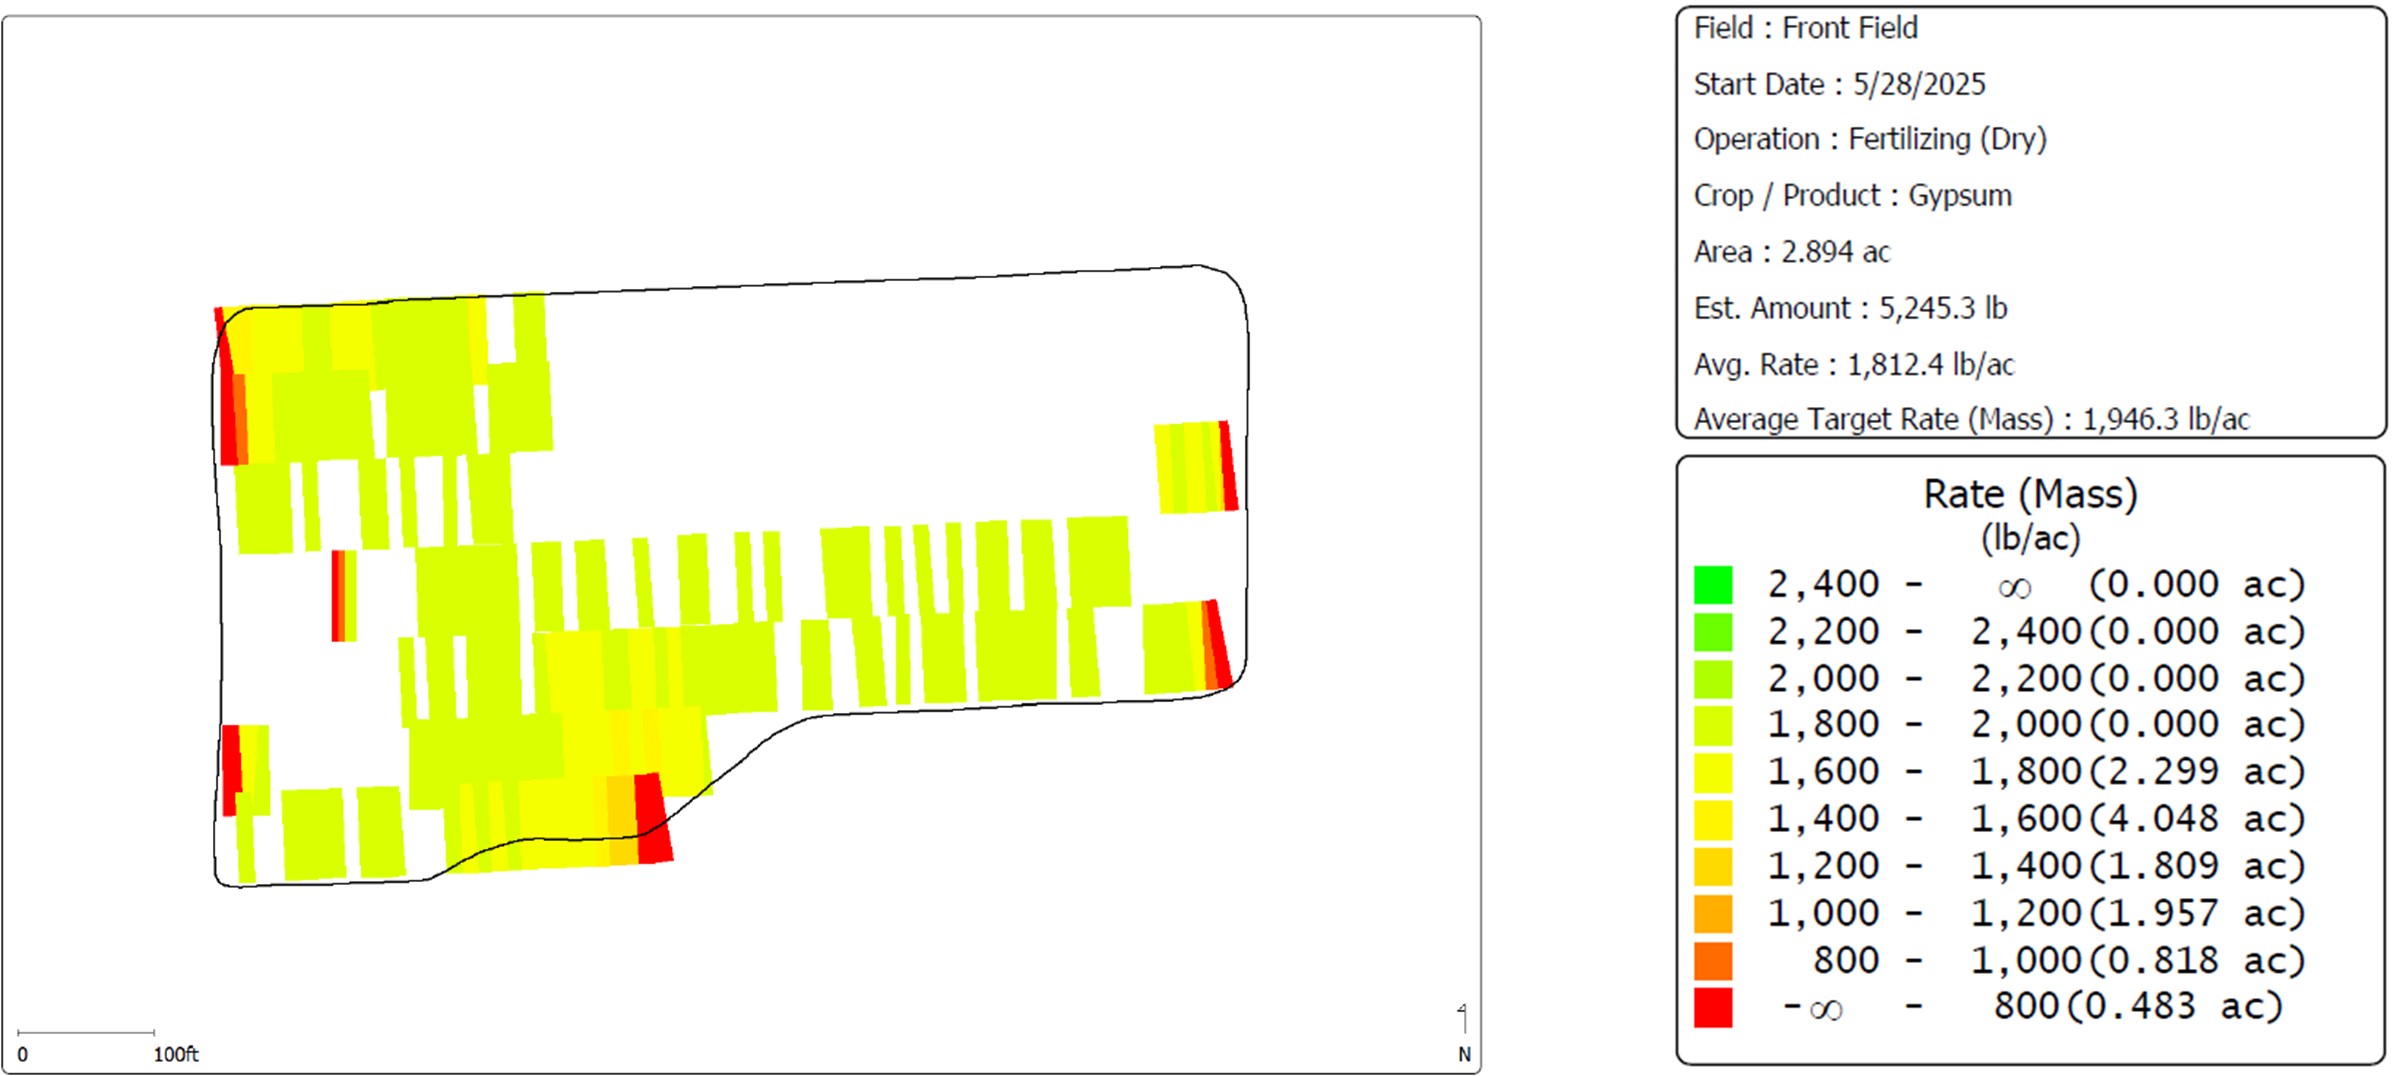
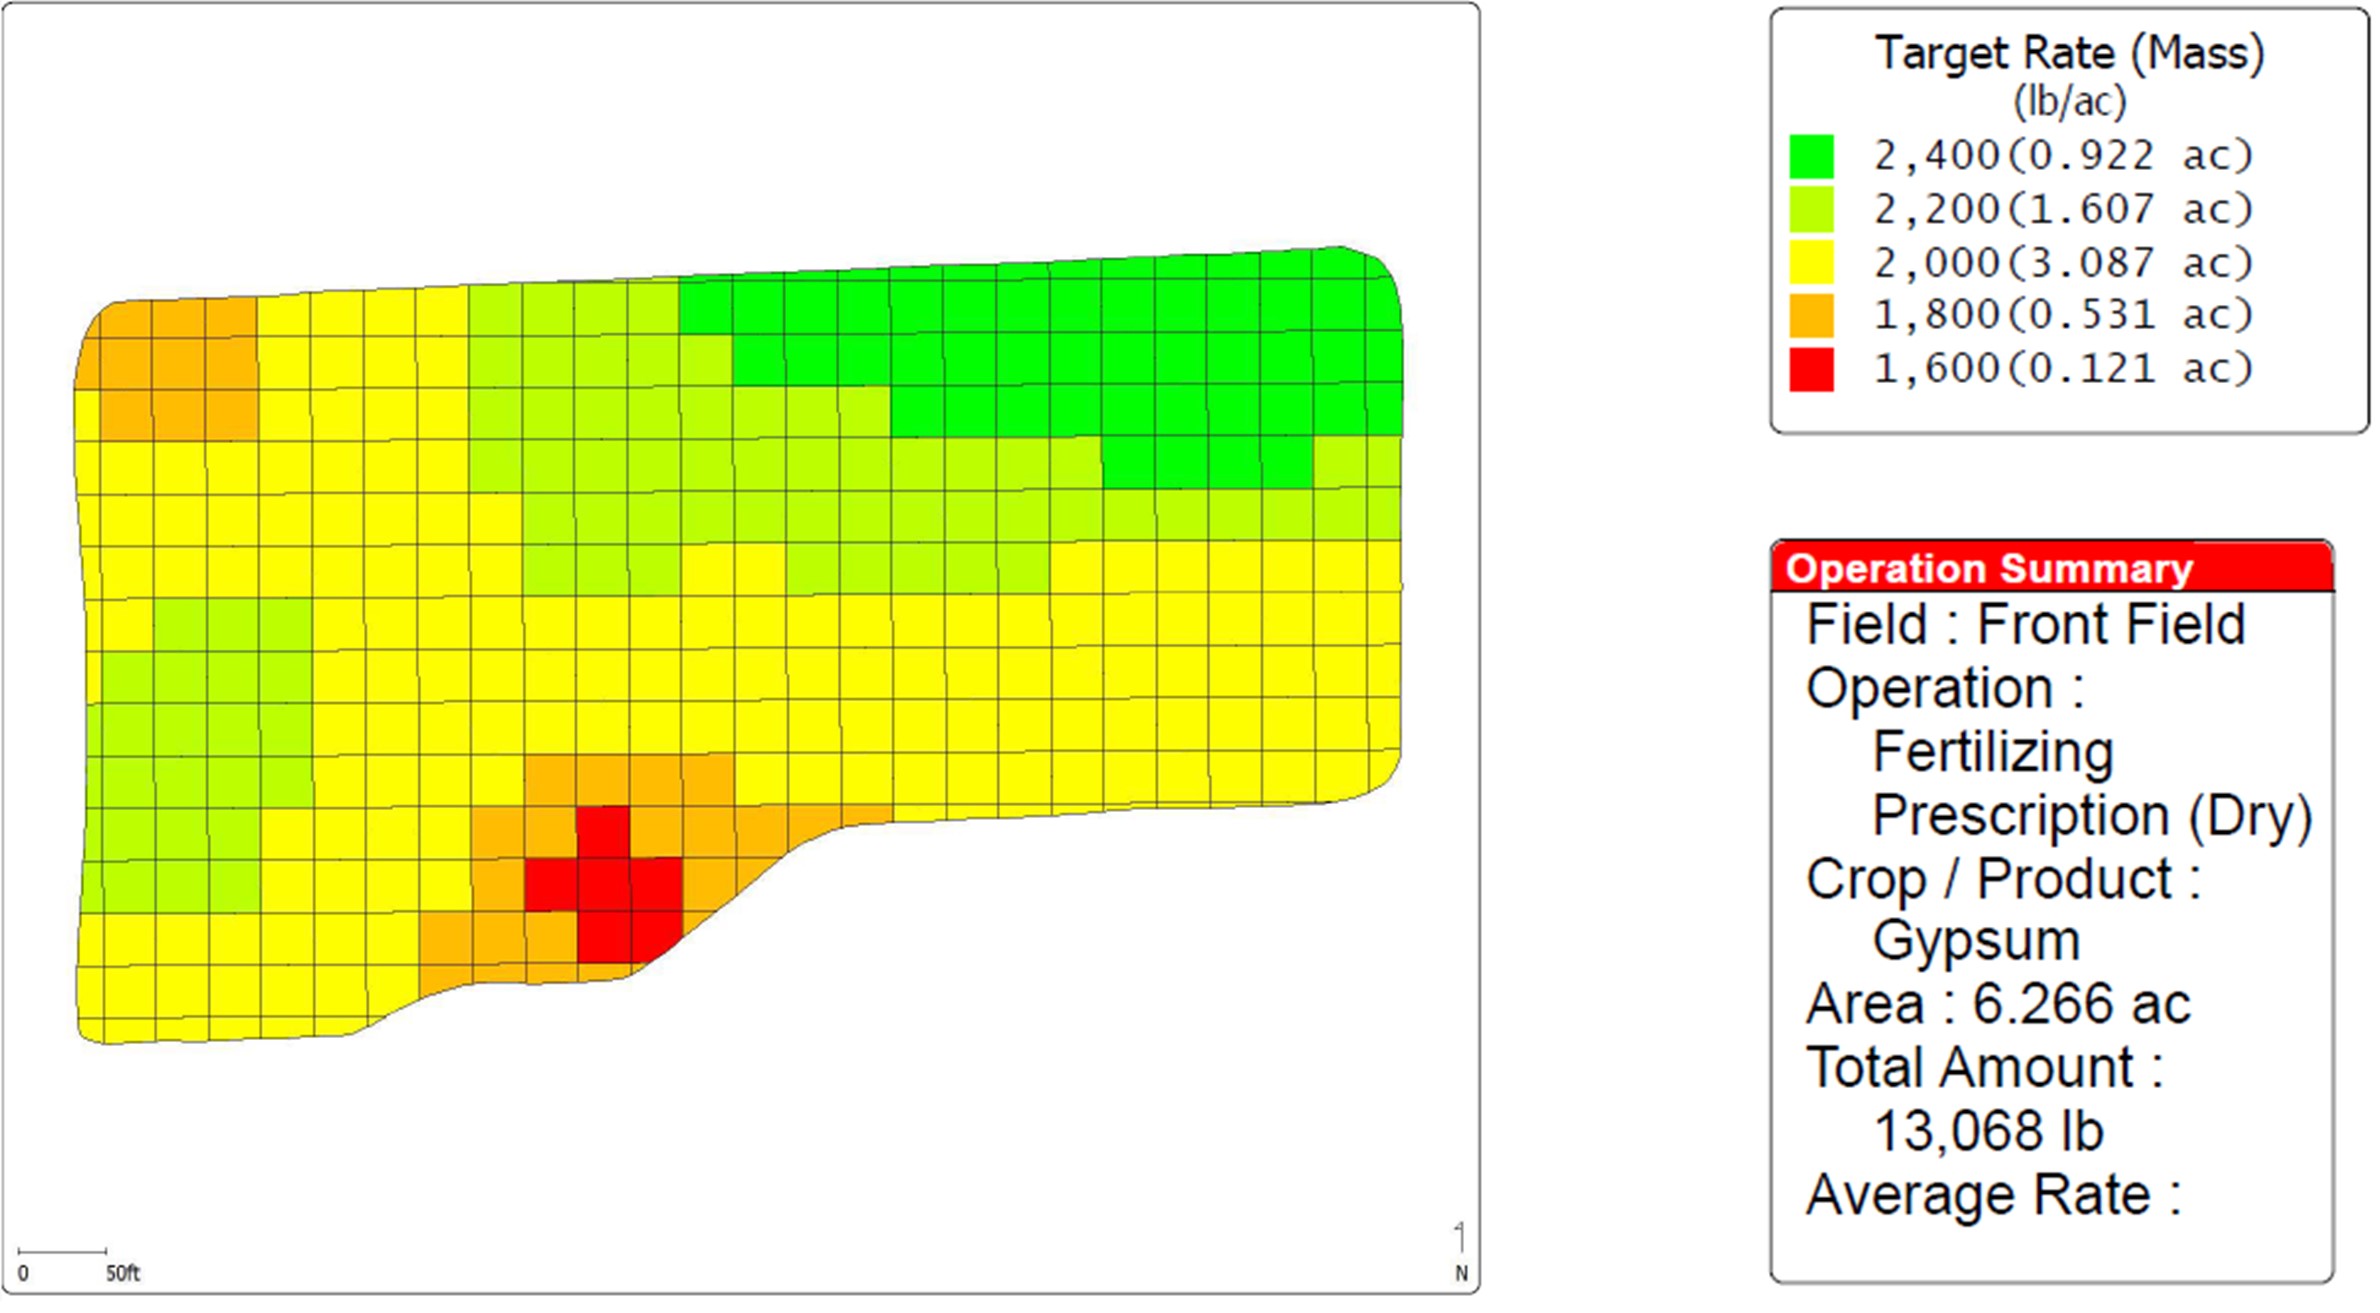
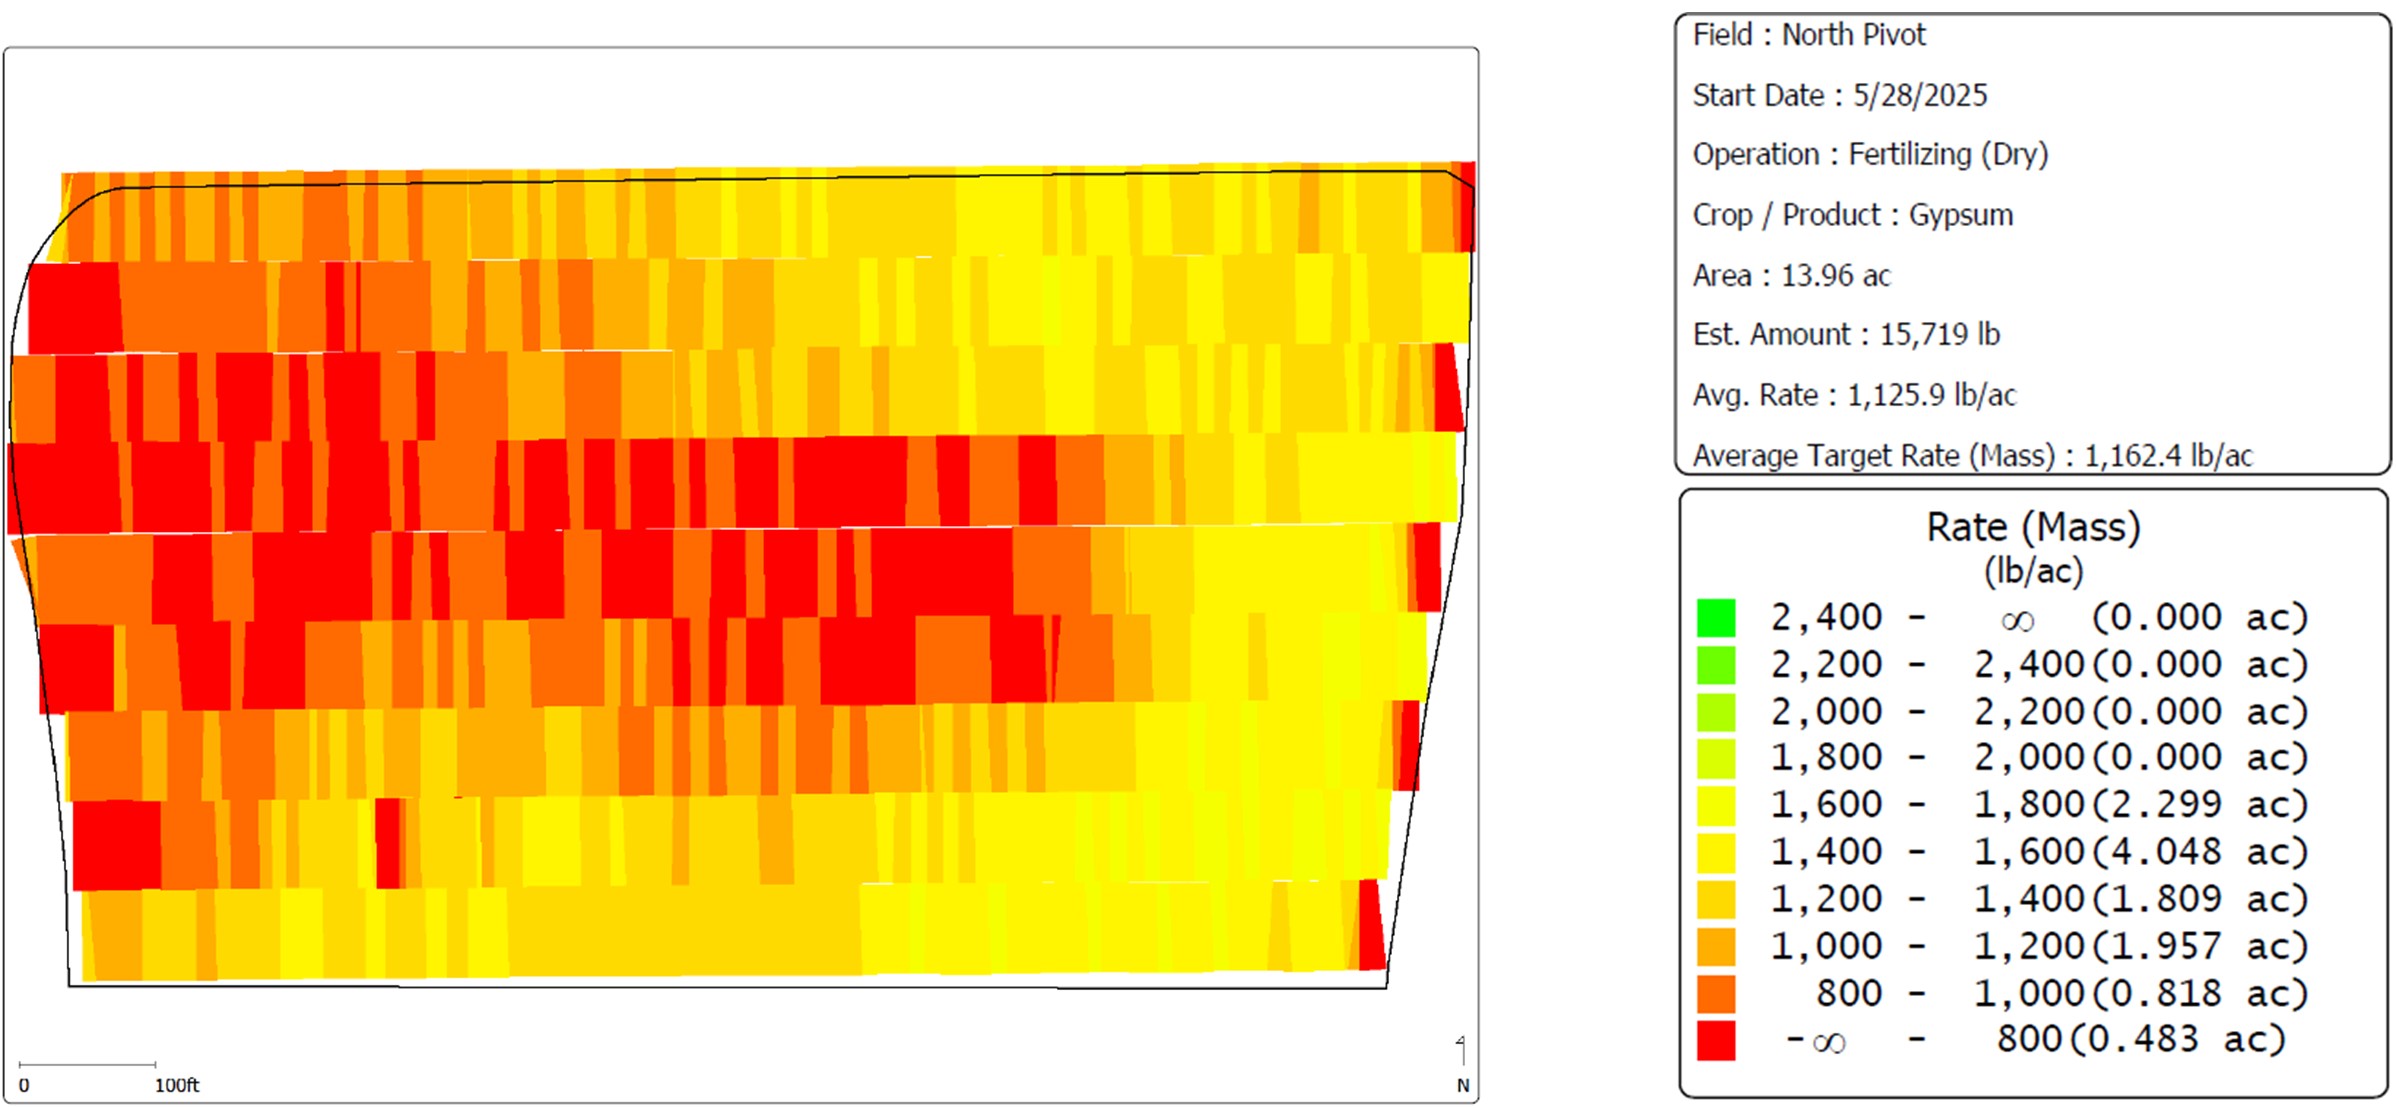
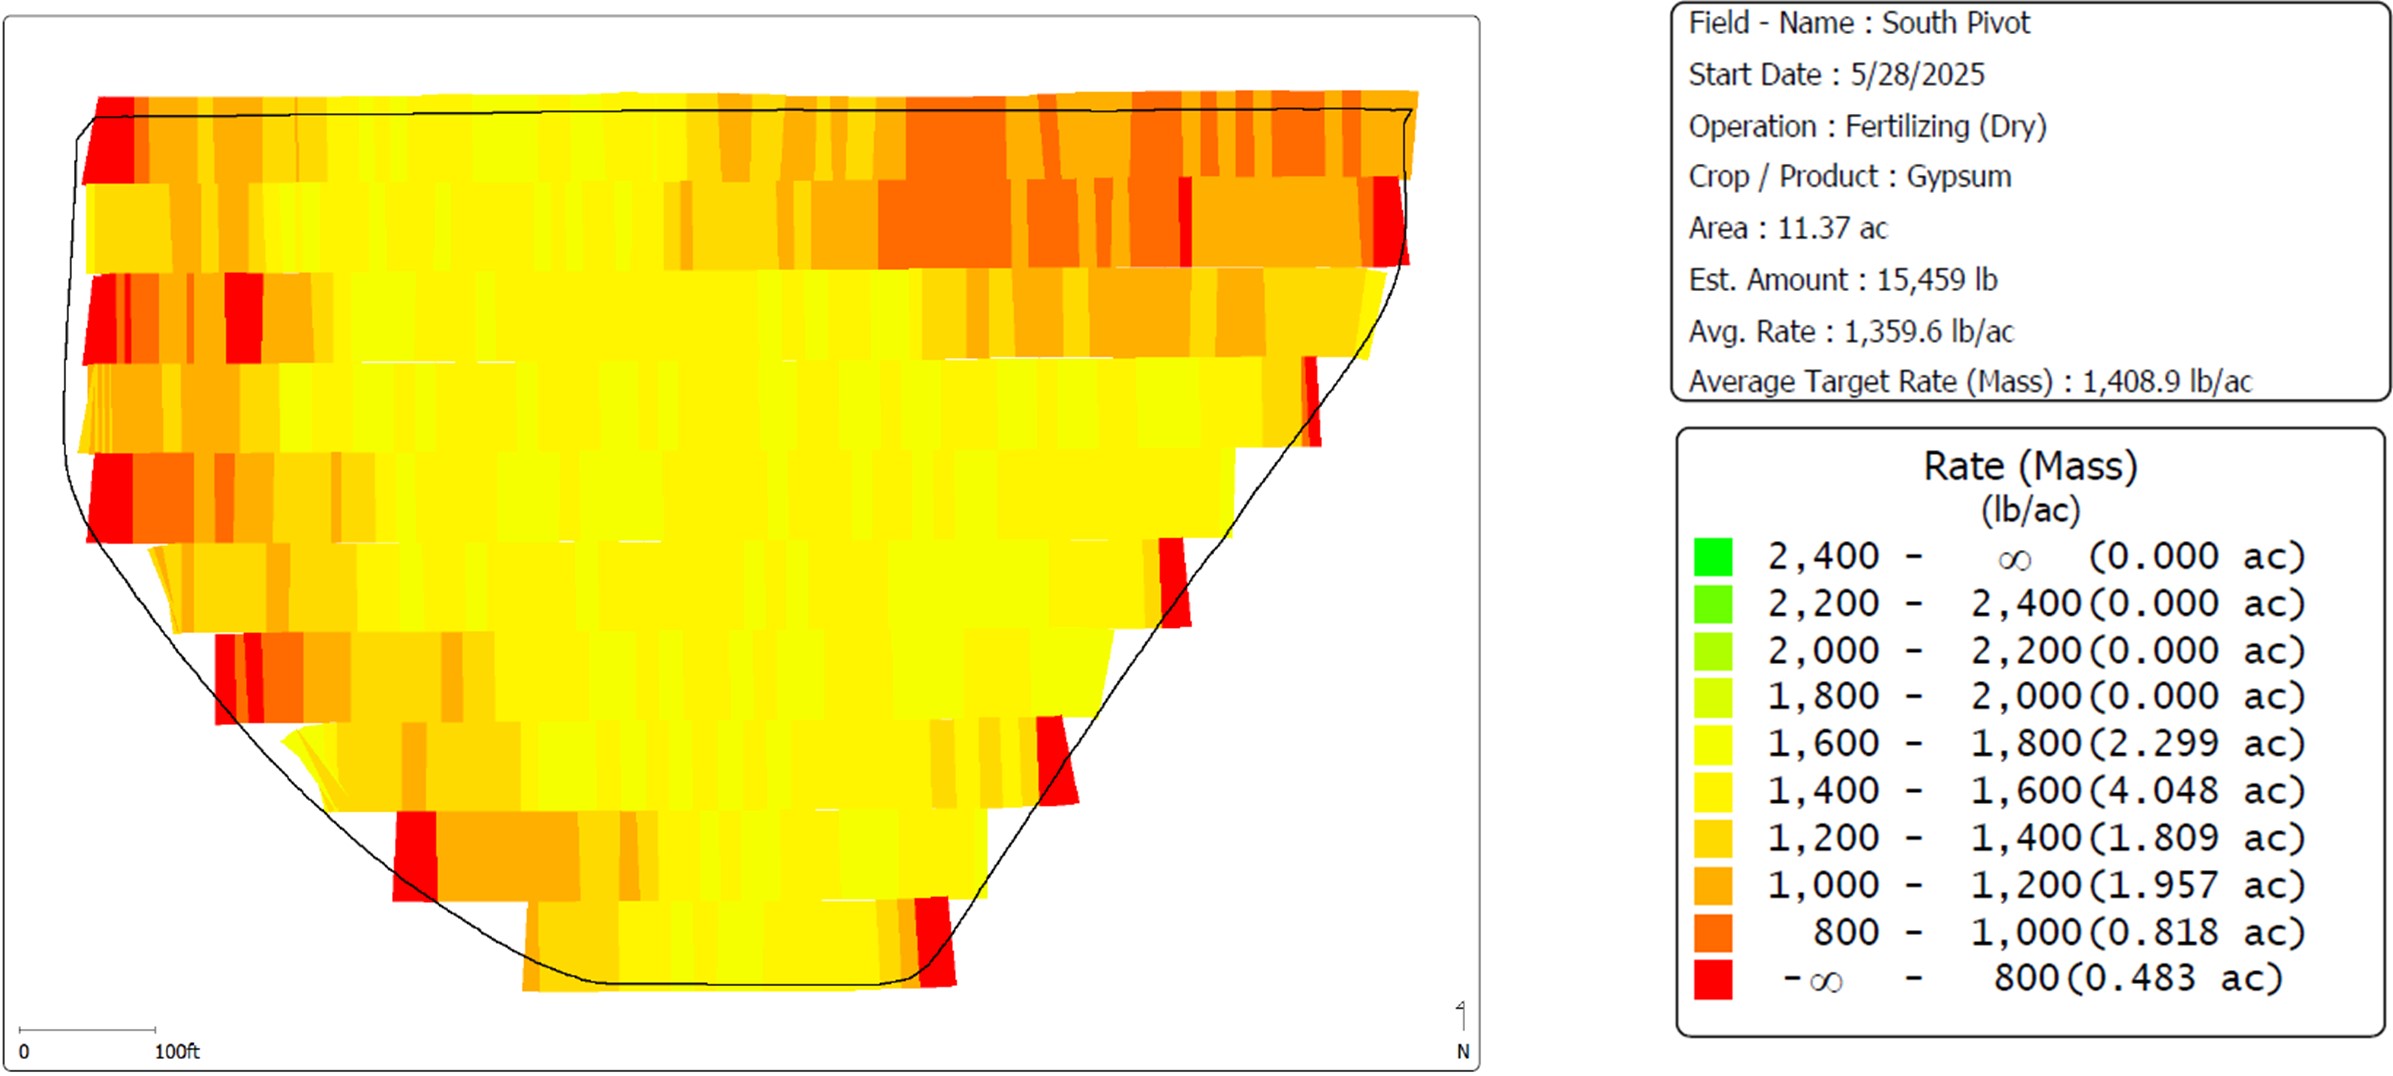
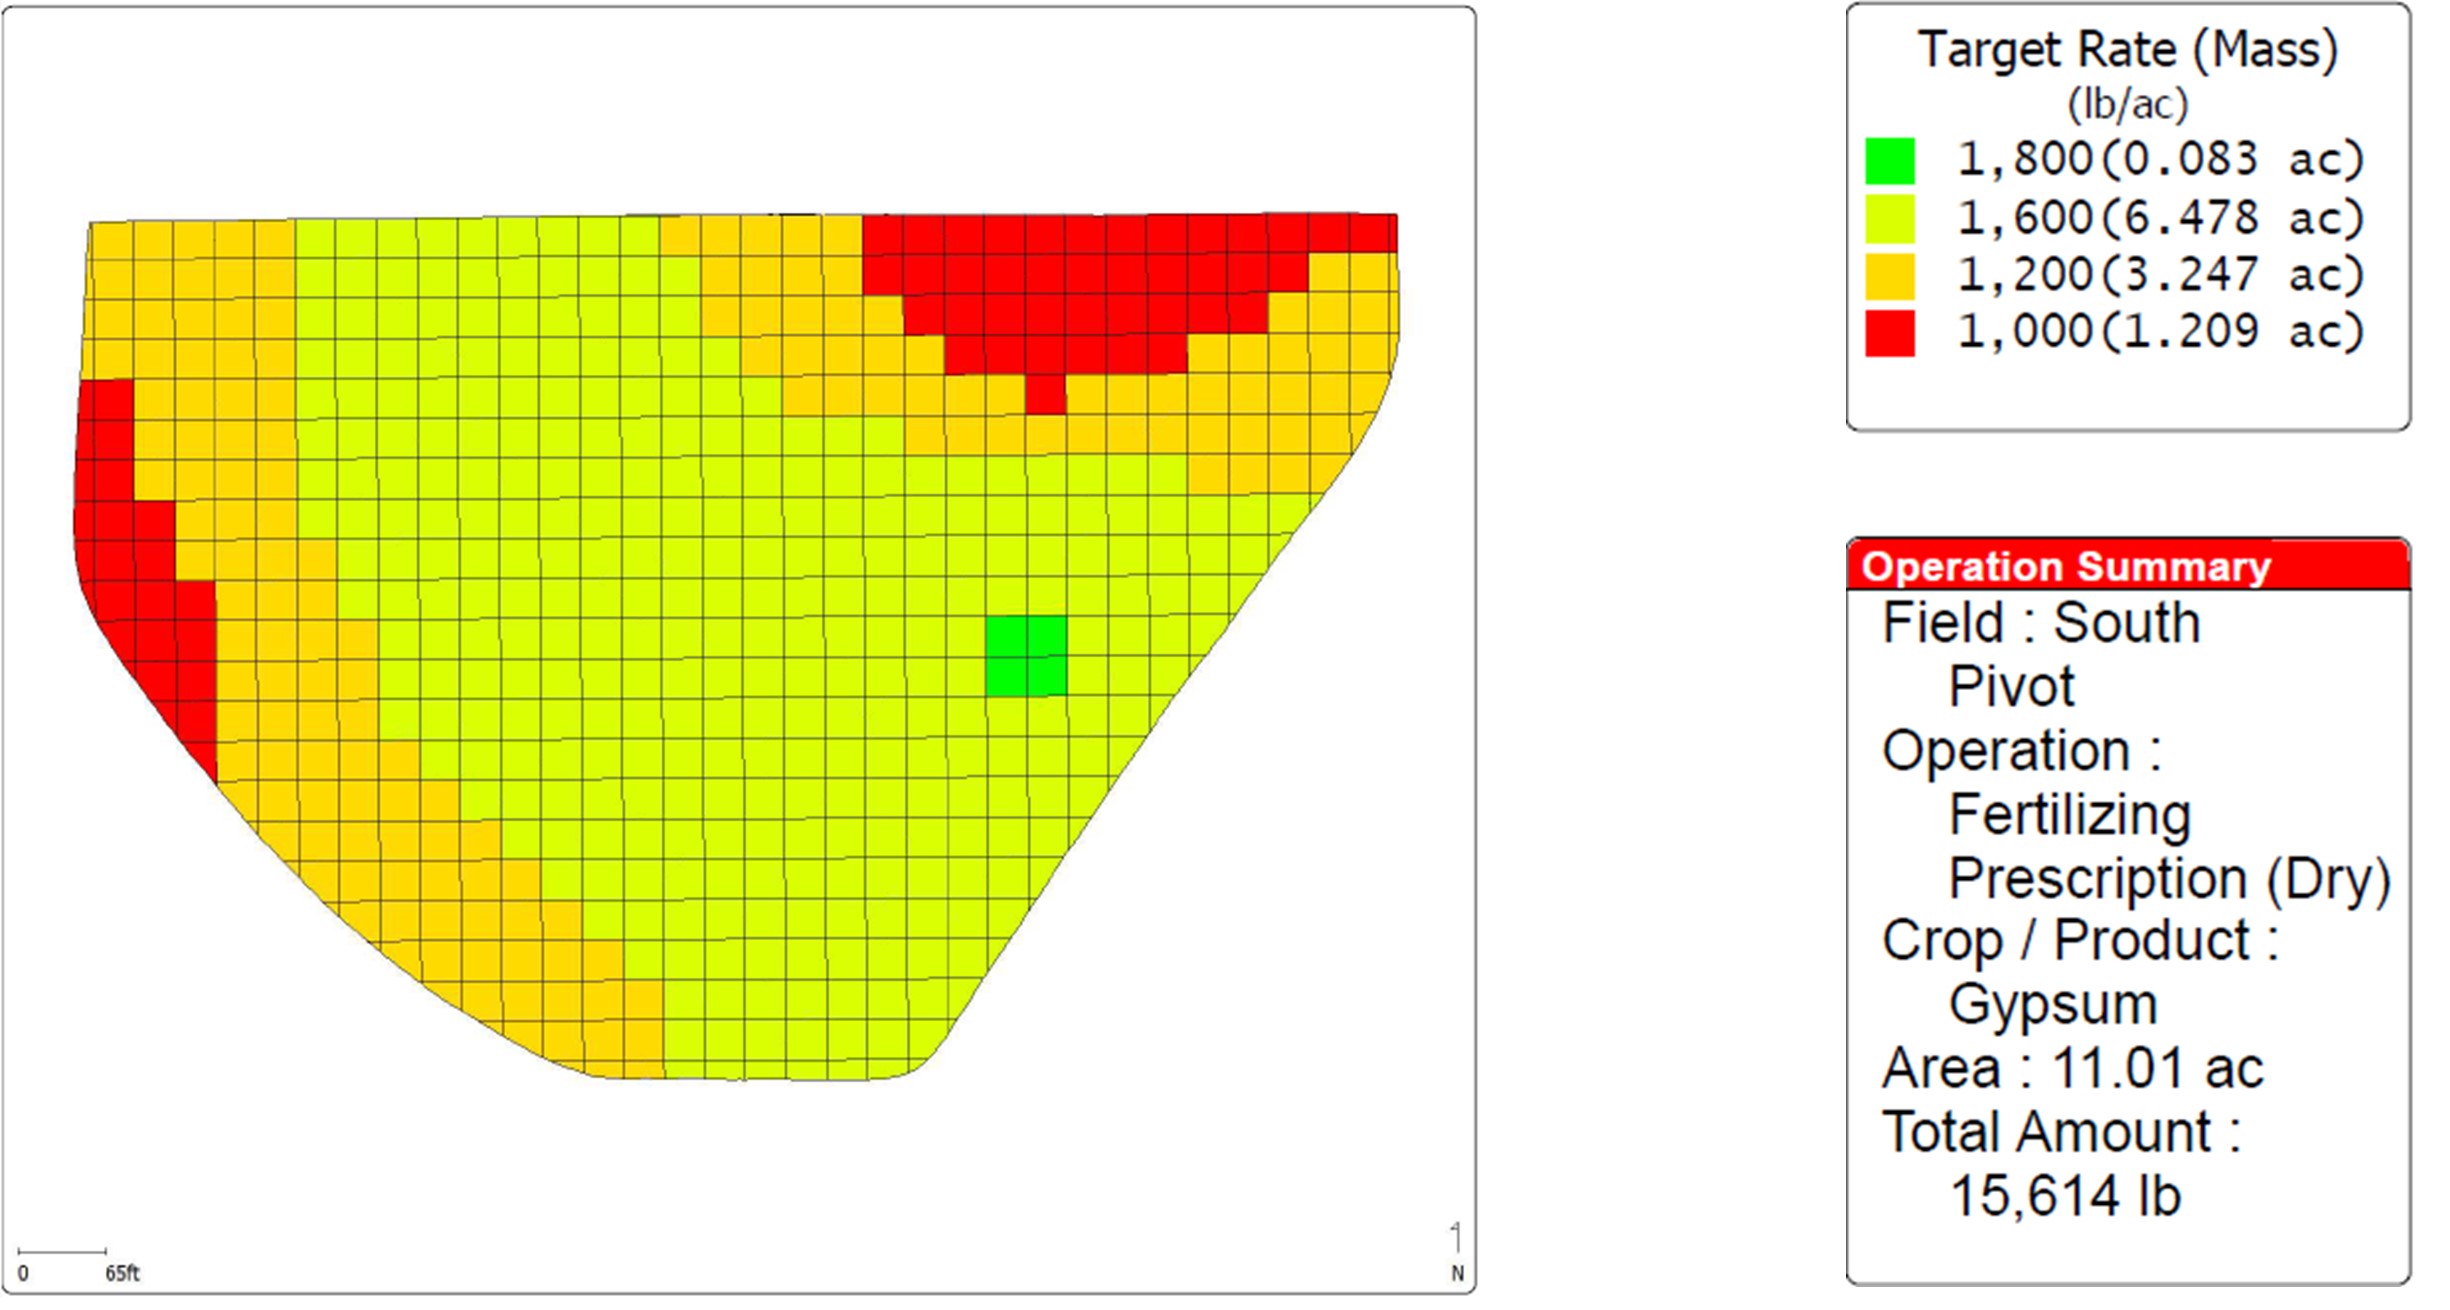
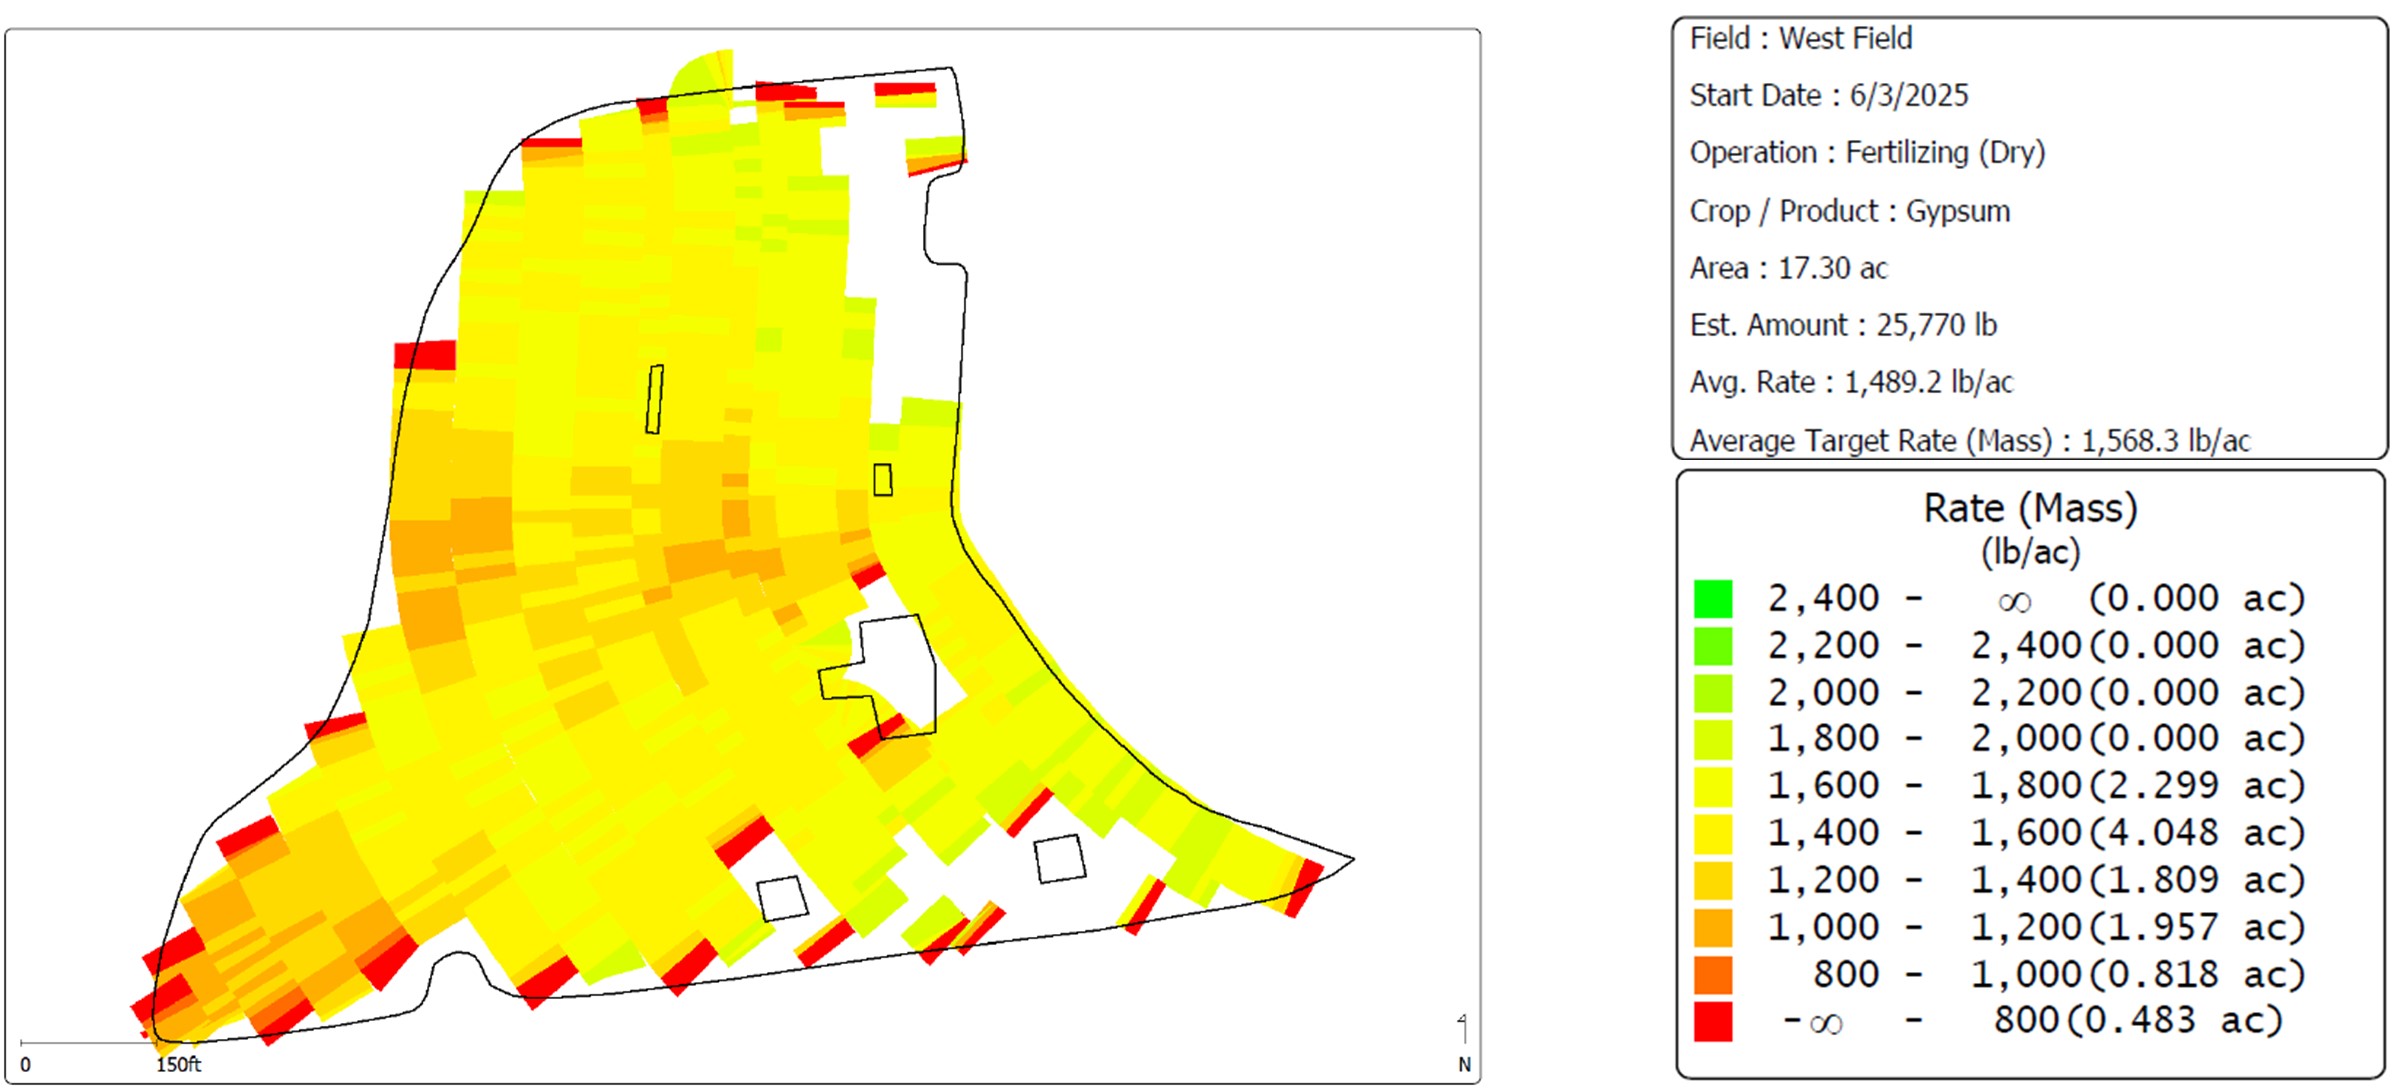
At the end of May, a RoGator spreader from Ty Ty Ag Services came to the DATA Farm to begin applying gypsum to each field using the prescriptions created from recommendations developed by Dr. Henry Sintim at UGA. The gypsum prescriptions were created to address low base saturations of calcium in this year’s soil test results at the DATA Farm. Dr. Sintim’s 2024 ETDS trials produced promising results from addressing low base saturations. Due to equipment availability, the application wasn’t finished until June 3rd. Upon completion of the operations, the as-applied data was retrieved from the Raven monitor in the cab of the applicator and imported into AgLeader SMS for analysis. Unfortunately, some of the data points from the application in Front Field and West field were missing from the monitor export. Nick Gladden rode in the spreader as it applied gypsum in Front Field to verify the prescription loaded correctly to adjust the rate for different areas of the field. He observed the applicator adjusting the rate to match the prescription target and was spreading gypsum as it traversed the entire field. Overall, the as-applied maps of all four fields (Figures 1,3,5, and 7) show that the applicator was able to vary the rate according to the prescription for each field (Figures 2,4,6, and 8). The estimated amount applied for North Pivot was off by 3 percent of the prescription total and the estimated amount applied for South Pivot was off by 1 percent of the prescription total.
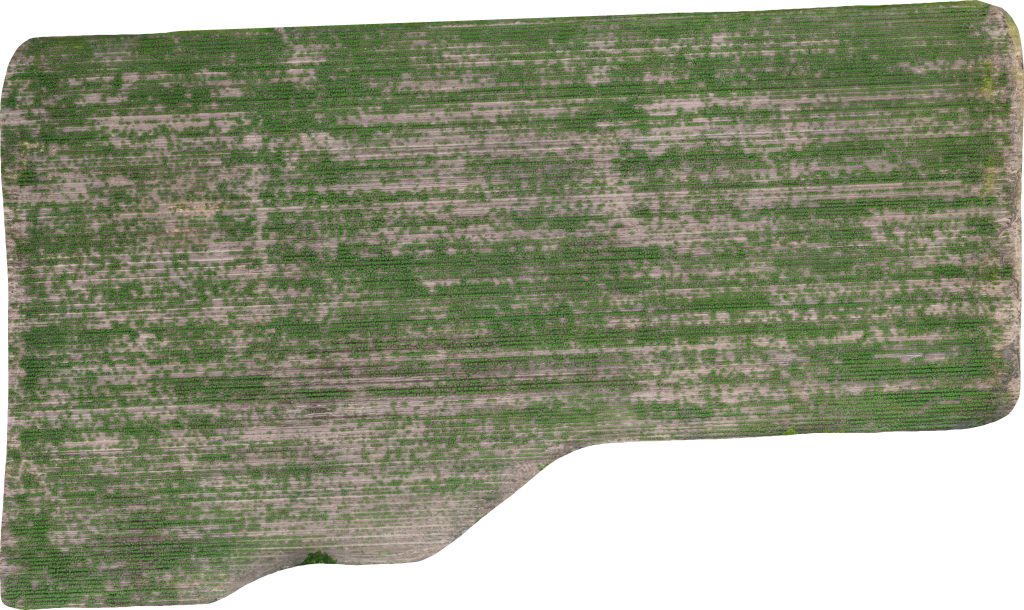
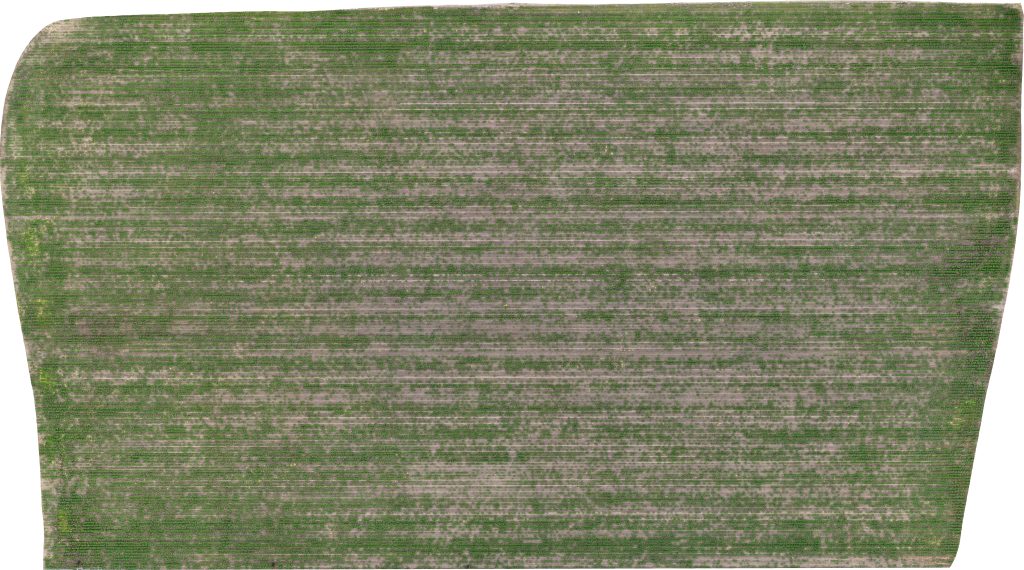
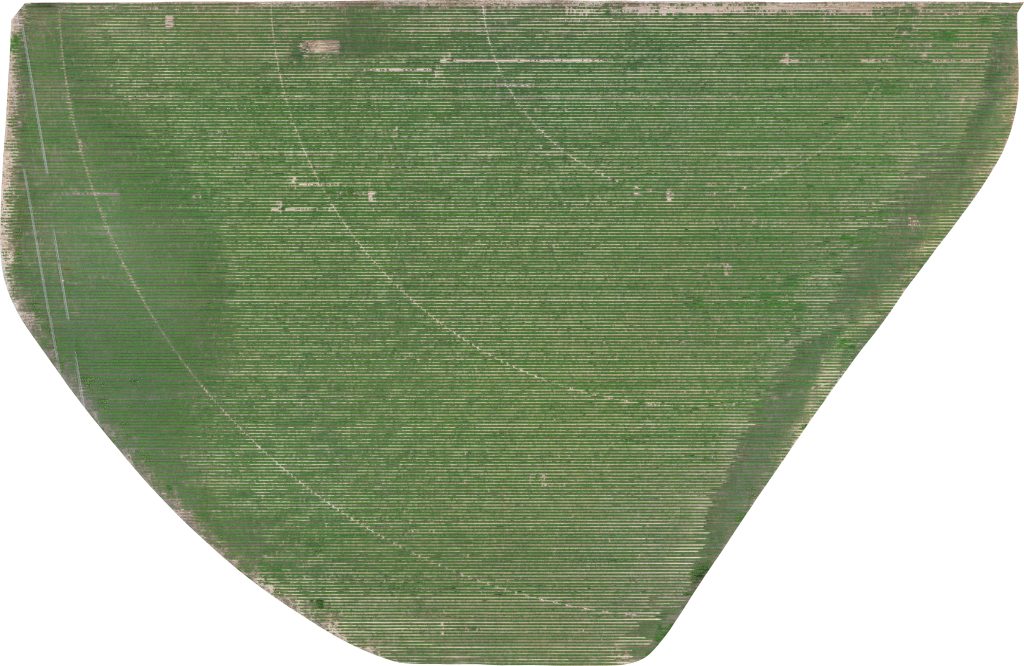
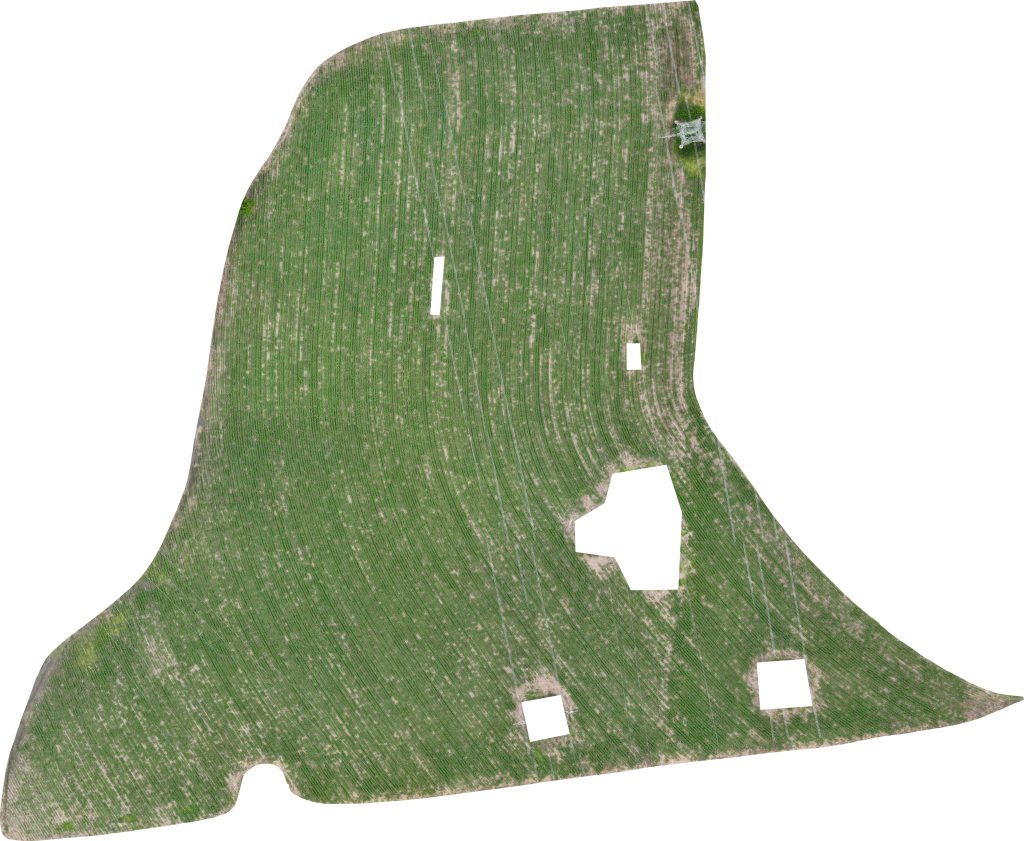
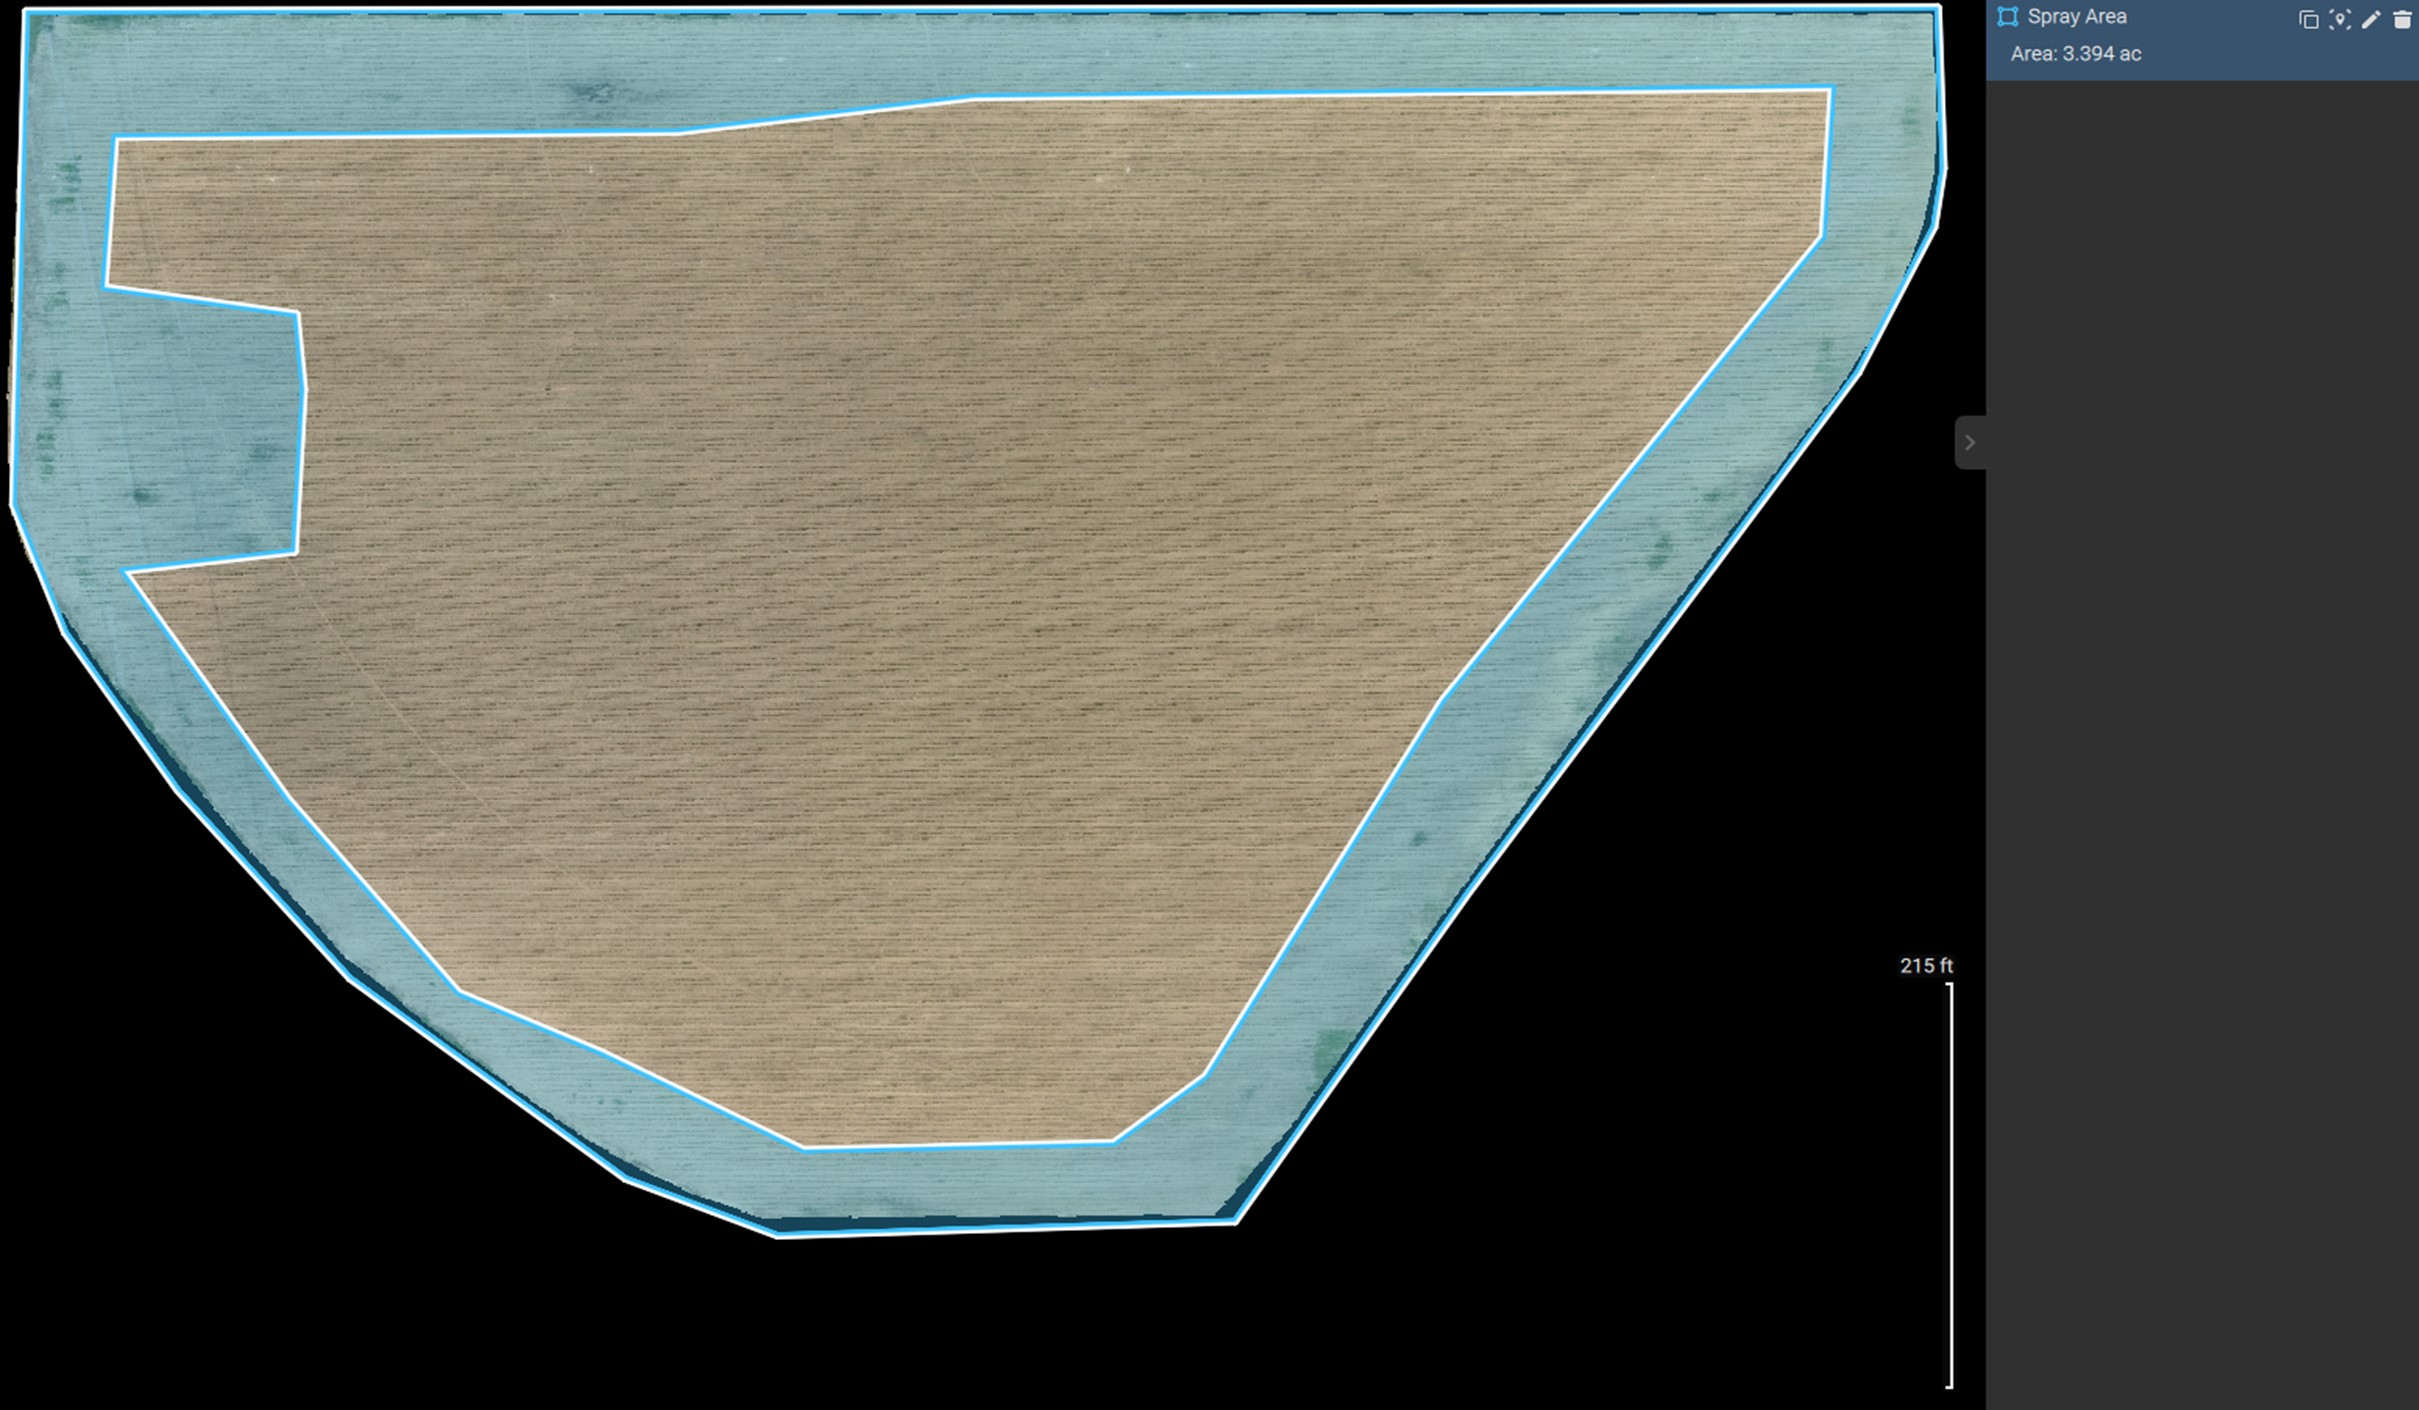
During the first week of June, drone imagery (Figure 9) showed areas of weed pressure in South Pivot that were verified during field scouting. The areas of weed pressure are outlined on the UAV flight image in Figure 10. Most of these areas were caused by low spray rates due to the sprayer building pressure at the start of each pass during the pre-emerge herbicide application. This resulted in poor herbicide coverage in these areas, and these areas contained pigweed from 2-4 inches in height along with yellow nutsedge. From scouting, it was observed that the weeds had almost reached the growth point where chemicals would be ineffective, so it was decided not to wait until the planned post-emerge application scheduled for 6/15. With the majority of the field not showing signs of weed pressure, a targeted herbicide application was developed.
To create the herbicide application plan, the affected areas were measured with Pix4D Fields. This allowed for an estimate of the herbicide needed. The estimated total was 3 acres. This area does not distinguish between different weed types that need different herbicides but provides a general estimate for planning. Referencing the UGA Pest Management handbook, Cadre was chosen to control the yellow nutsedge, and Ultra Blazer was chosen to control pigweed. Note that Cadre does have a crop rotation restriction that prevents cotton from being planted in the field for 18 months. This is not an issue for us because corn is the planned crop in this field for 2026.
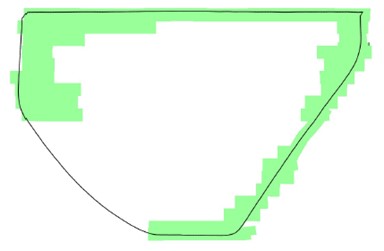
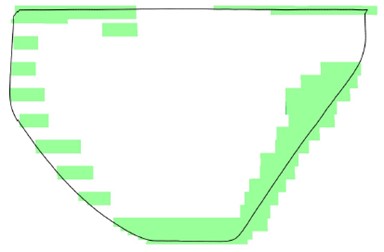
These chemicals required separate operations to prevent the broadleaf herbicide (Ultra Blazer) from reducing the effectiveness of the grass herbicide (Cadre). Each herbicide was mixed to cover 3 acres and applied based on visual observation from the tractor. Figures 11 and 12 show as–applied coverage maps from each application. Cadre cost $54.39 to apply while Ultra Blazer cost $60.54 to apply. Compared to a full field estimate of $235.44, $120.51 was saved using this method. Using the drone image to estimate the application amount reduced excess herbicide waste after all the weeds were sprayed.
The yellow nutsedge in areas sprayed with Cadre responded to the herbicide by slowly turning yellow and eventually dying. The pigweed sprayed with Ultra Blazer showed minimal response to the herbicide treatment. A chemical dealer recommended checking the water pH at the fill station. The results of this test were a water pH of 7.4 which can reduce the effectiveness of certain herbicides that are weak acids such as Ultra Blazer (source: Dr. Eric Prostko, cited in UGA Extension Blog and Water Quality and Herbicides). To prevent this issue in the scheduled post-emerge herbicide on the peanuts, an acidifying agent from Triangle Chemical (CORRECT pH) was added to the spray tank before the chemicals. The herbicide mixture of Cobra (12 oz/ac), 2,4 DB (16 oz/ac), and Dual Magnum (16 oz/ac) with the acidifying agent provided better control of the pigweed and morning glory present in the field than the previous spray.
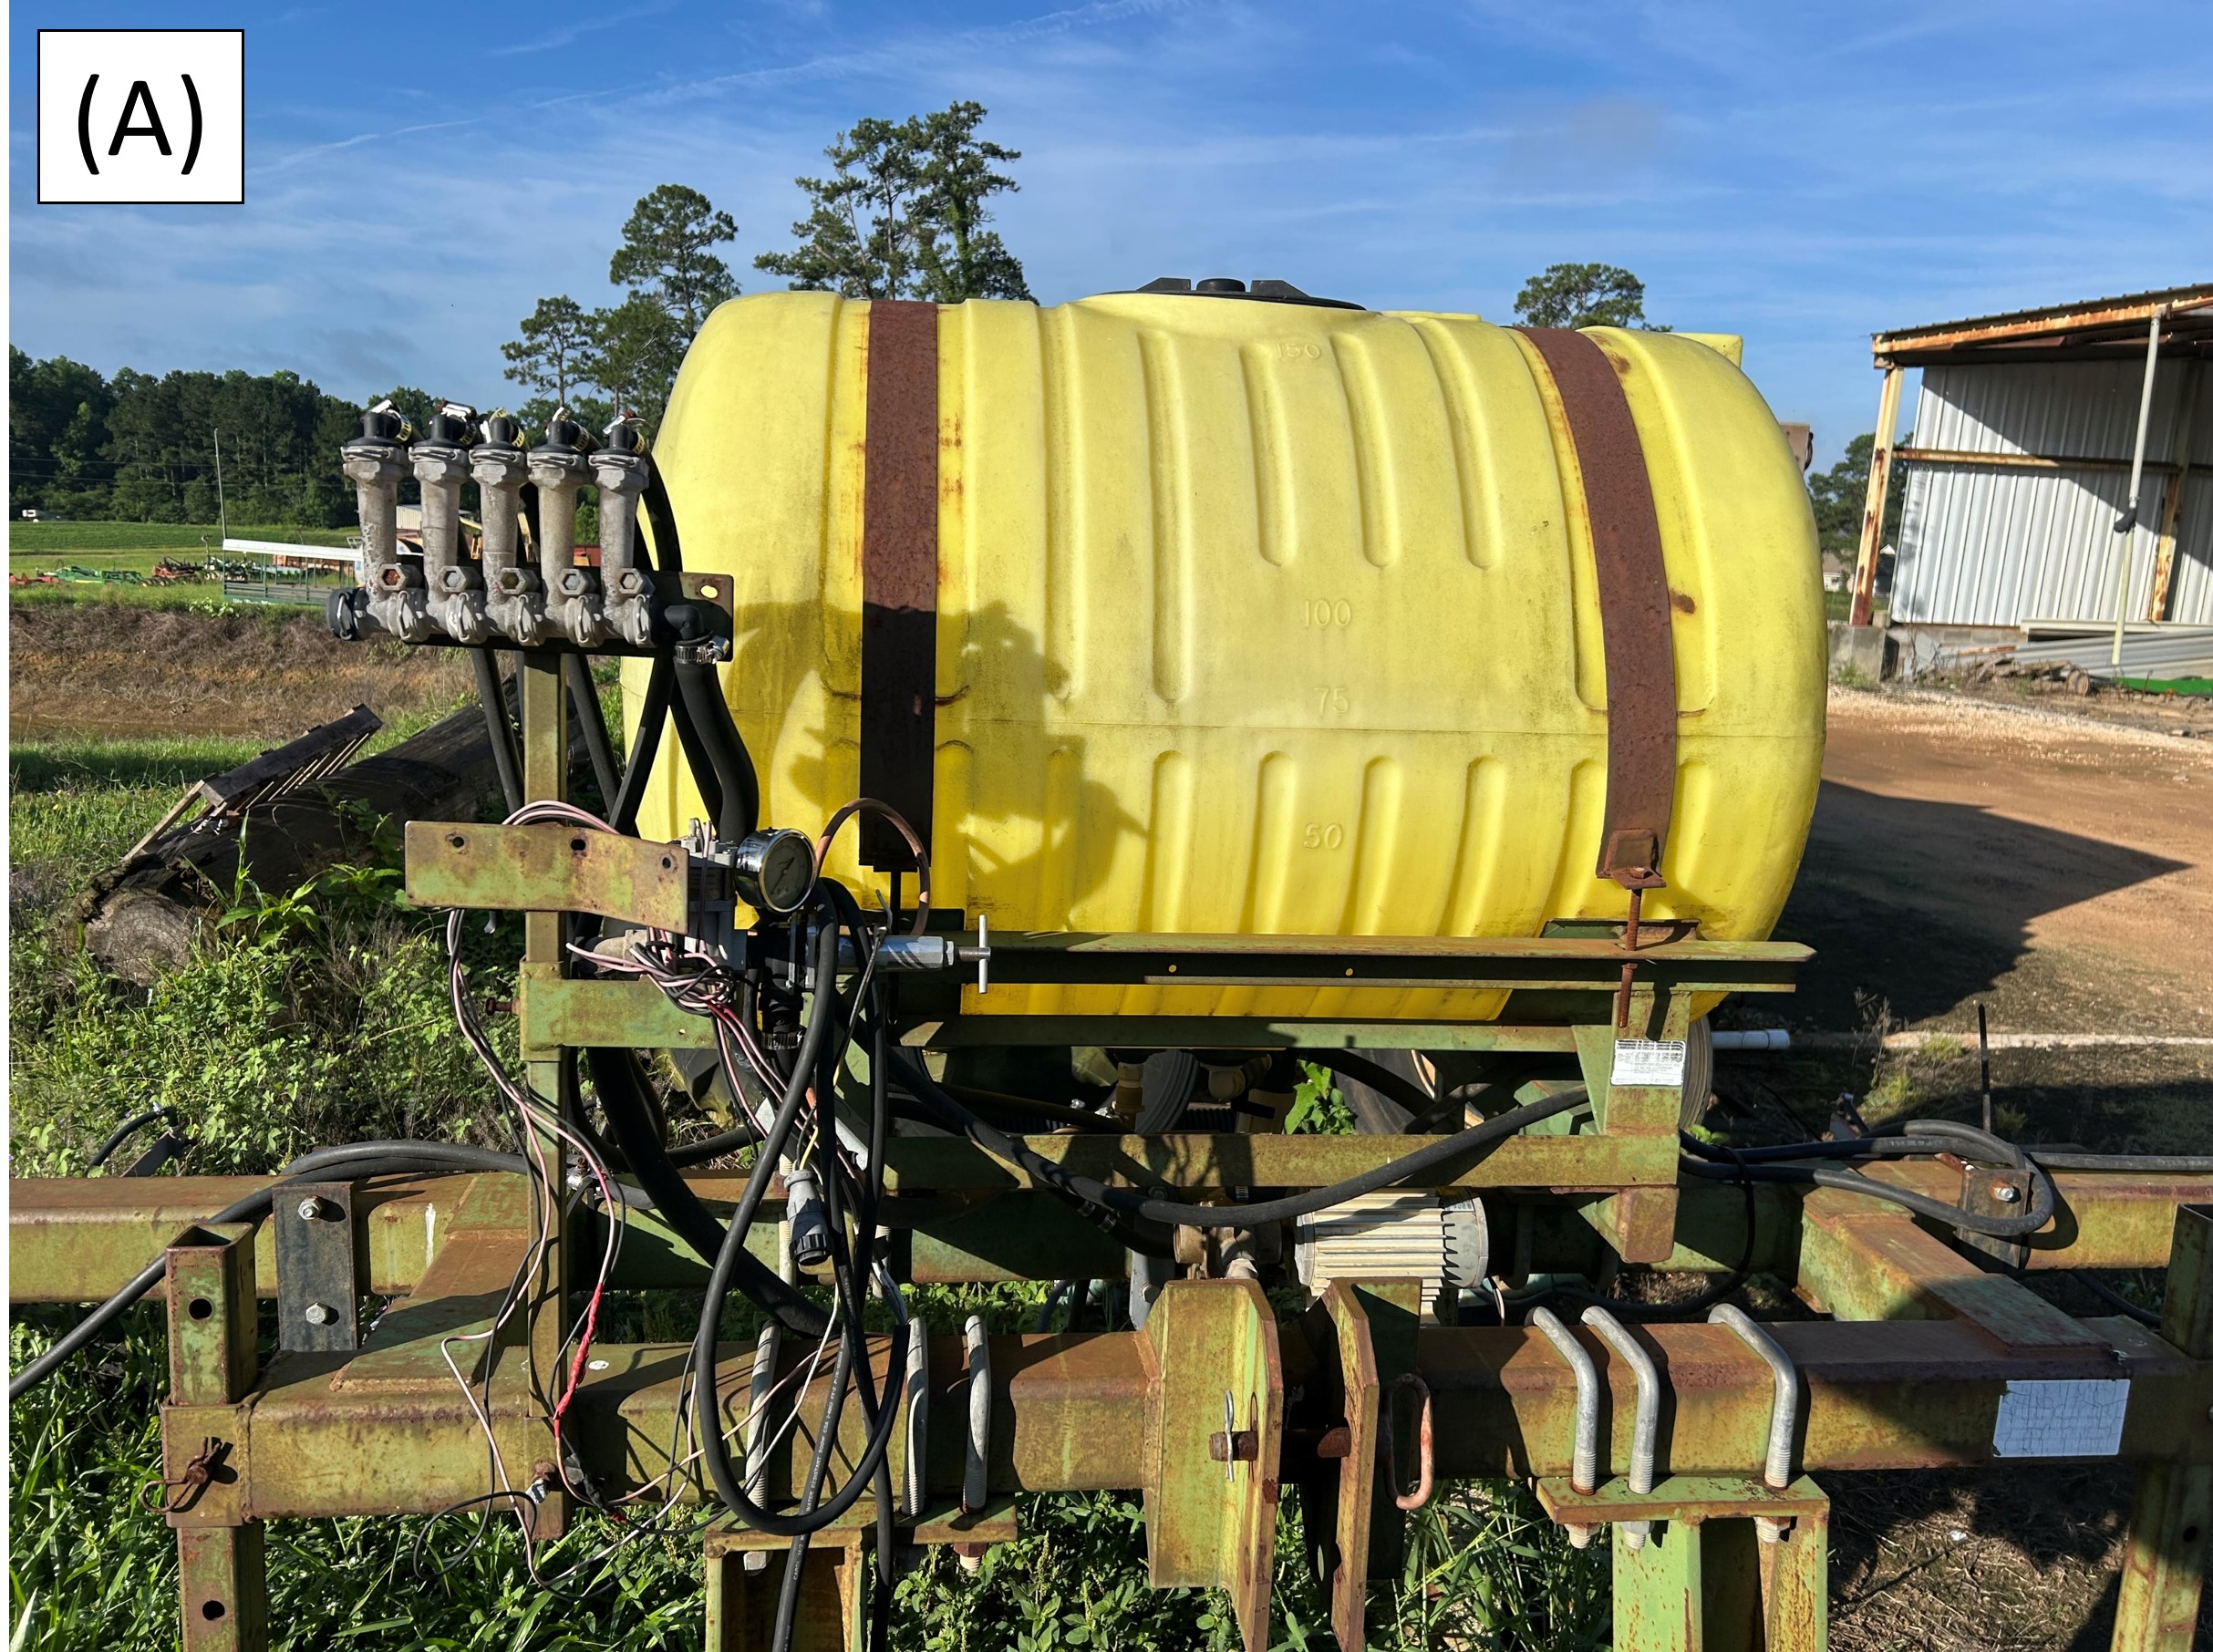
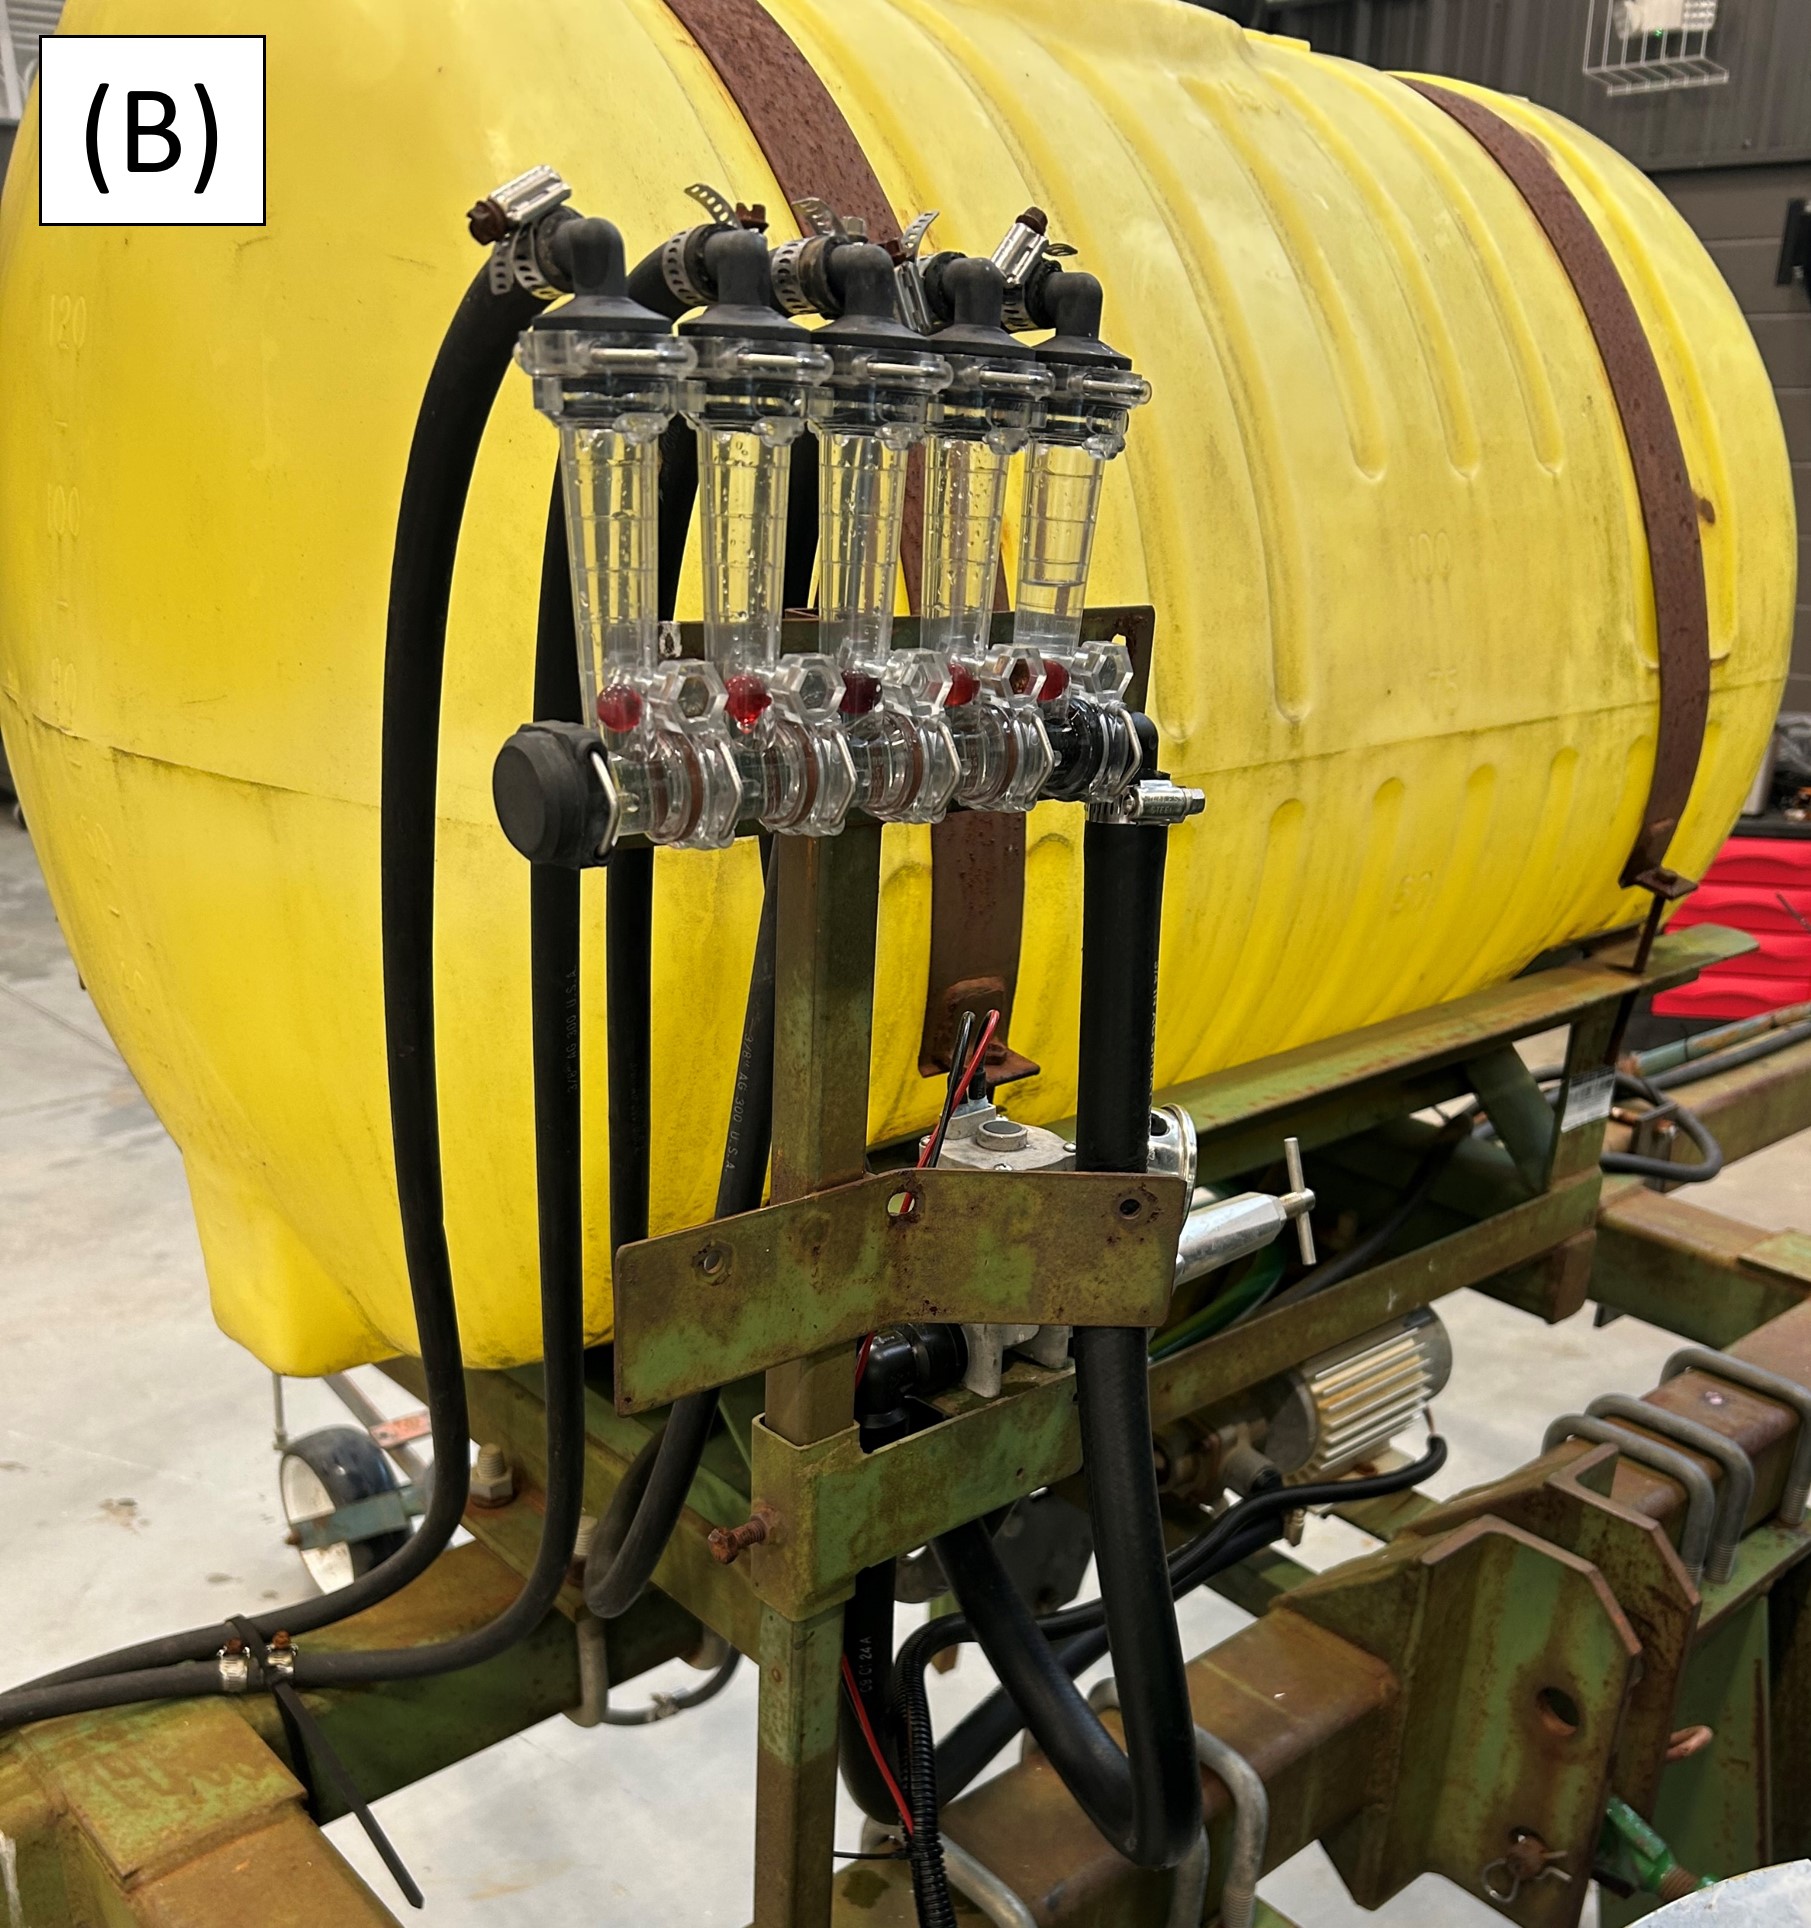
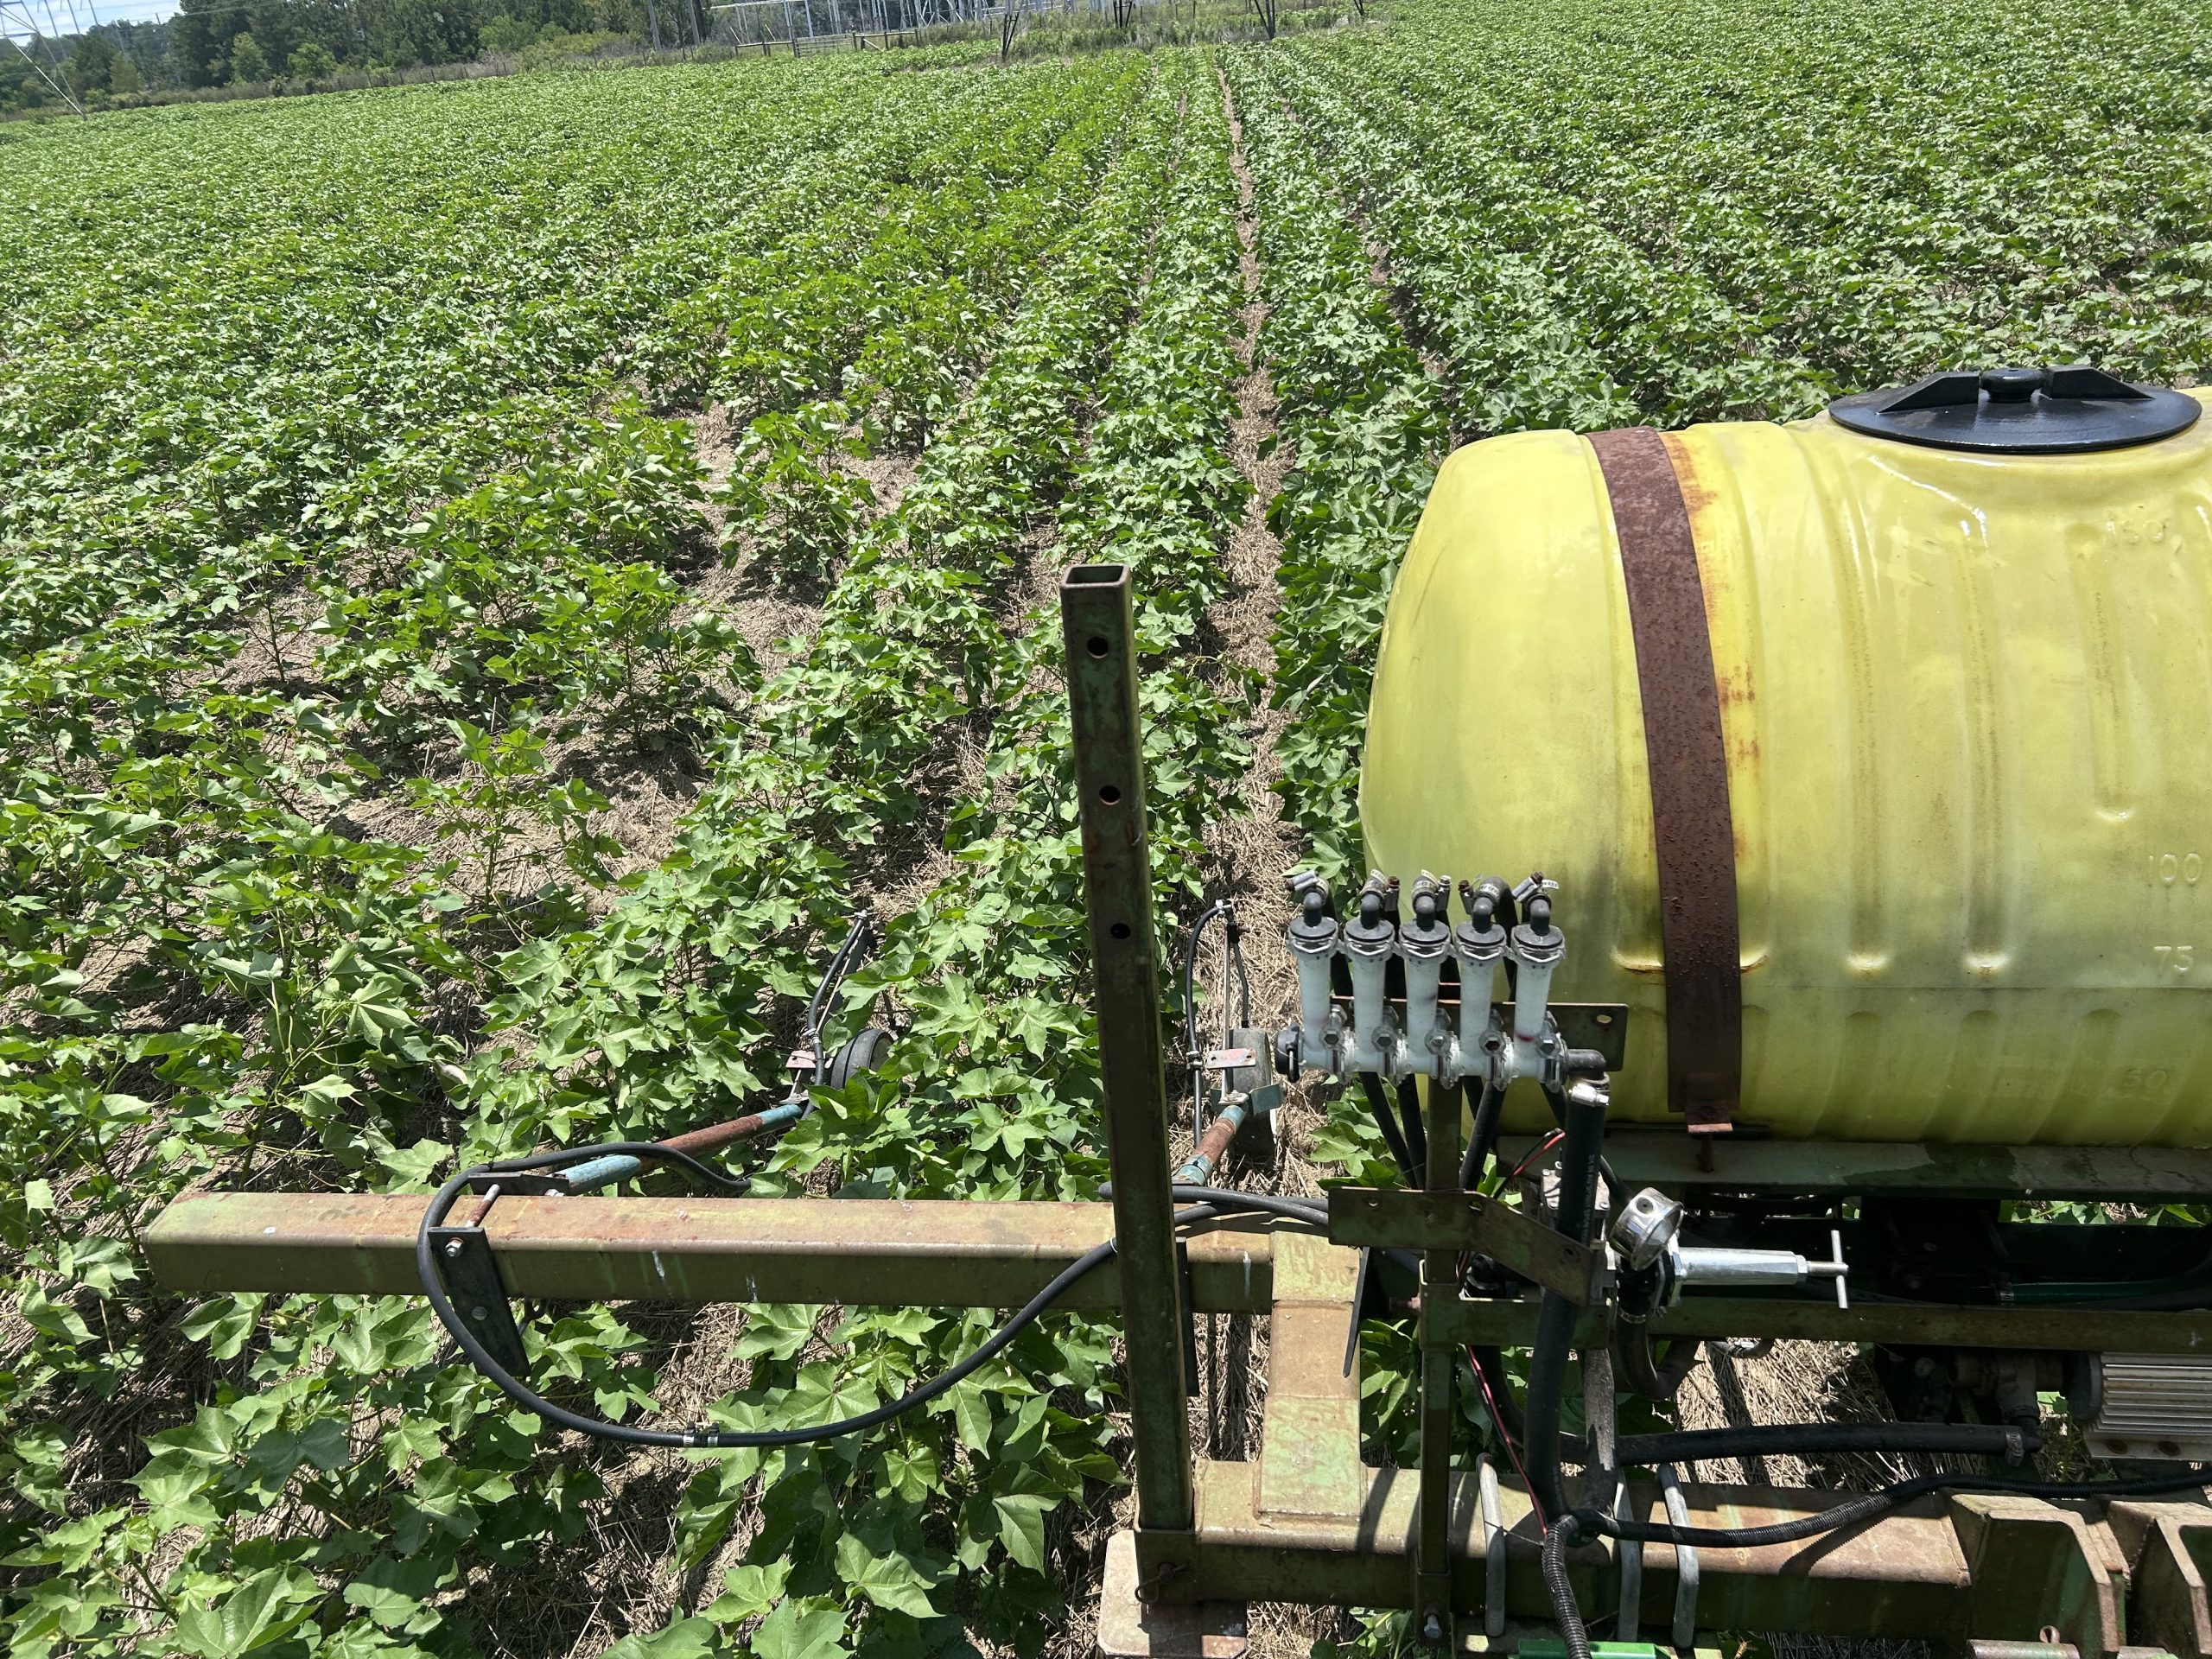
The second post-emerge herbicide mix for the cotton fields consisting of Liberty and Dual Magnum was scheduled for mid-June, but the cotton had advanced past the 8-leaf stage. The UGA Pesticide Handbook recommends a direct spray application for Liberty after cotton reaches the 8-leaf stage to reduce injury to the crop and increase spray coverage. ABAC has a 4-row direct sprayer, but it needed repairs before spraying the cotton fields at the DATA Farm. Figure 13A below shows the condition of the sprayer before repair, the manifold needed replacing along with plumbing fittings and electrical control wires. Figure 13B shows the sprayer after completion of repairs on June 26th. The sprayer was then calibrated to apply a rate of 15 gallons per acre at a speed of 5 miles per hour. The herbicide mixture of Liberty (43 oz/ac), Dual Magnum (16 oz/ac), and acidifying agent was applied on June 27th. Figure 14 shows the direct sprayer applying herbicide mixture beneath the crop canopy in Front field. The direct spray resulted in the termination of most pigweed without injury to the cotton.
The monthly temperature trends and rainfall recorded by the on-site weather station for June are shown in Figure 15.
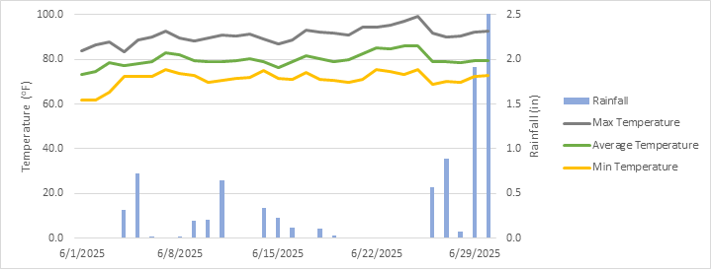
The average of recorded maximum temperatures for the month was 91oF which is in the average historical range of 88 oF to 92 oF (Figure 16B), and the average of recorded minimum temperatures was 71oF which is within the average historical range of 67oF to 71 oF (Figure 16C). The period of hot dry weather just past mid-month paired, with South Pivot’s peanuts entering flower stage of reproduction, triggered our first sensor-based irrigation event on June 25th. The pivot applied 0.75 inches of irrigation to the peanuts, wetting the soil to below irrigation threshold values. The rain events at the end of the month prevented the need for further irrigation.
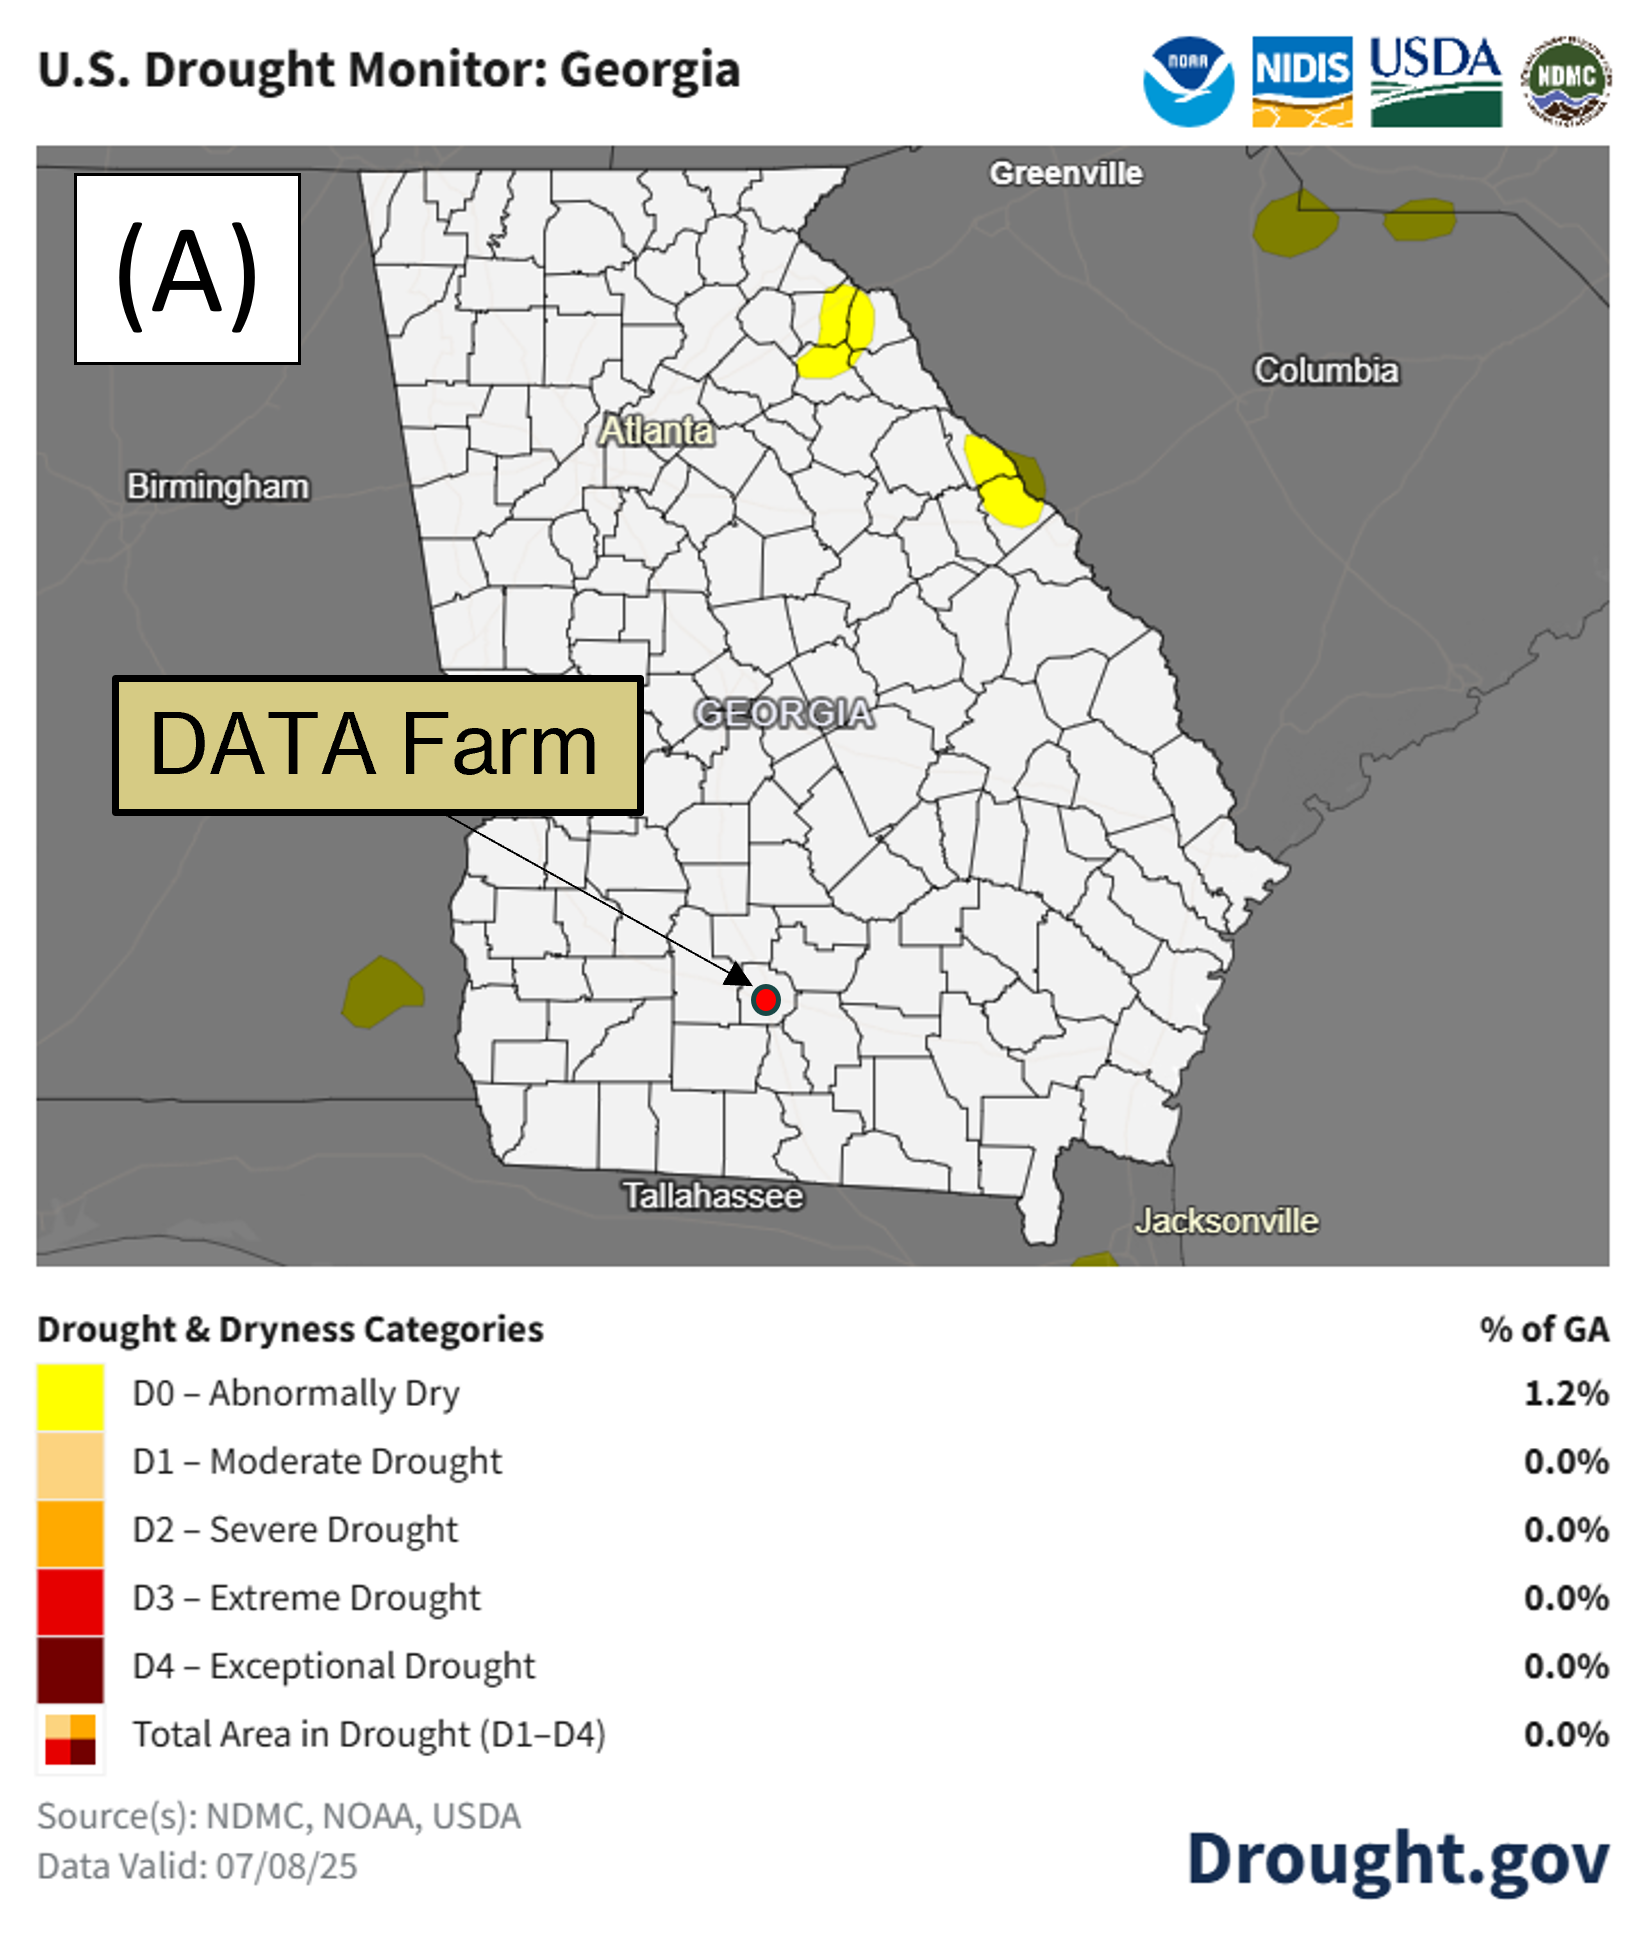
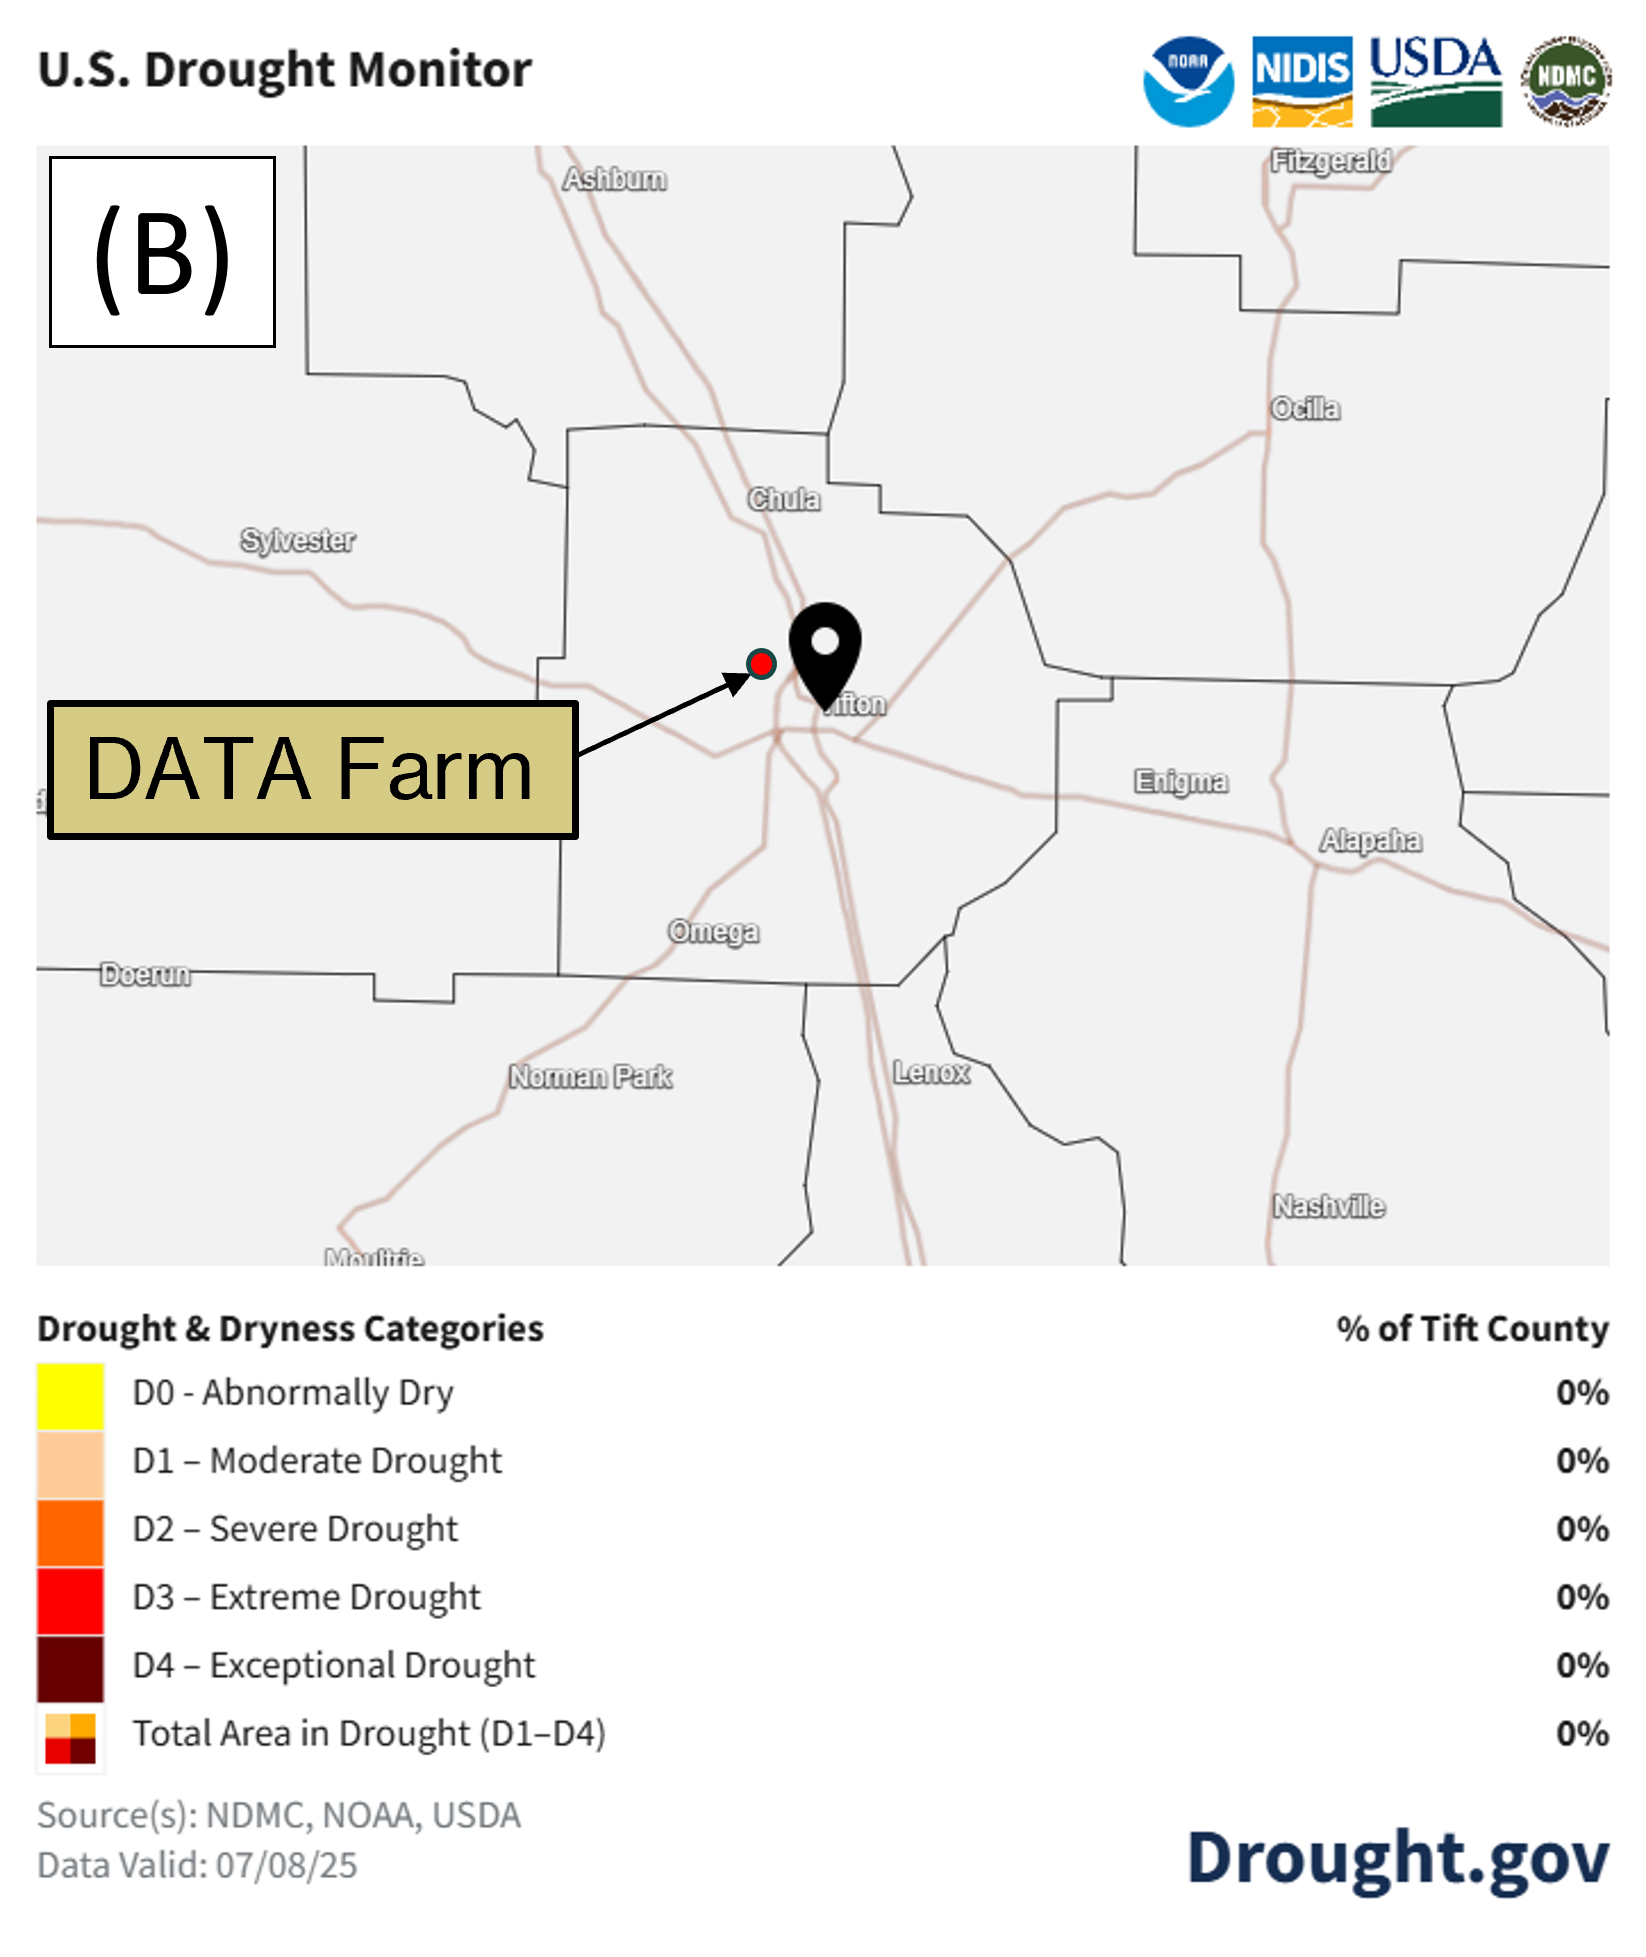
Figure 17A shows the drought monitor map as of July 8th, from the National Integrated Drought Information System for Georgia. Abnormally dry conditions are present in only 1.2% of the state. Figure 17B shows no drought or dry conditions for Tift County where the 4D Farm is located.
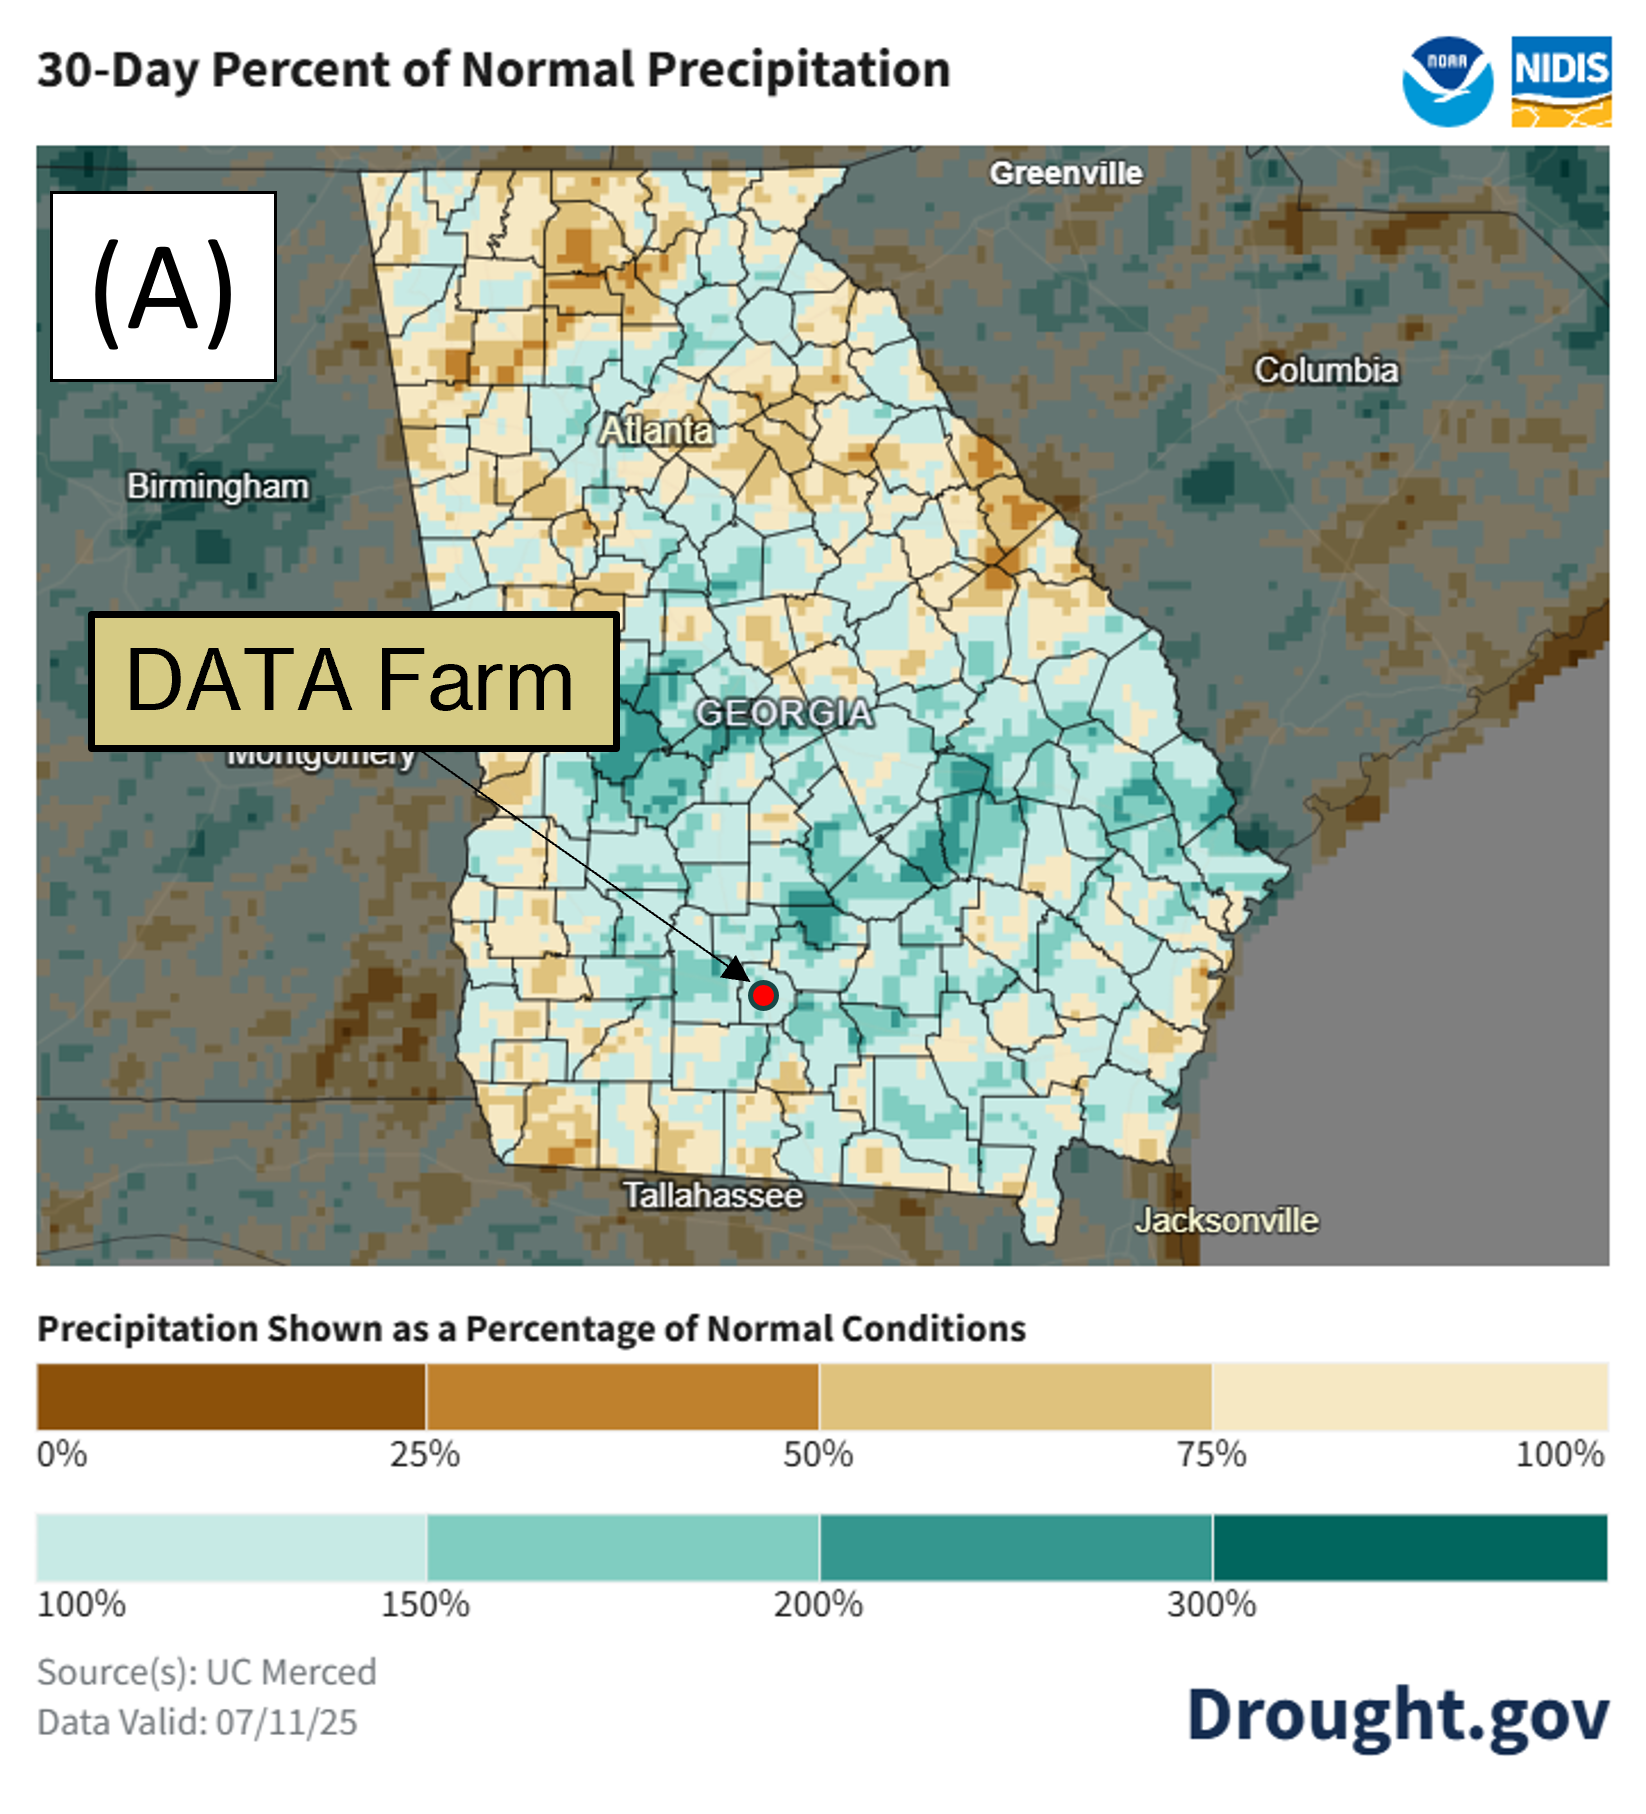
The images in Figure 18 show precipitation for the 30 days prior to July 11th for the state of Georgia (Figure 18A) and the Tift County area (Figure 18B) as a percentage of the historical average (1991–2020) for the same period. Green/blue shades indicate above-normal precipitation, while brown shades indicate below-normal precipitation. These maps show the variation in rainfall received across the state and that the area around the DATA Farm received above normal rainfall during the previous 30 days
The following sections list tasks performed during the month of June
Second Post-Emerge Herbicide mixture of Liberty (32 oz/ac), and Dual Magnum (16 oz/ac) applied on 6/27/25 using direct sprayer.
Second Post-Emerge Herbicide mixture of Liberty (32 oz/ac), and Dual Magnum (16 oz/ac) applied on 6/27/25 using direct sprayer.
Operations:
Subscribe to get the latest posts sent to your email.