
The month of July started off with the first blooms appearing in all cotton fields and ended with the fields in peak bloom (Figure 1). The first application of plant growth regulator (PGR) was applied to the cotton fields on 7/7/25 at a rate of 16 oz/ac to slow down the vegetative growth of the cotton plants. A liquid 10% boron product was added to the PGR tank mix to make the first recommended 0.25 lb/ac application of boron. A second application of PGR (16 oz/ac) and liquid 10% boron (0.25 lb/ac) was applied on 7/17/25.

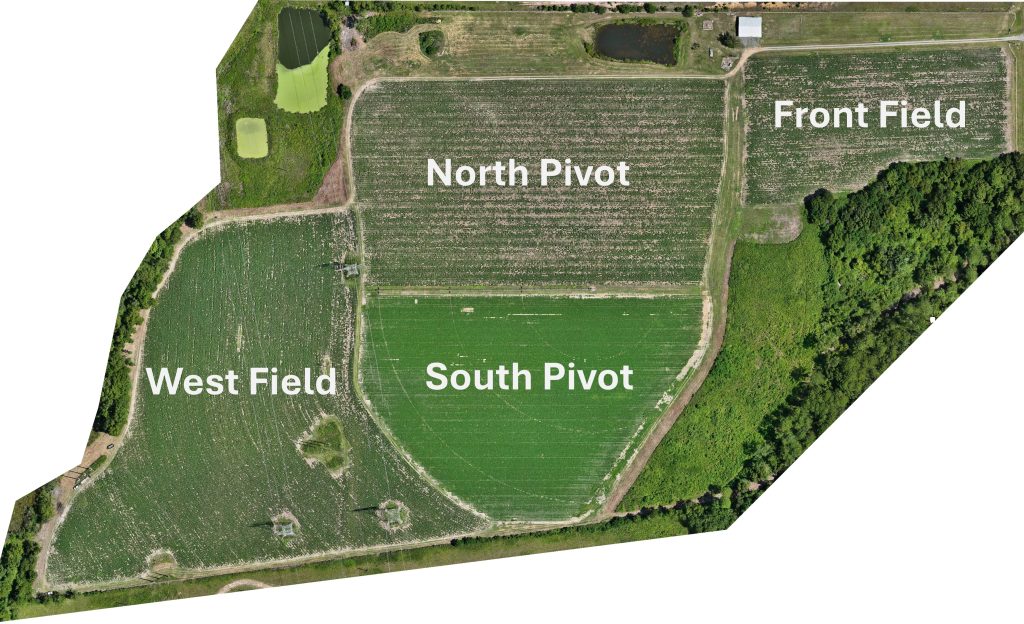
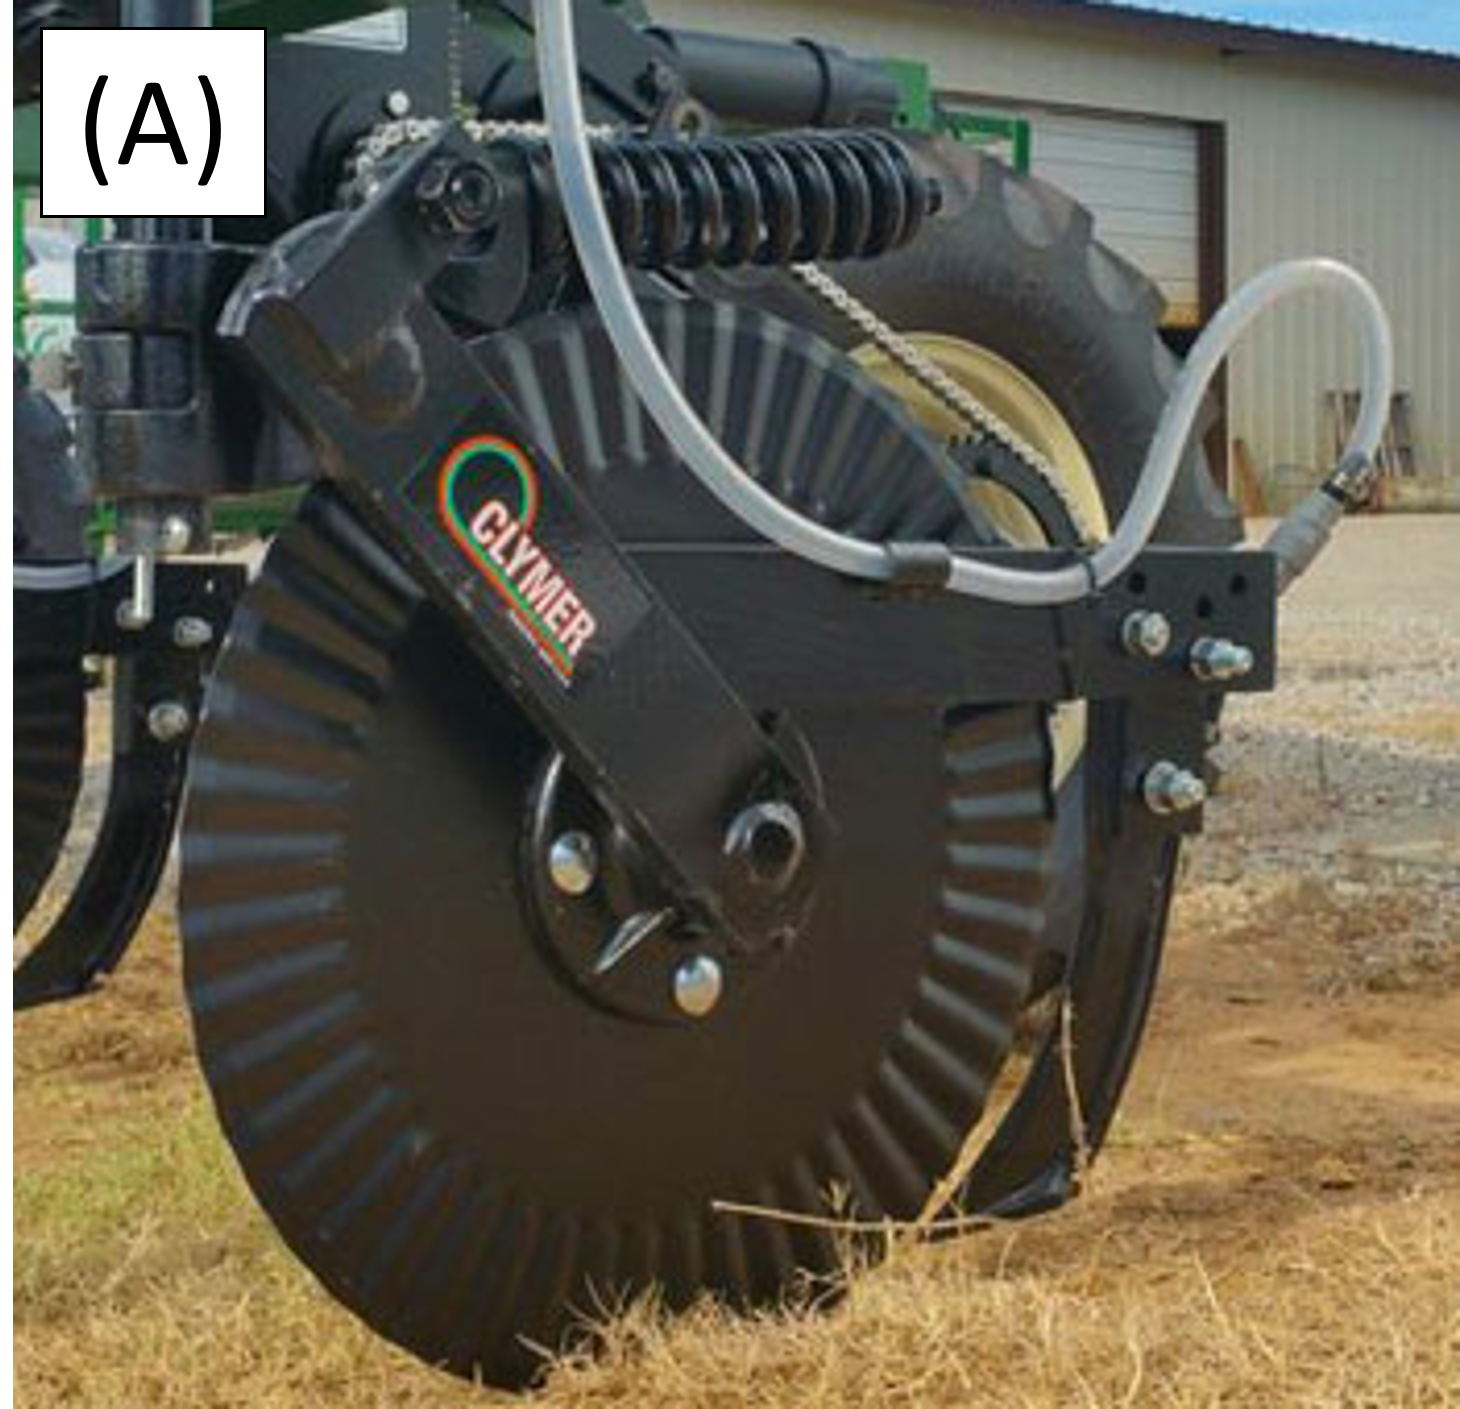
In between the PGR applications, the remainder of this season’s nitrogen recommendation was applied to the cotton crop. An LMC 800 series nitrogen coulter applicator applied a liquid nitrogen fertilizer (18-0-0-3) at 35 lbs N per acre for the two dryland fields (Front Field and West Field) and 70 lbs N per acre to the irrigated cotton (North Pivot Field). This brought the total applied nitrogen for the season to 70 and 105 lbs N per acre for dryland and irrigated fields, respectively. As a result of our residue management plan, the knives on the applicator were accumulating and dragging rye residue down the rows. The accumulated residue was breaking nodes off the cotton plants and stripping squares from the plants. To resolve this issue, the knives were removed and replaced with a tube to drop the liquid product just behind the coulter on the surface. Figure 2 shows a system with knives (A) and our system without knives (B). Removing the knives should not impact the application effectiveness because the 18-0-0-3 liquid product doesn’t volatize as easily as urea products during hot weather, so it will last on the surface longer. The DATA Farm weather station recorded 0.40” of rain following the application, which should have integrated the nitrogen into the soil to be plant available.
Weekly scouting of the DATA Farm crops in July did not show any significant insect or disease pressures. During June scouting trips, heavy aphid pressure was observed in the cotton crops, but their population crashed due to a naturally occurring fungus. The signs of aphids diminished during early July crop scouting. During July, a large population of mature pigweed was observed in North Pivot. These weeds were past the growth stage for control when the direct spray of Liberty was applied. Unfortunately, these mature pigweeds are beyond normal control methods. To address this situation, the tillage plan for the 2026 season will be altered. In this field, we will perform a deep turn to bury the seed bank before running the ripper/bedder to plant peanuts. In South Pivot, grasses were developing in several areas of the field, so an application of Clethodim (8 oz/ac) was made. Late-season grass-type weeds can cause issues when inverting the peanuts for harvest.
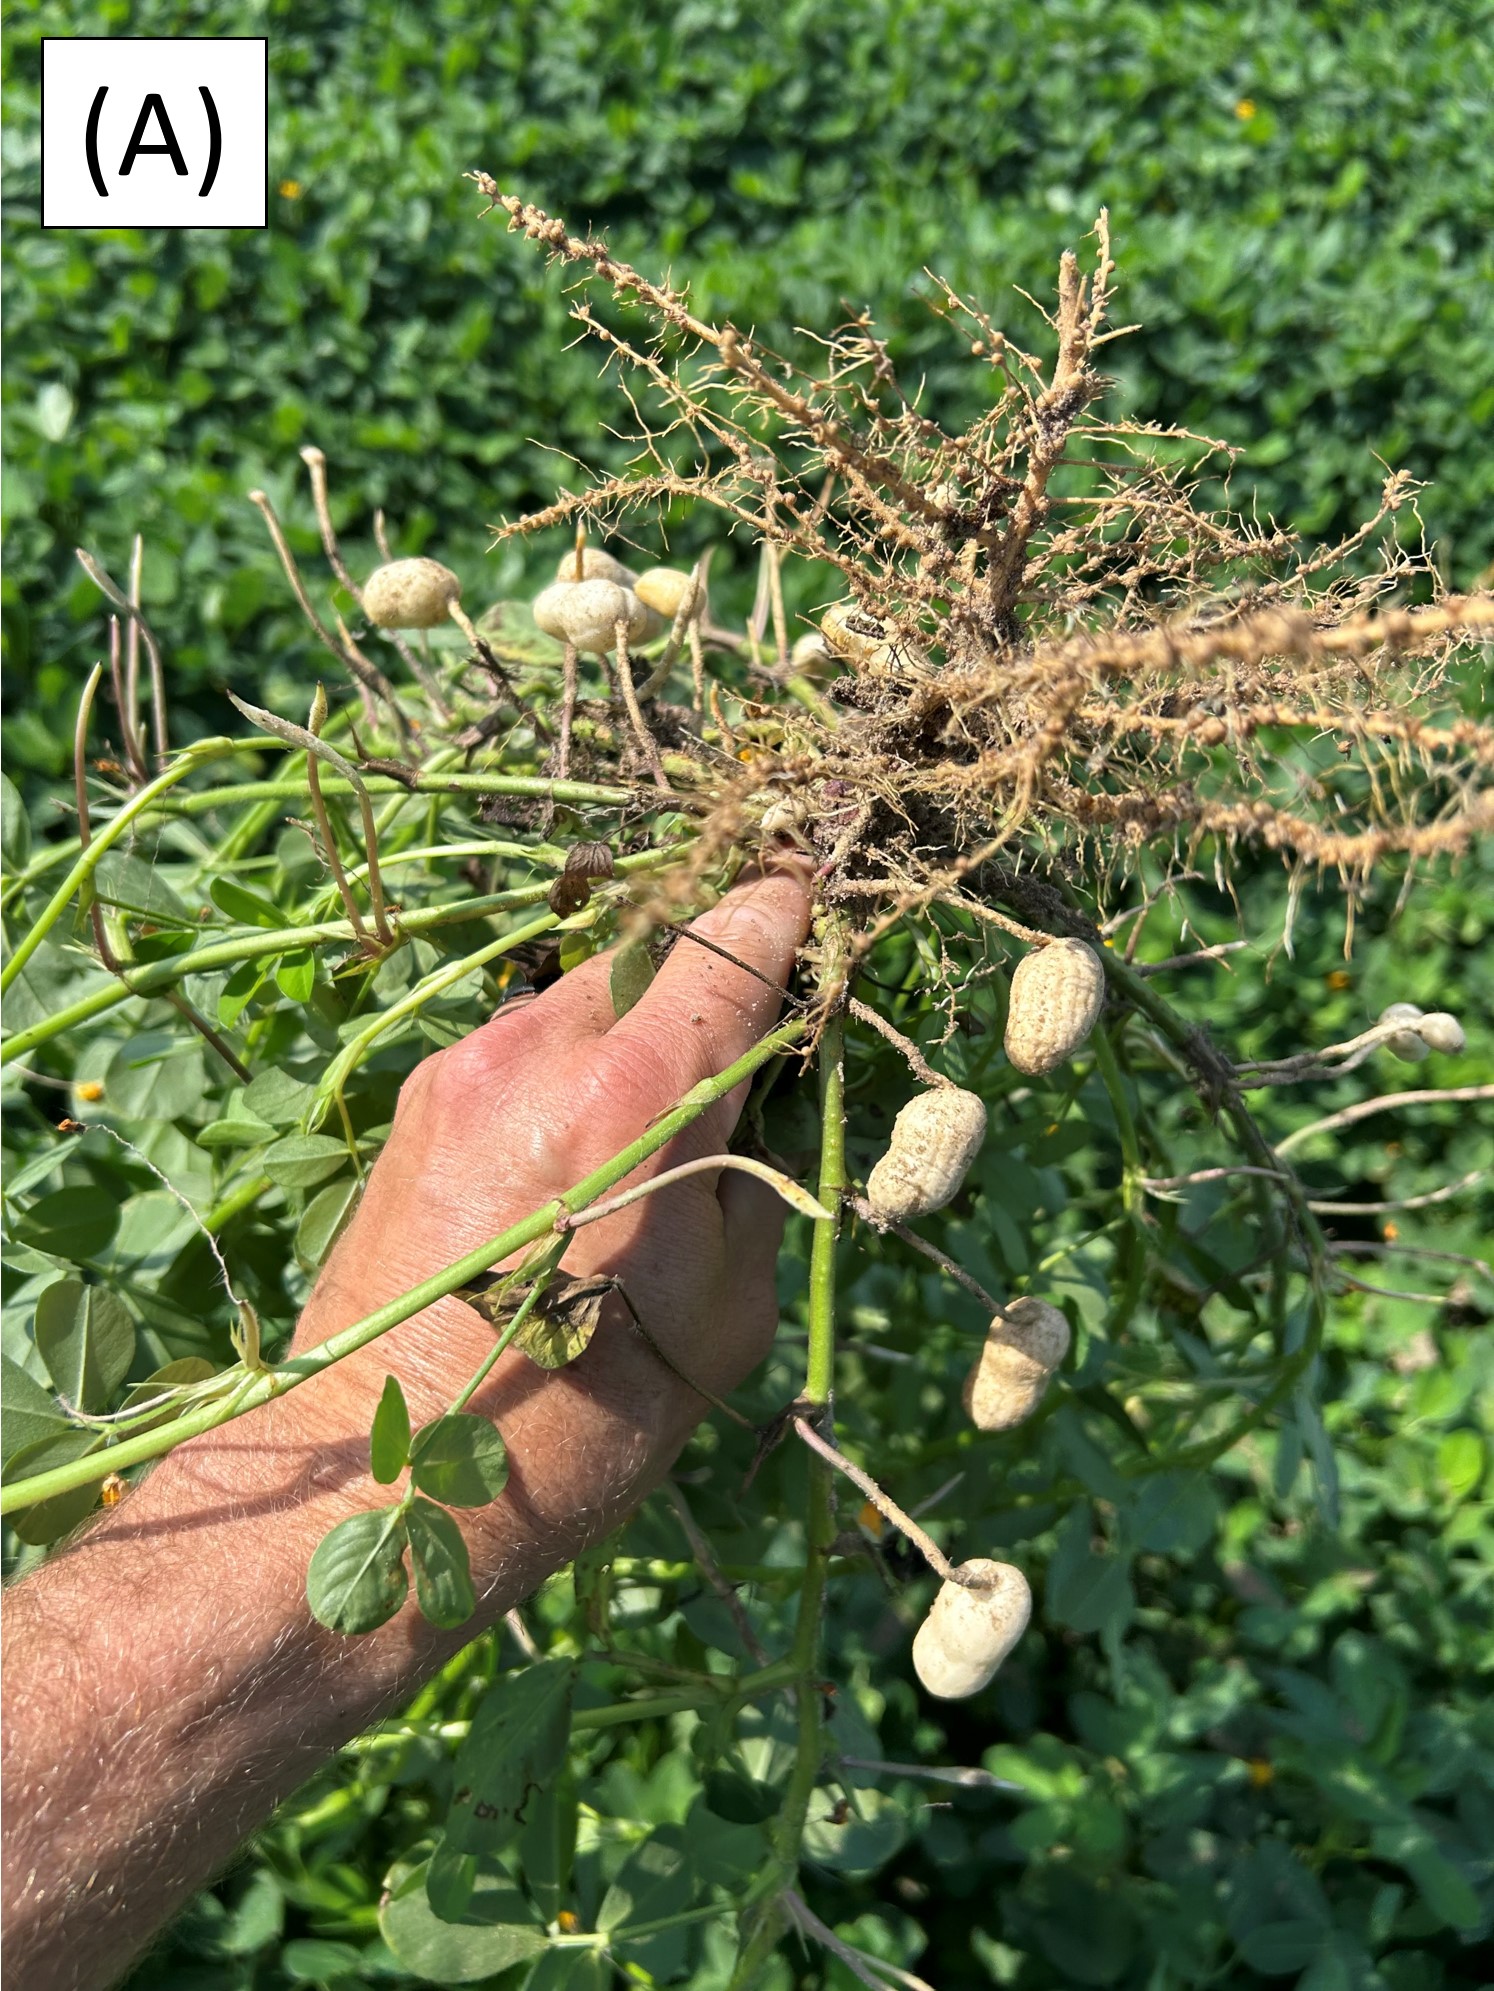
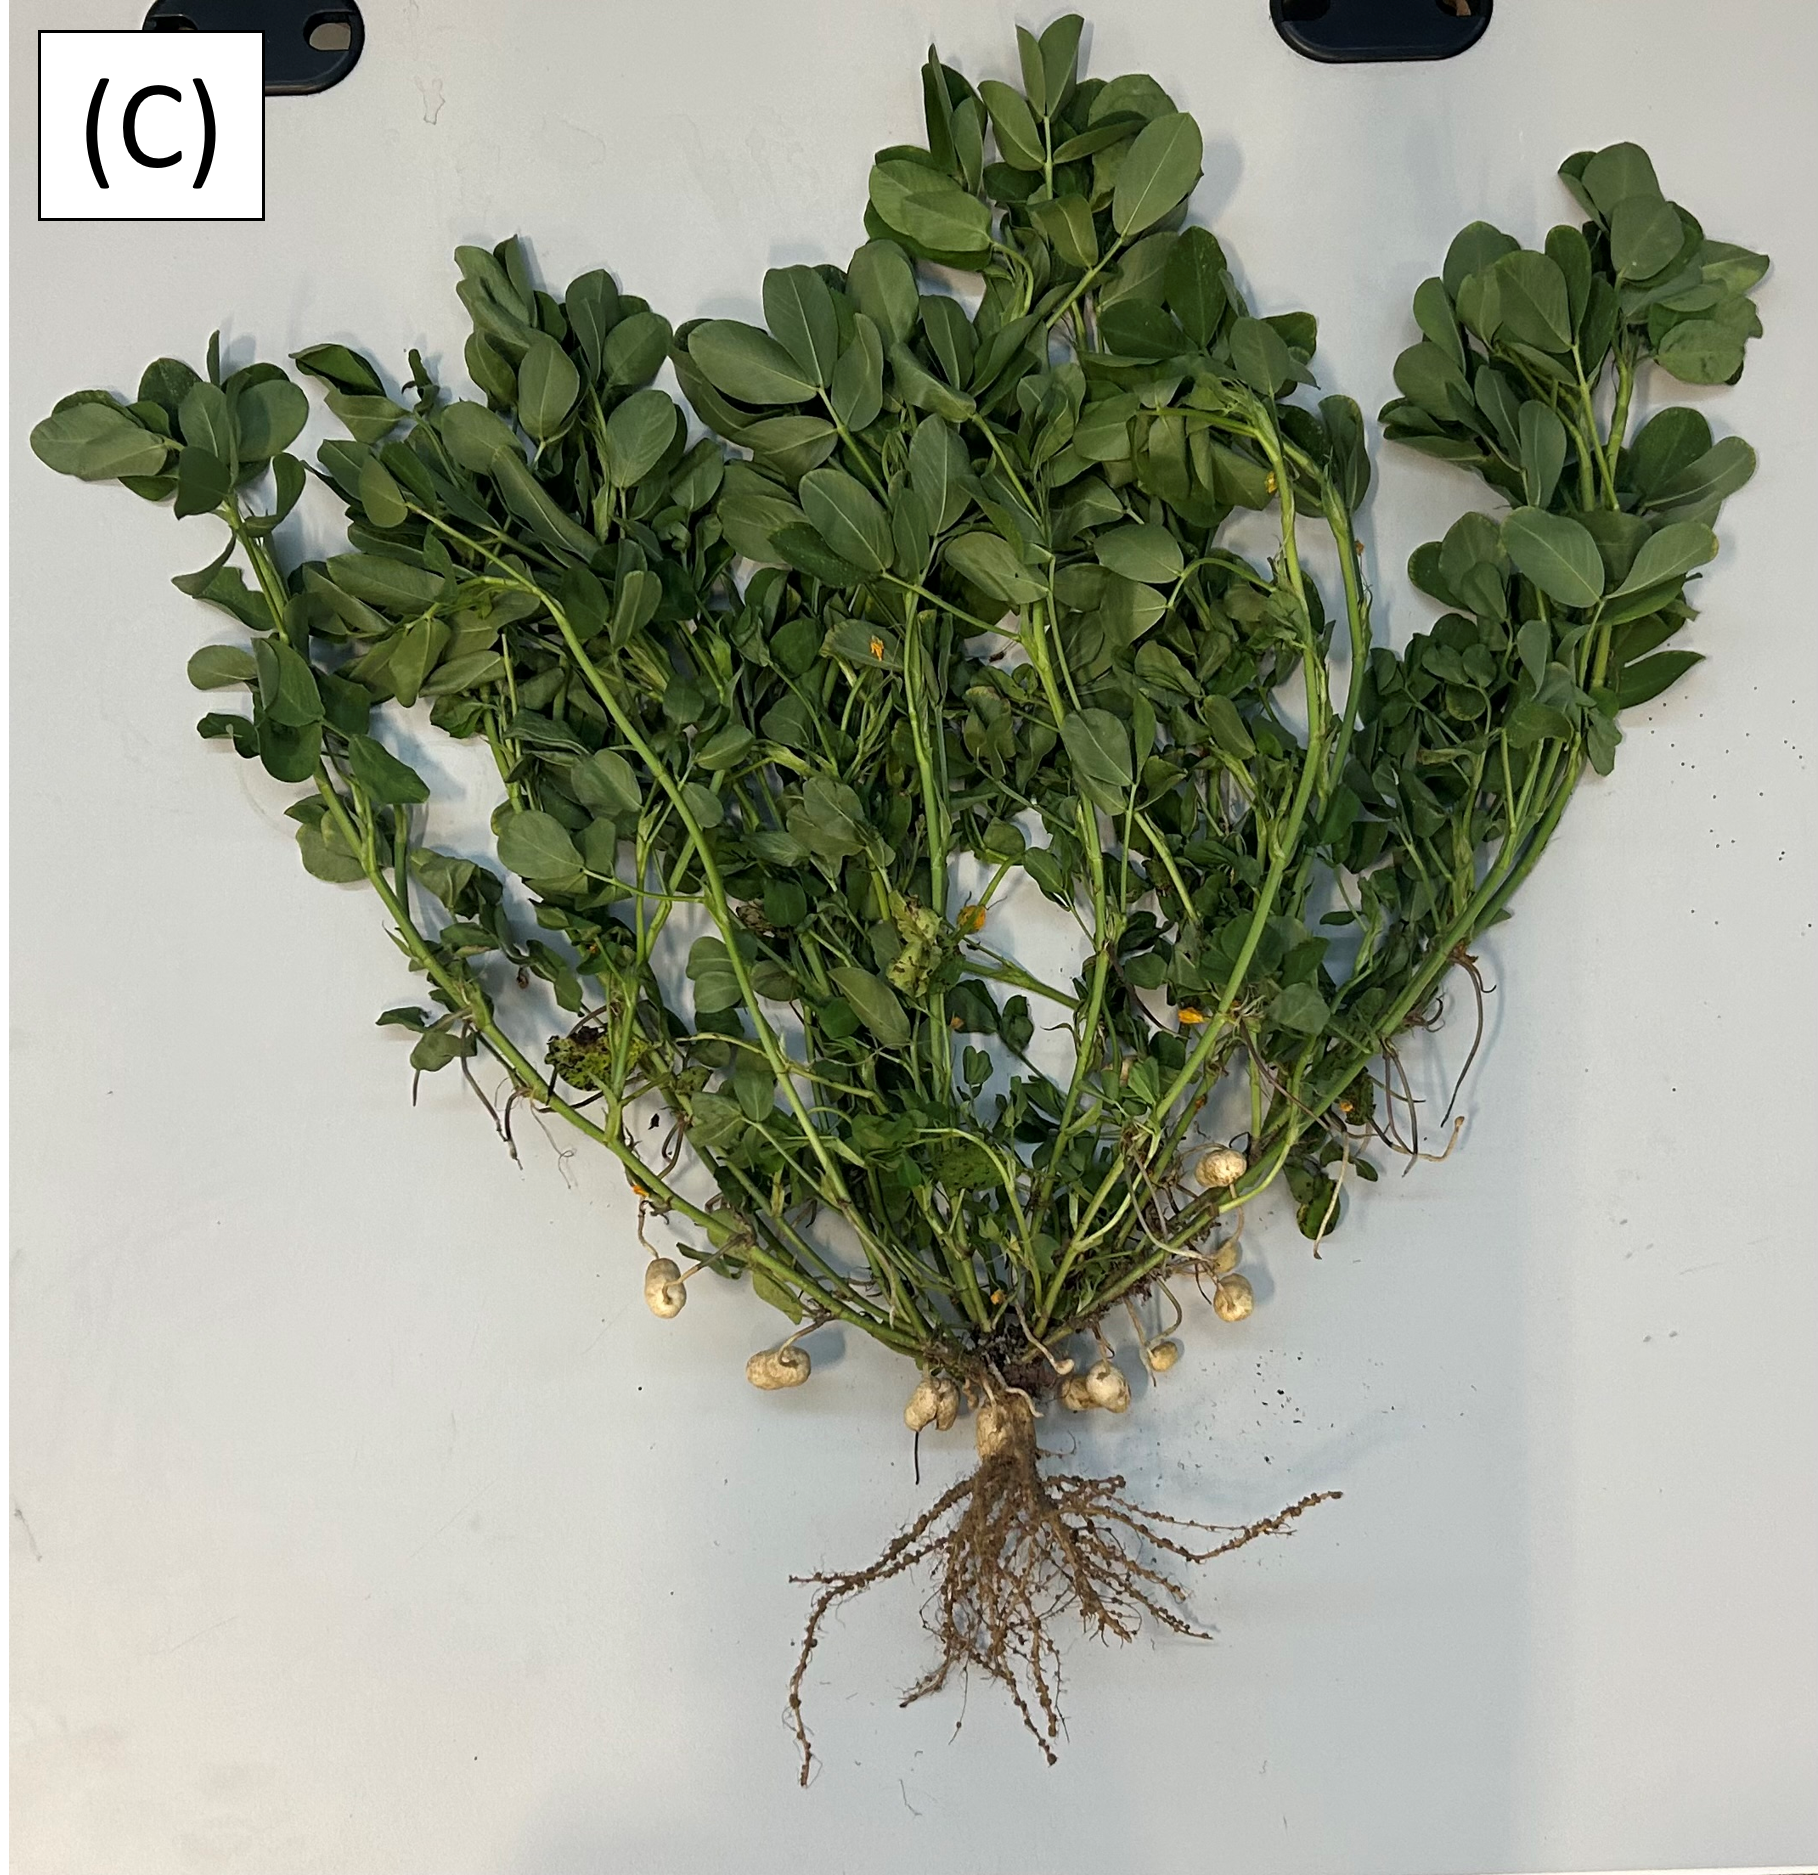
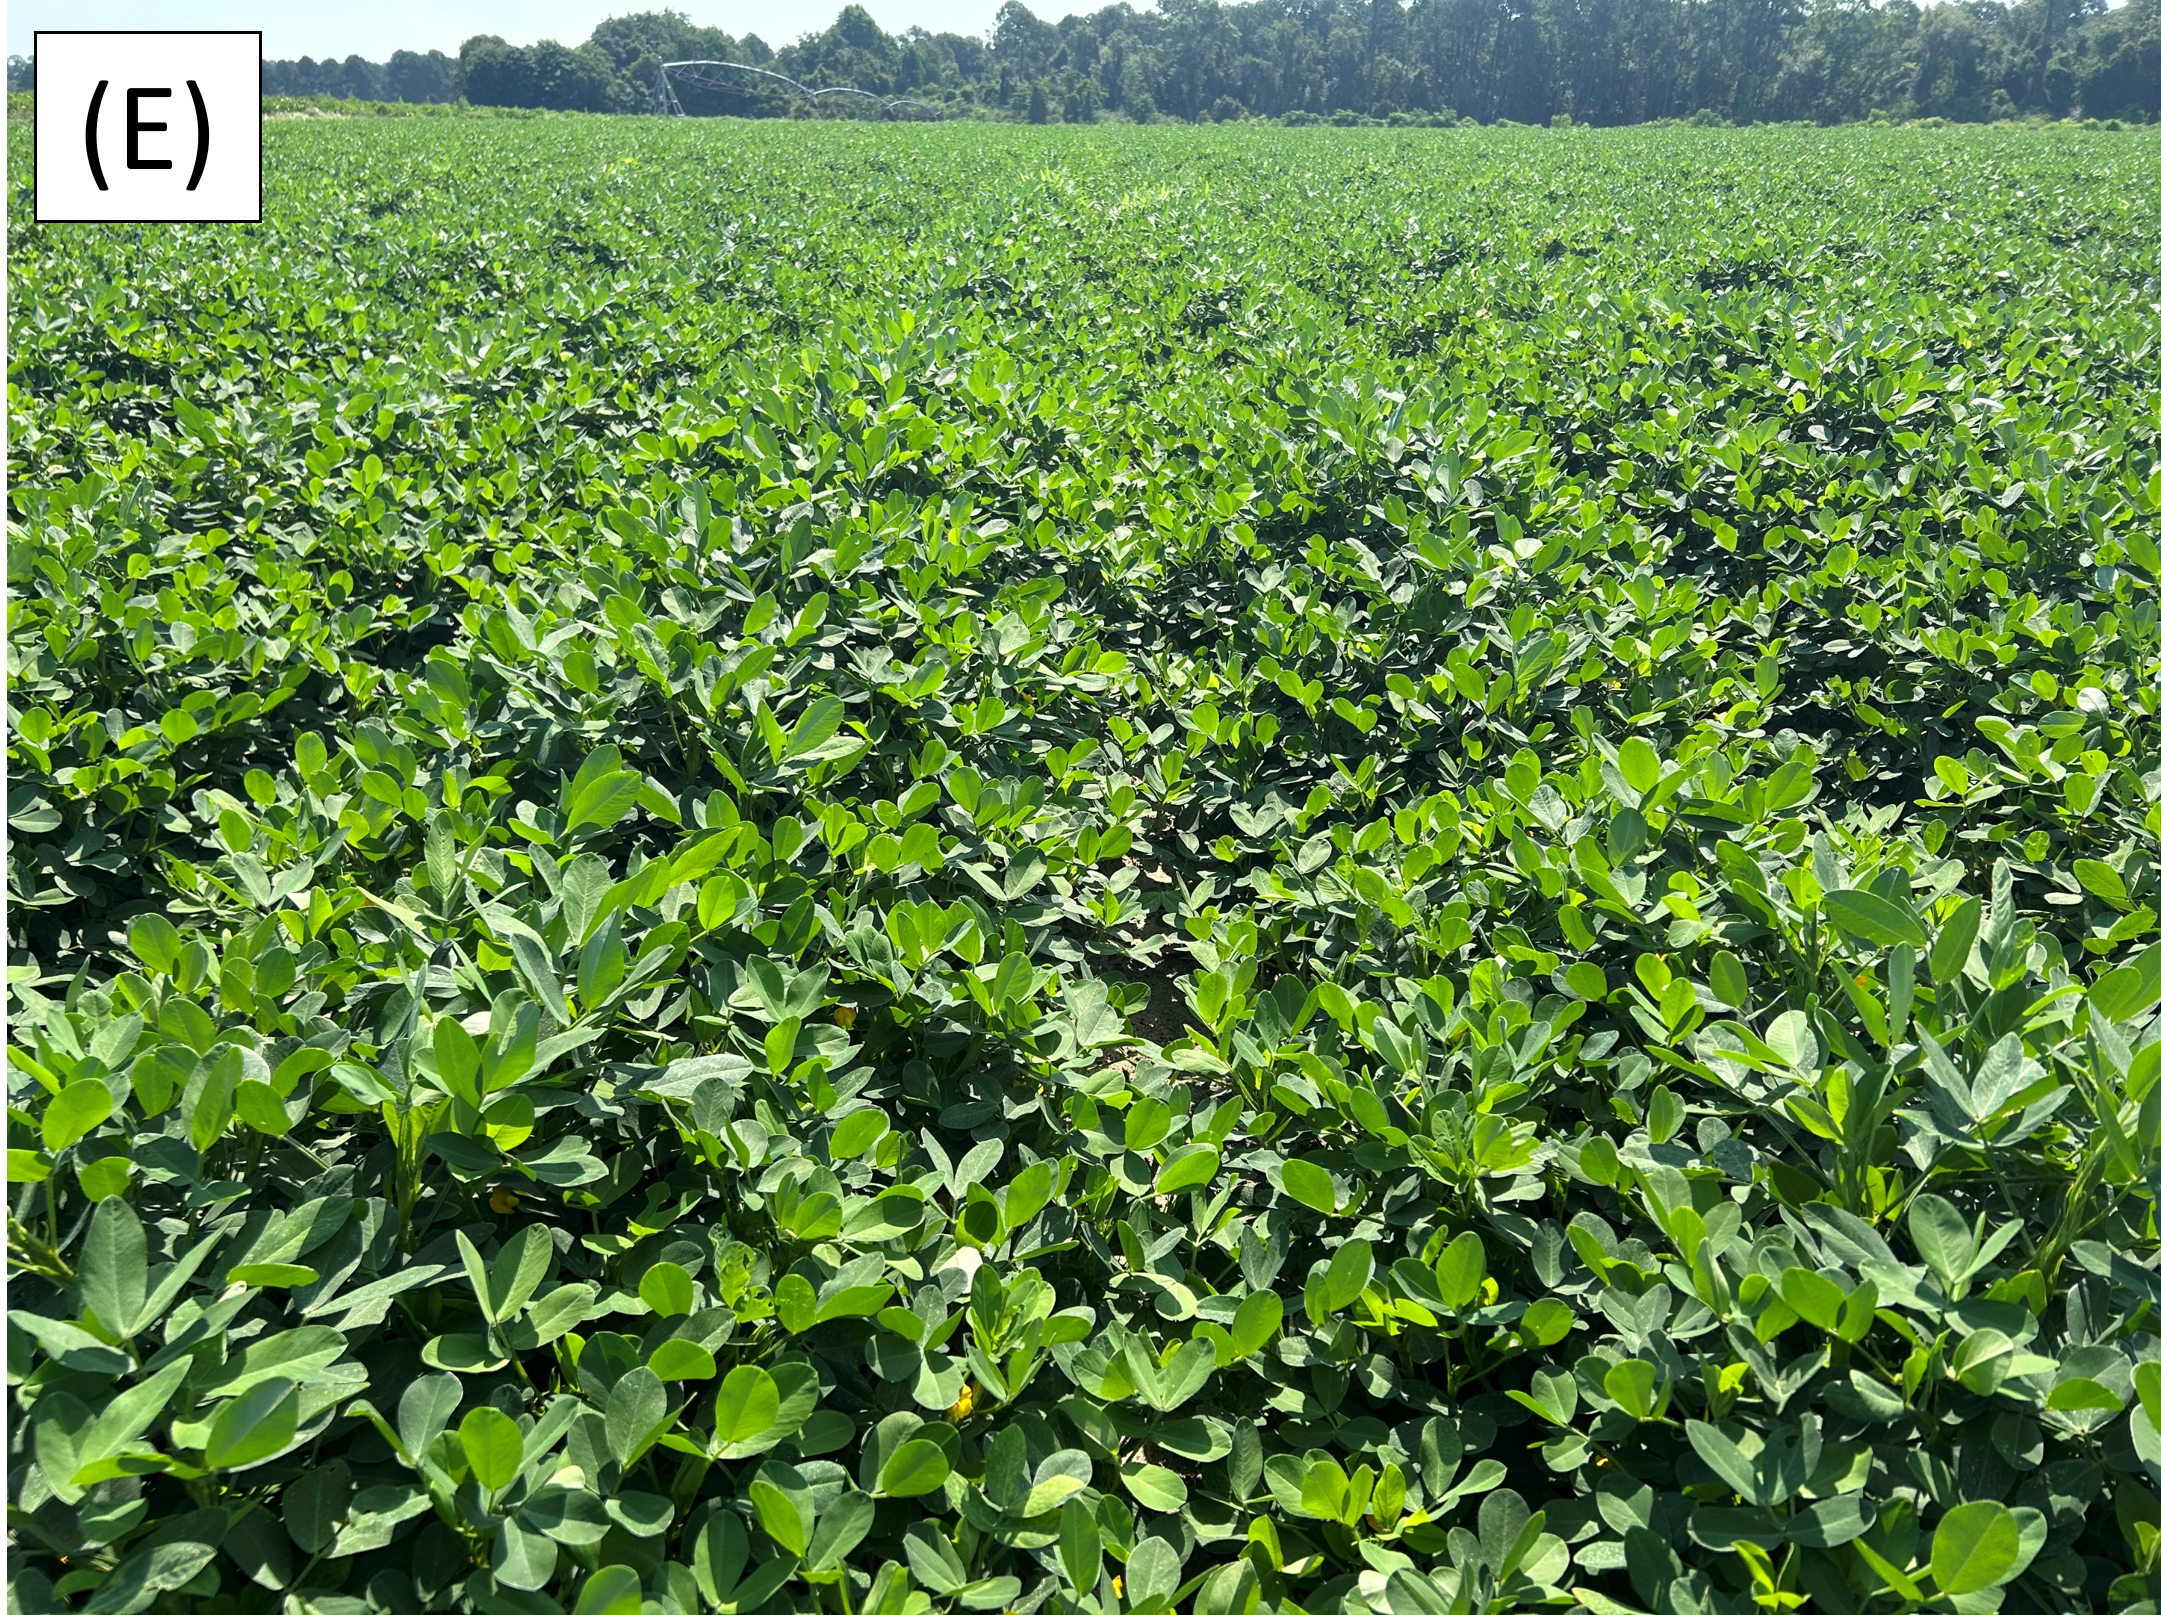
The peanuts in South Pivot started pod development during July, and a sample plant was pulled on July 22nd. Figure 3A shows pegs forming and the pods developing from older pegs. A pod was opened to check seed development and is shown in Figure 3B. Figure 3C is an image of the entire plant to show the roots, pegs, pods, stems, and leaves. In addition to the development of pods, the root system of this plant shows extensive nodulation (Figure 3D). This is a sign that symbiosis with rhizobium soil bacteria is occurring, an indication of a healthy plant. The peanuts are developing wide vines and lapped the row-middles during the month across most of the field as seen in Figure 3E.
The 45-day fungicide application (Lucento 5.5 oz/ac) was made on 7/7/25 with a liquid 10% boron product added to the tank mix to make the first recommended 0.25 lb/ac application of boron. On 7/15/25 the 60-day fungicide application (Chlorothalonil 24 oz/ac and Convoy 32 oz/ac) was made with the addition of liquid 10% boron (0.25 lb/ac) to fulfill the remaining boron needs. Also on that day, a late post-emerge herbicide treatment of Dual Magnum (16 oz/ac) was applied. The final field operation for the month of July was the 75-day fungicide application.
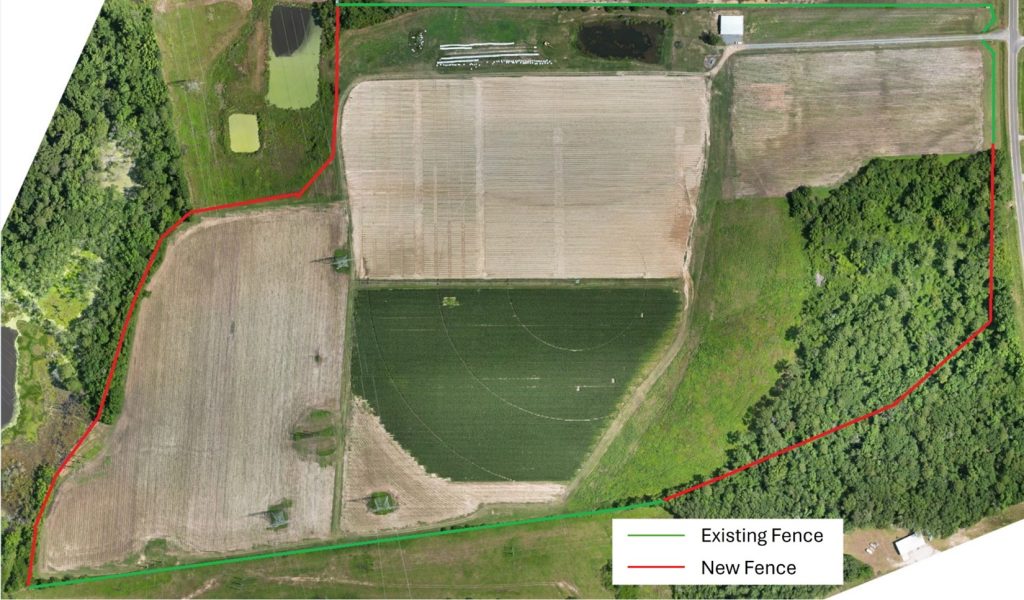
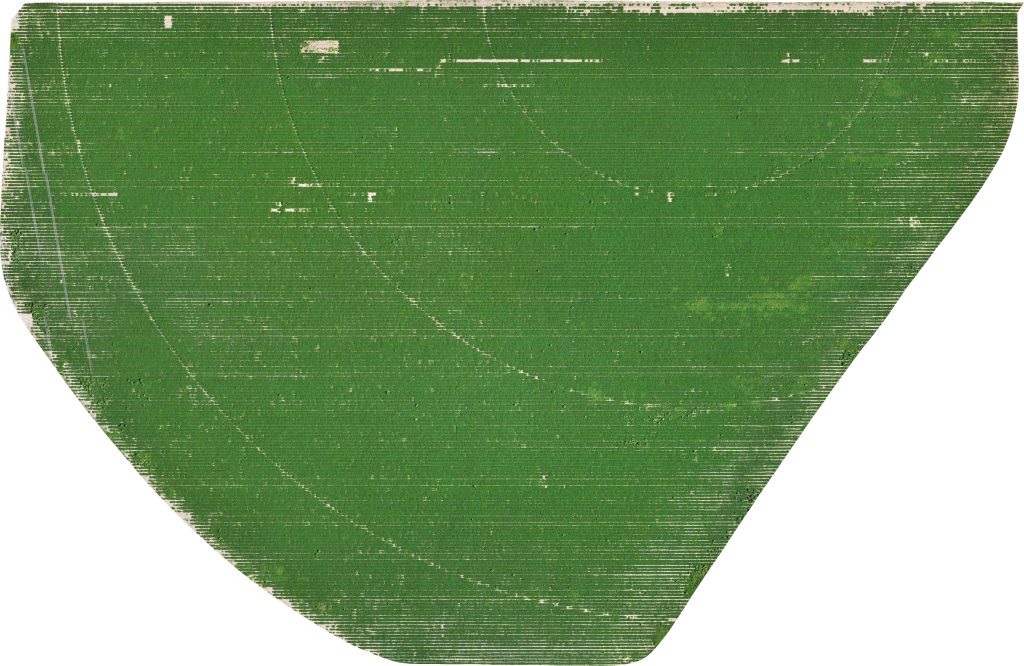
A contractor started work in mid-July to finish the DATA Farm’s perimeter fence. Figure 4 shows an aerial map of the full DATA Farm property with markups for the existing fence sections (green lines) and the new fence path (red lines). A complete perimeter fence is necessary for the introduction of livestock after harvest for winter grazing. Dr. Tucker’s team intends to utilize GPS collars to contain the cows within fields for controlled grazing. The perimeter fence serves as a backup in case of equipment failure, preventing the cows from escaping the property.
The monthly temperature trends and rainfall recorded by the on-site weather station for July are shown in Figure 5.
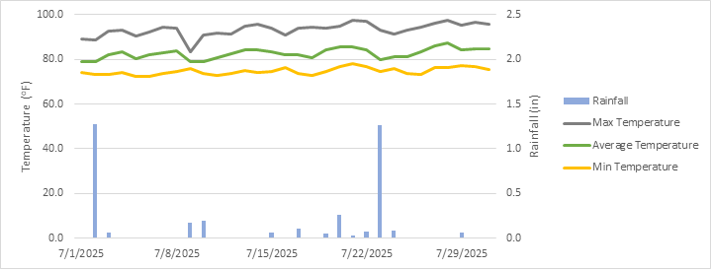
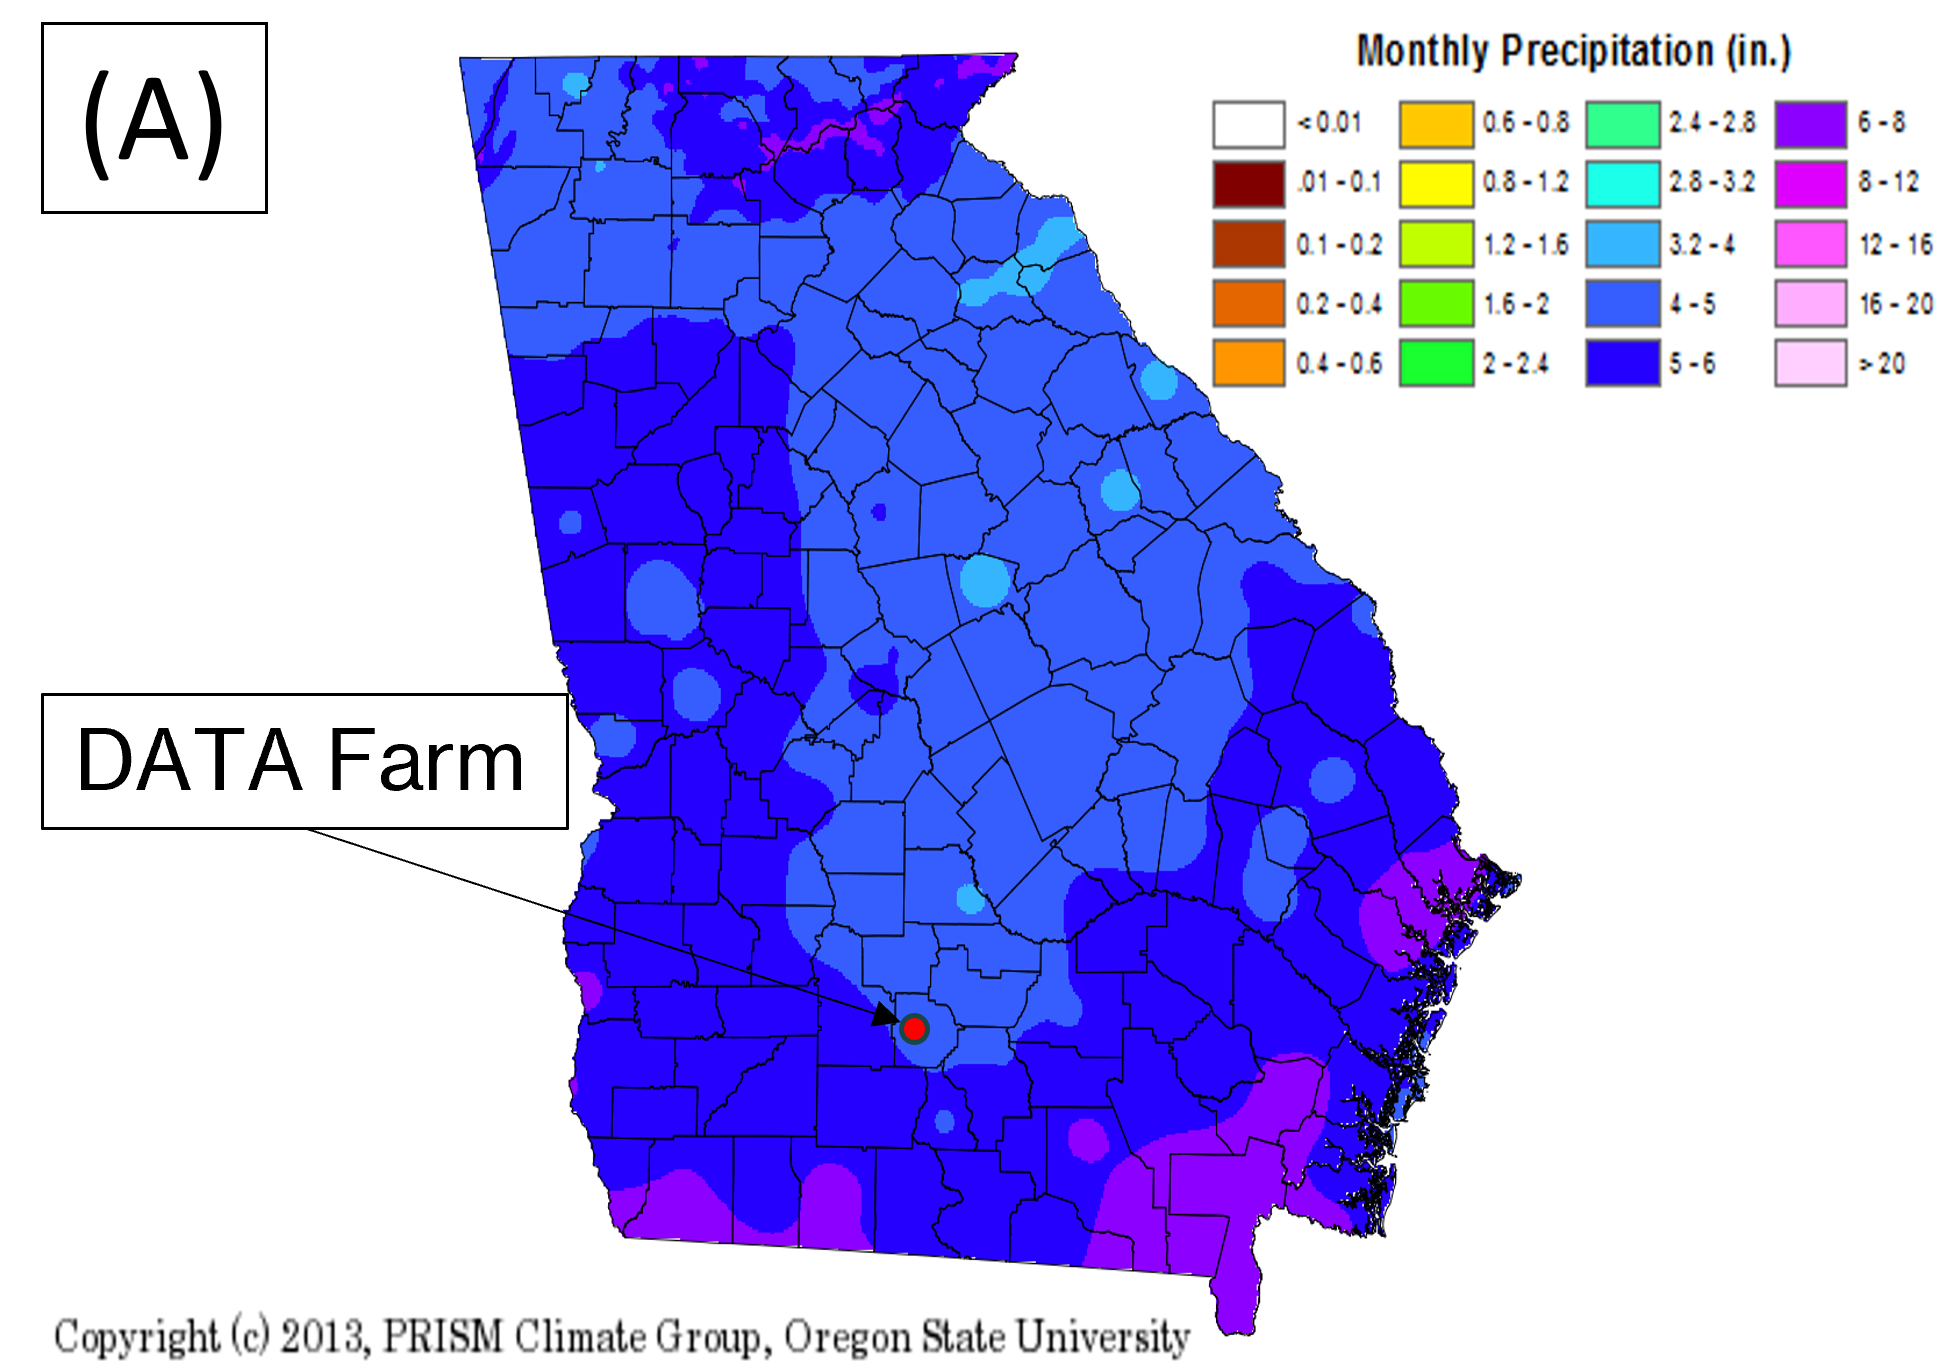
For comparison, Georgia climate maps based on data from 1981 to 2010 (UGA’s Weather Network) are shown in Figure 6 for the month of July for historical reference. The 3.75 inches of rainfall recorded at the DATA Farm during July was below the average (4 to 5 inches) for this period. Two heavy rainfall events (1.26” and 1.22”) occurred during the month spaced out by three weeks with smaller rain events (<0.15”) in between. During this three-week period, the soil moisture sensors in South Pivot hit the weighted average trigger point for irrigation twice. During both events 0.75” of irrigation water was applied to the peanuts in South Pivot.
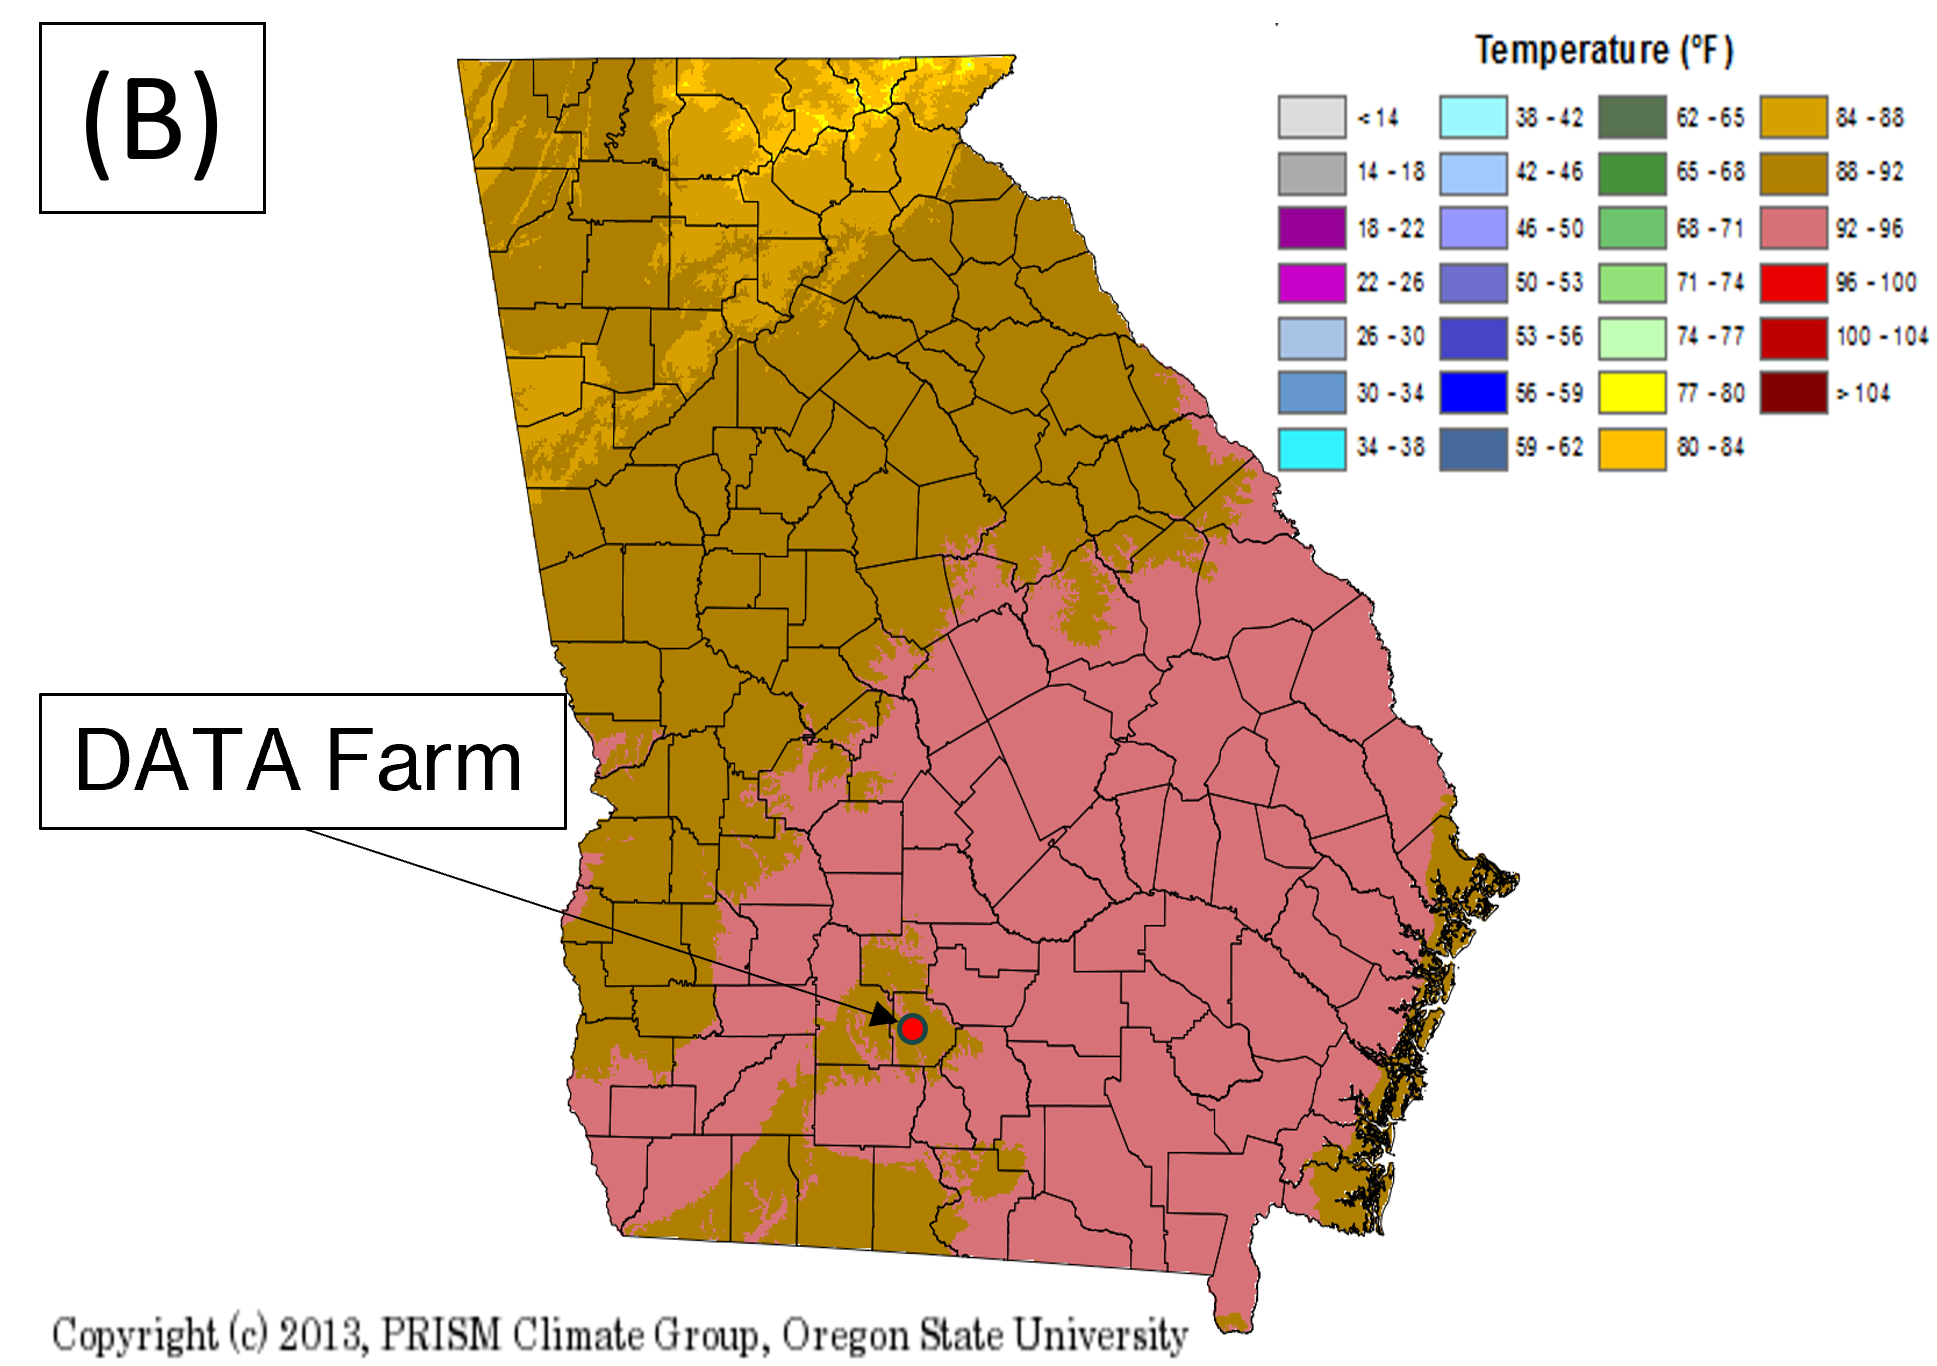
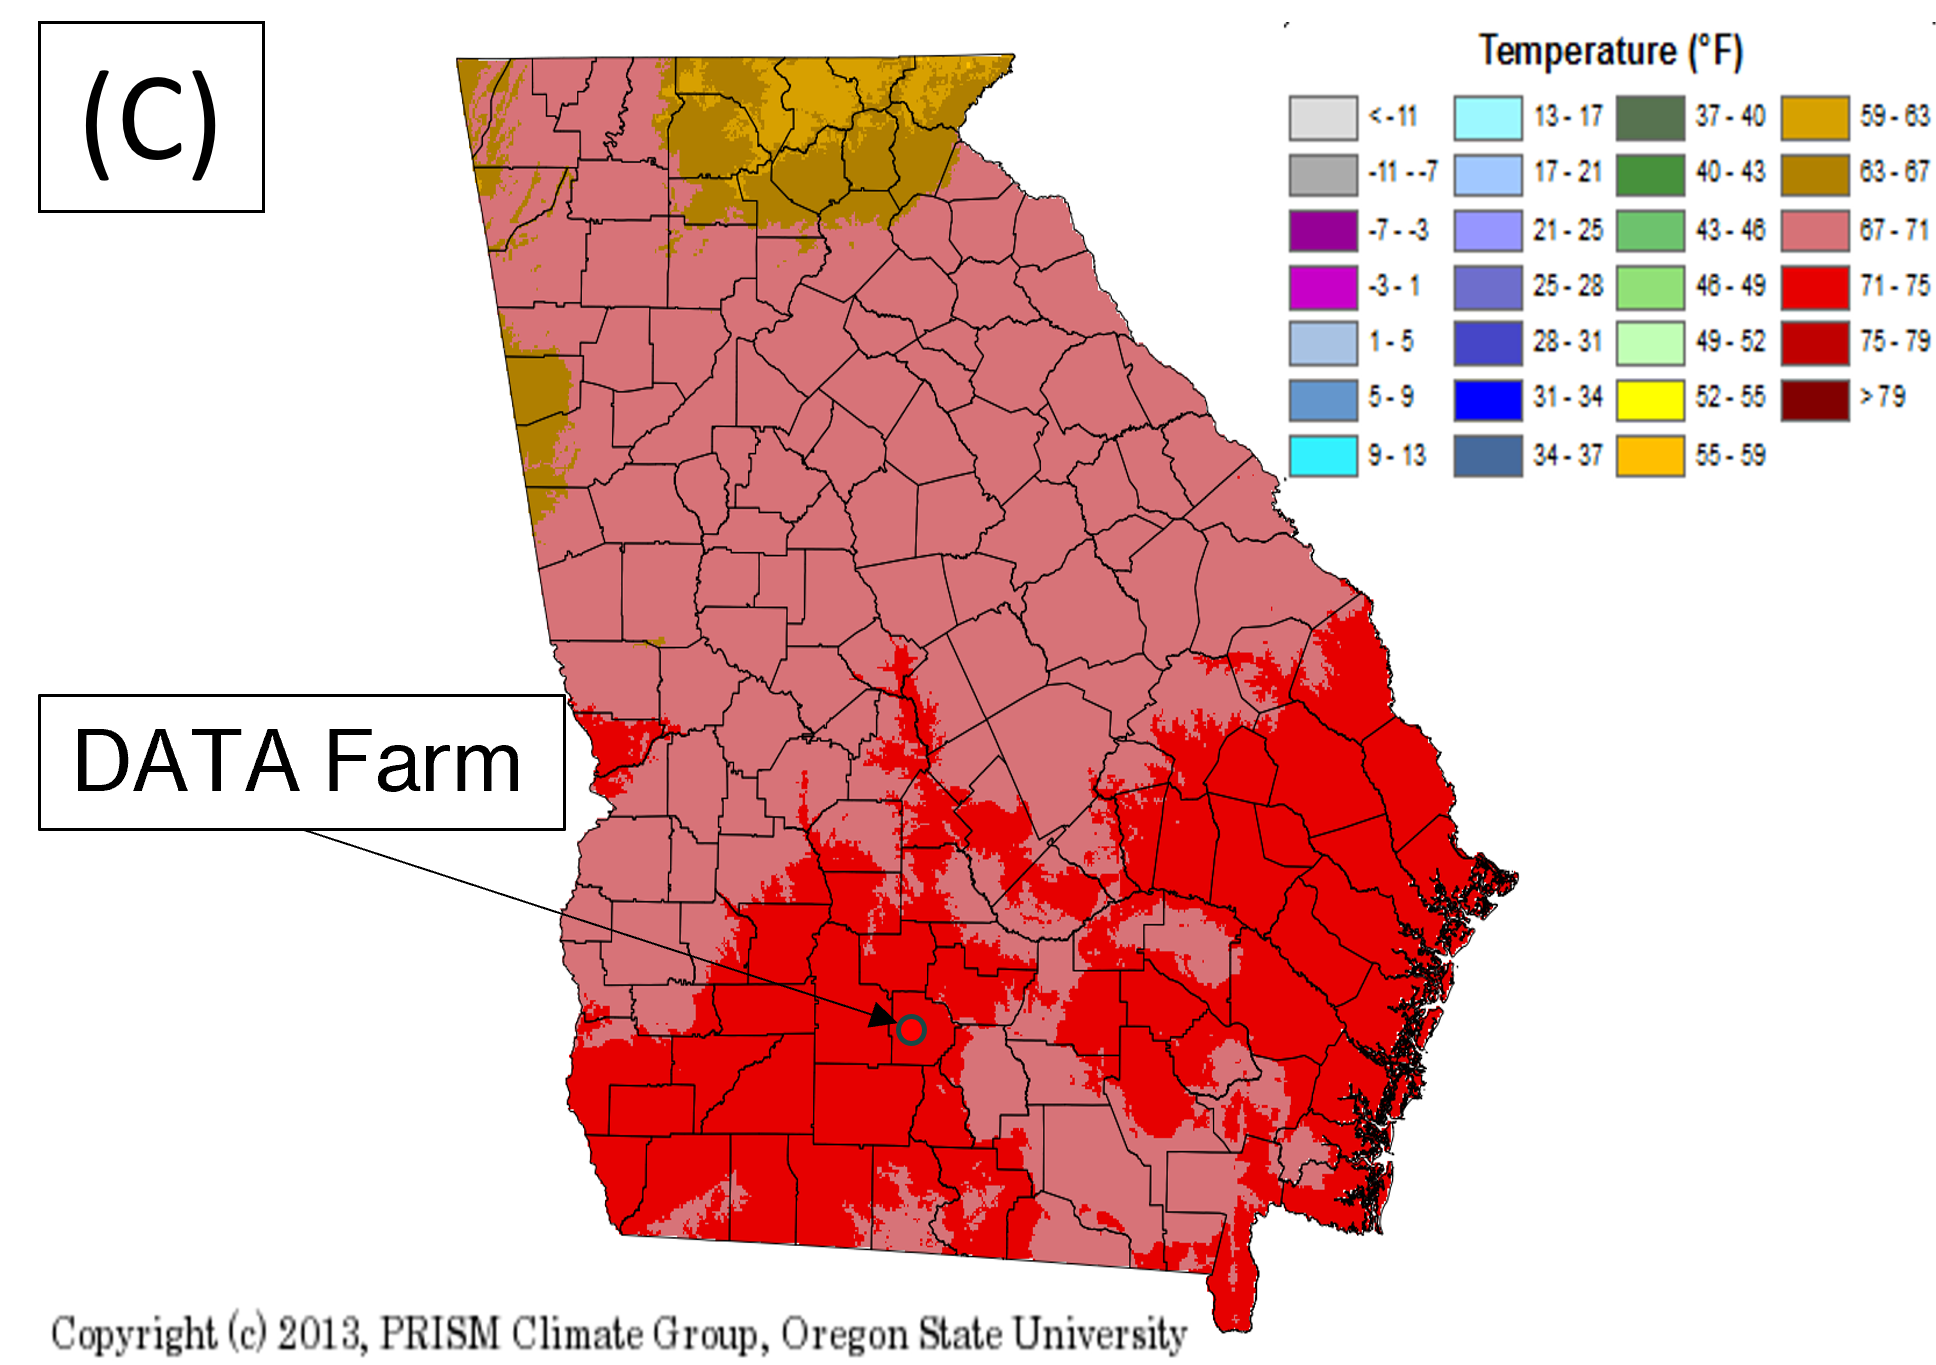
The average of recorded maximum temperatures for the month was 94°F, which is above the average historical range of 88°F – 92°F (Figure 6B), and the average of recorded minimum temperatures was 75°F, which is on the top end of the average historical range of 71°F – 75°F (Figure 6C). As a whole, July was a little hotter and drier than average, though not by much. However, the distributed rainfall events kept humidity high, preventing max temperatures from rising over 100°F.
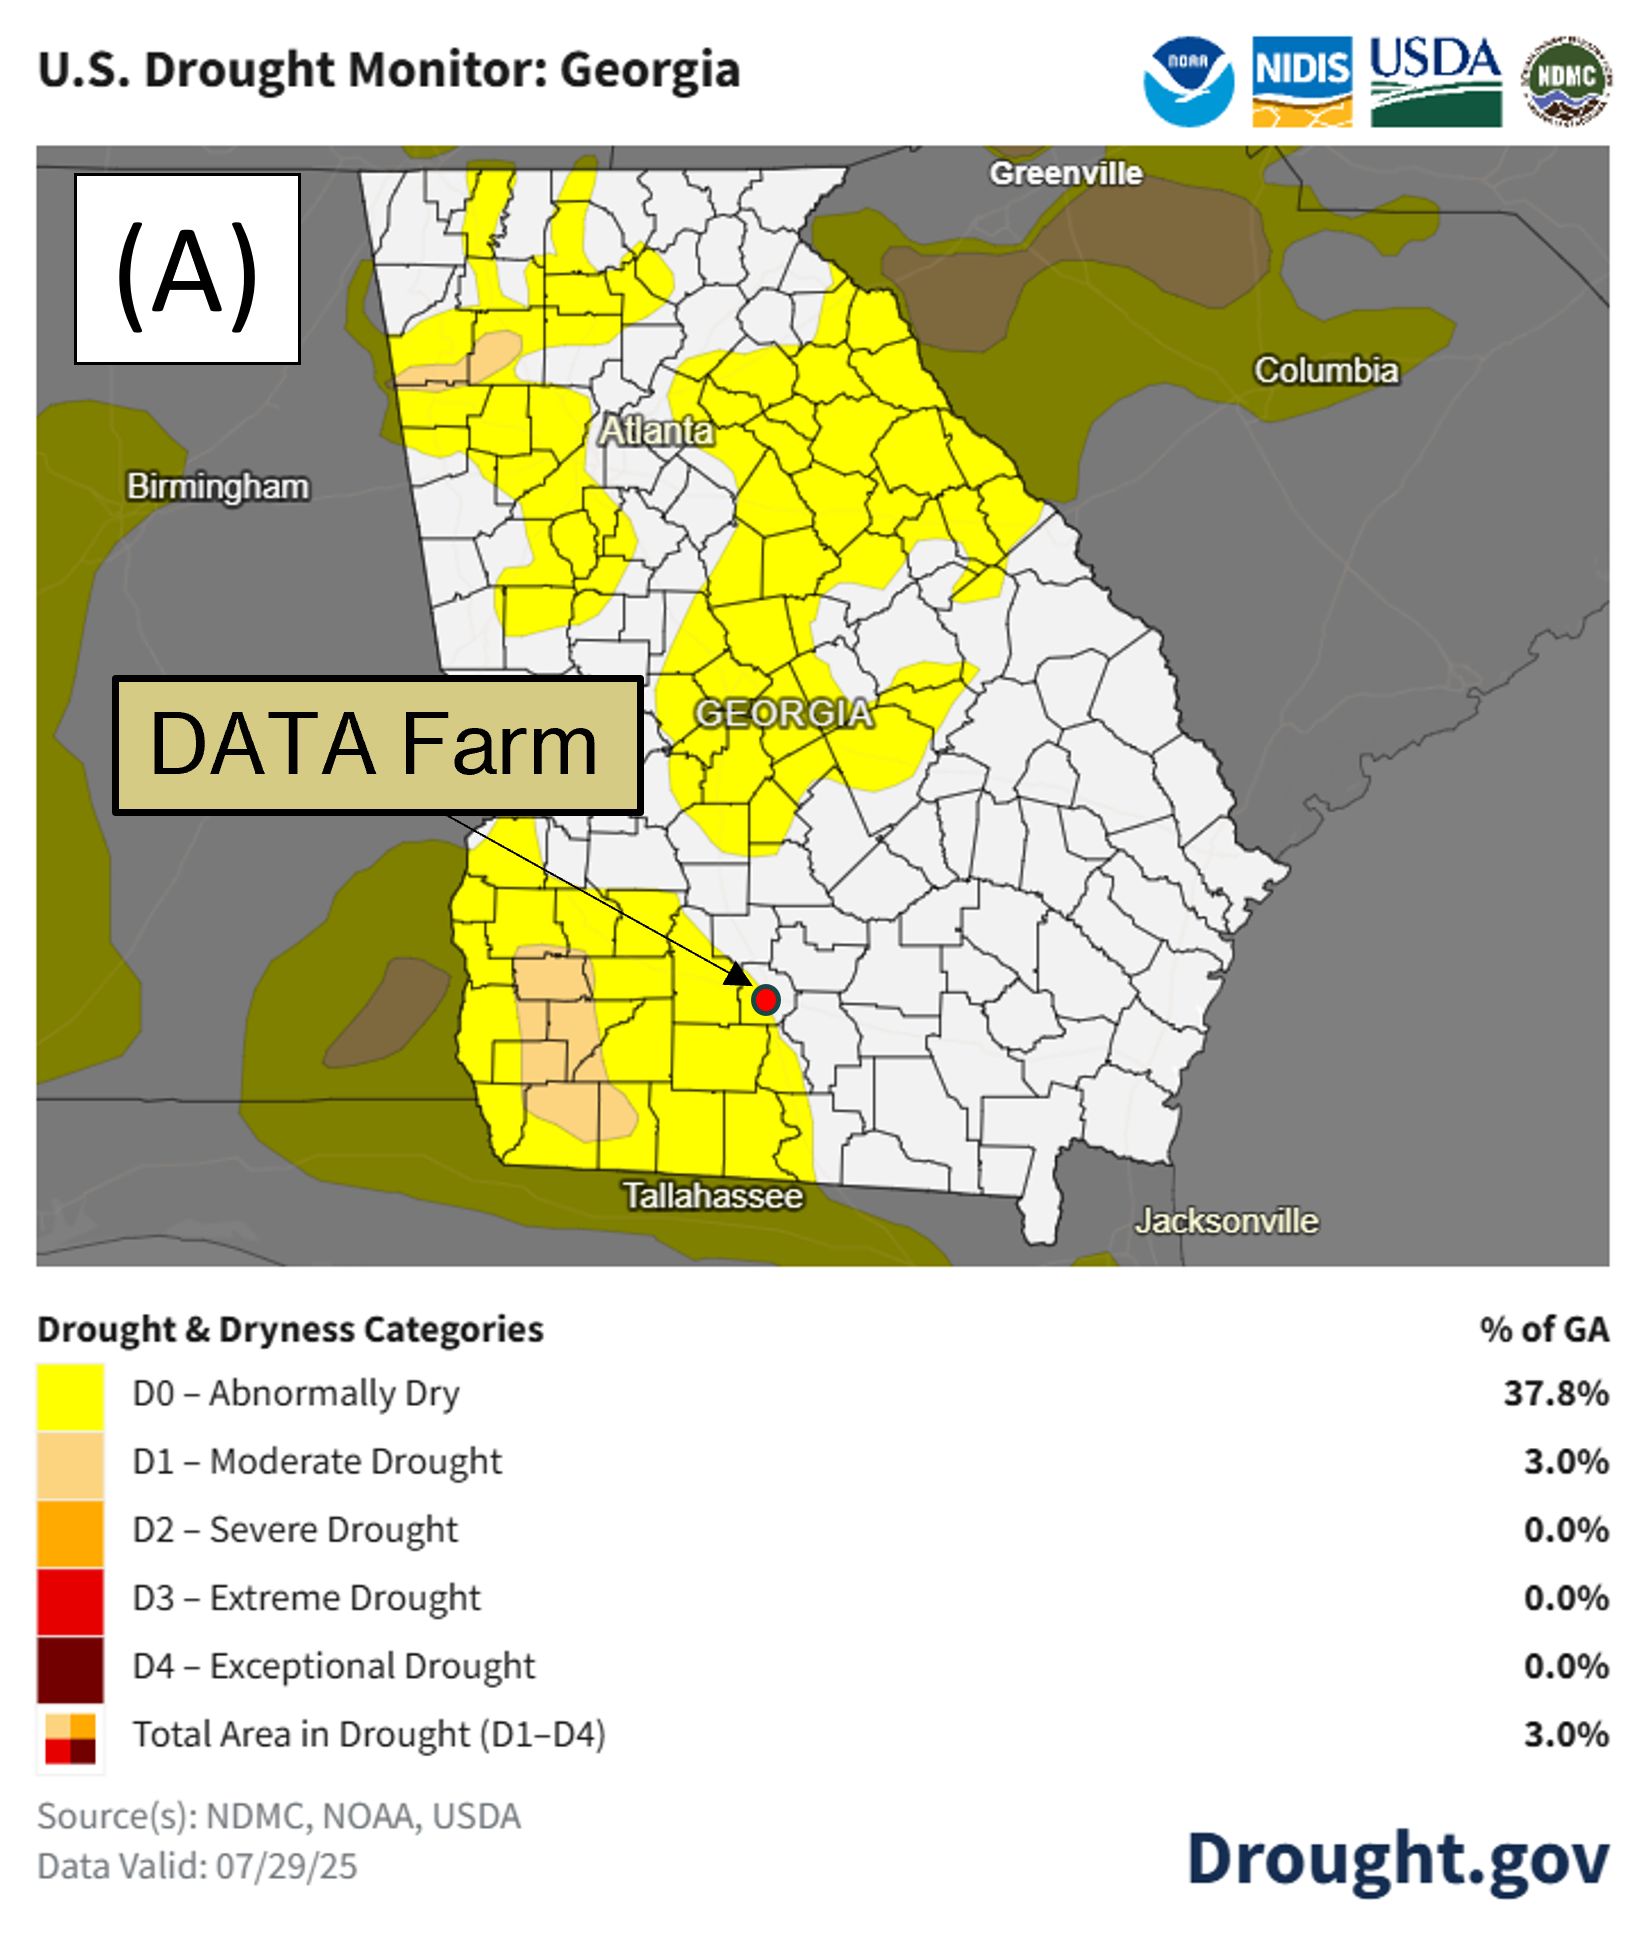
Figure 7A shows the drought monitor map as of July 29th, from the National Integrated Drought Information System for Georgia. Abnormally dry conditions are present in 37.8% of the state, with 3.0% of the state experiencing moderate drought conditions. Figure 7B shows Tift County is split, with 42.17% experiencing abnormally dry conditions and the rest of the county not experiencing any drought or dry conditions. The 4D Farm is located right outside the area experiencing dry conditions. Based on this, it appears that the farm was trending towards drier conditions toward the end of the month.
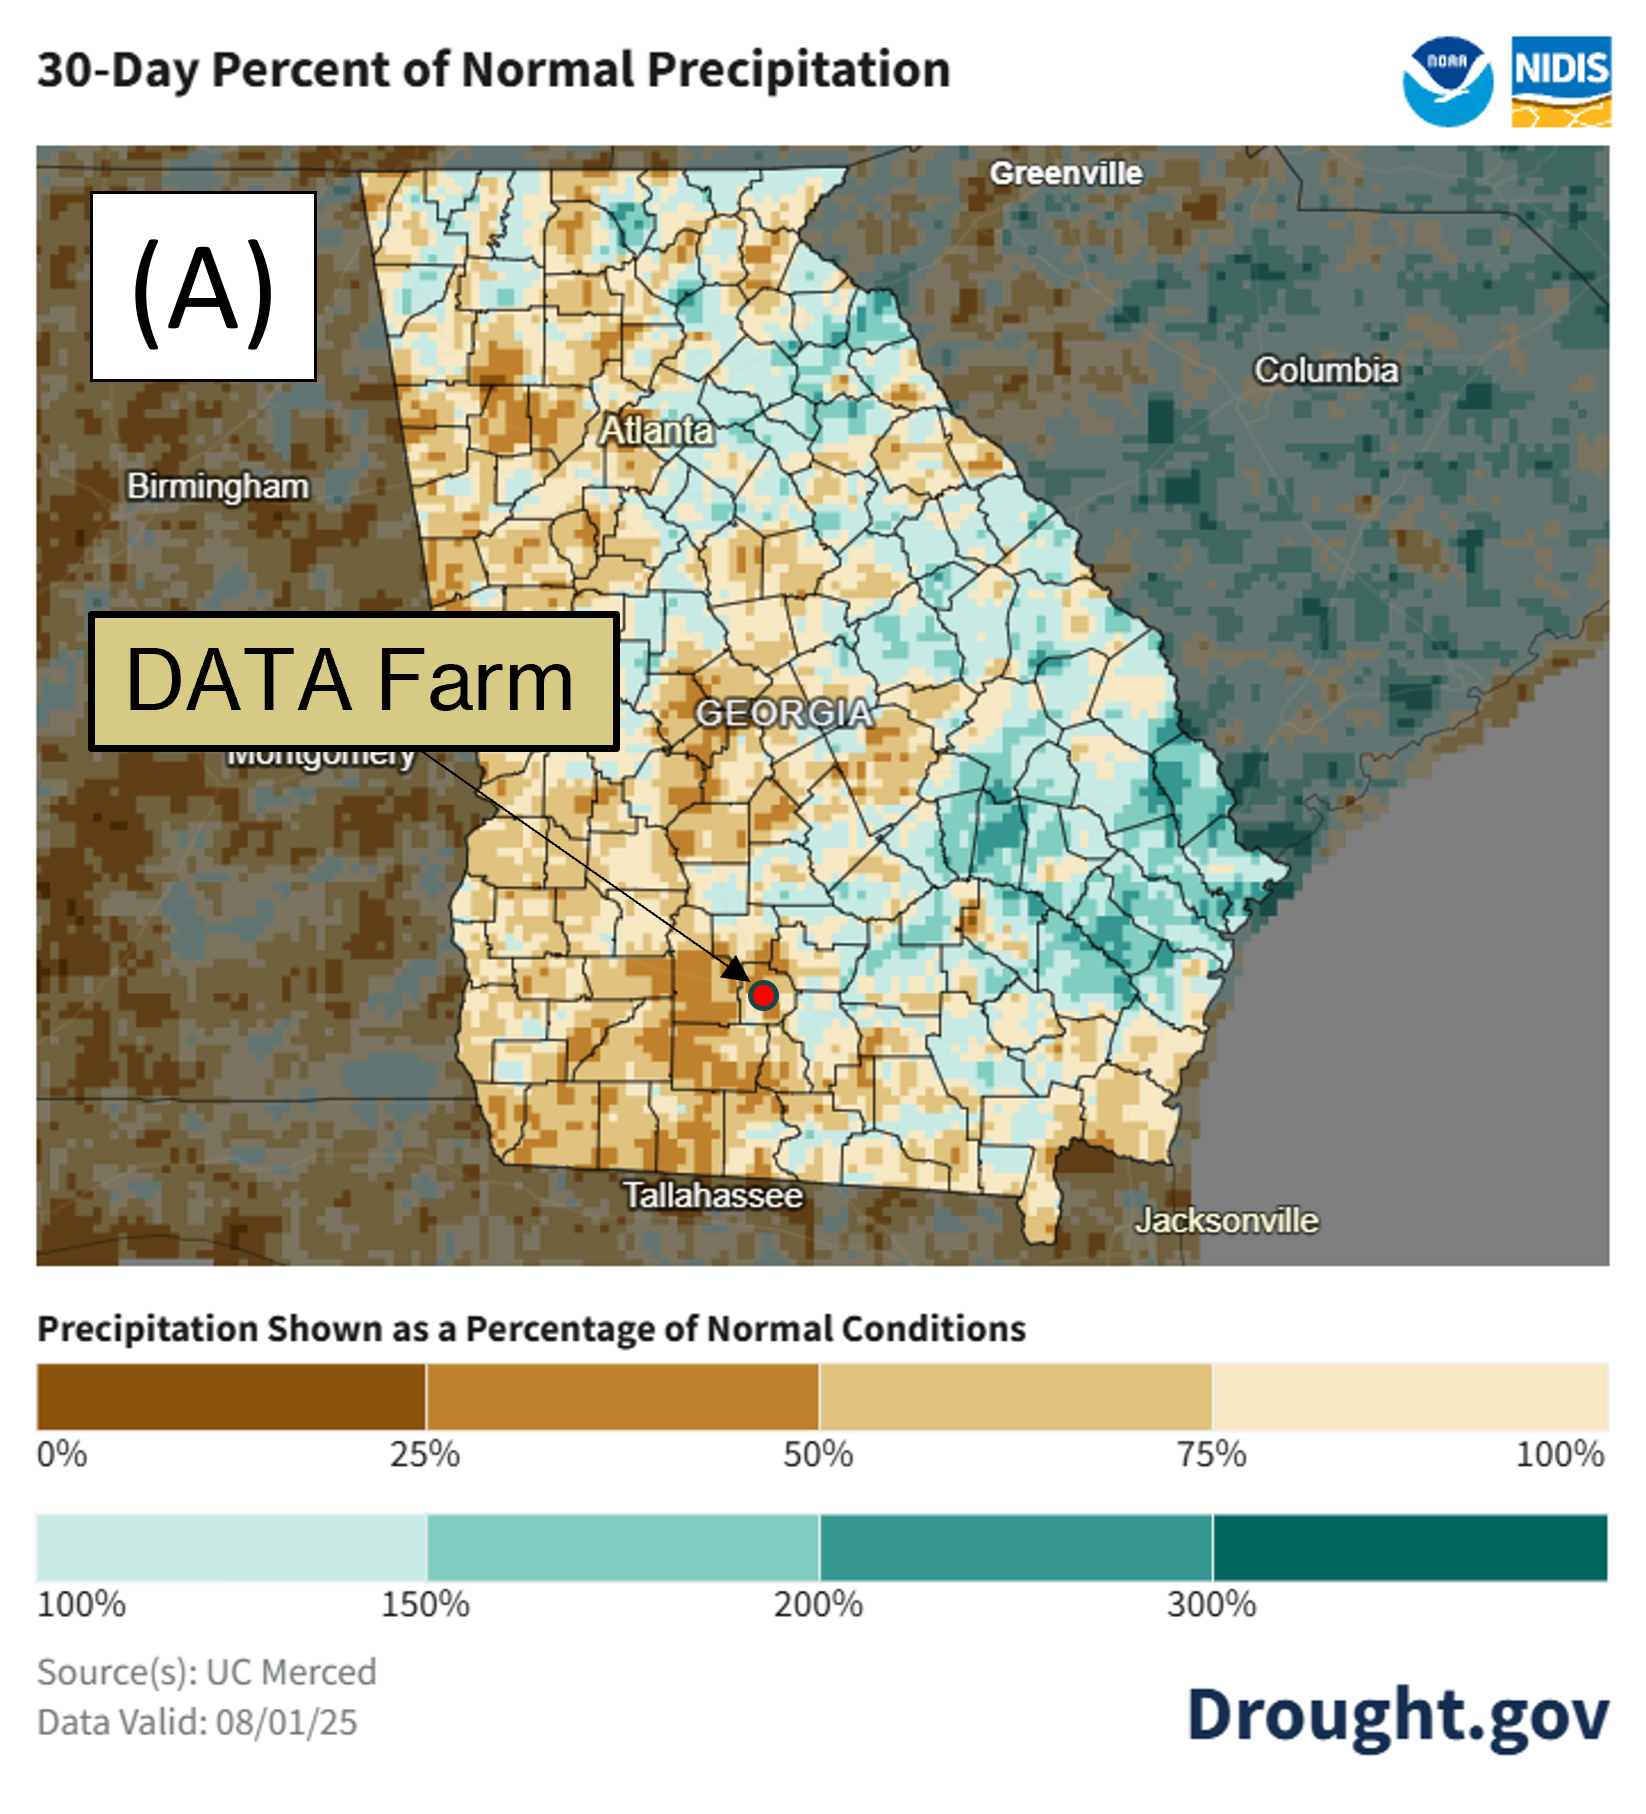
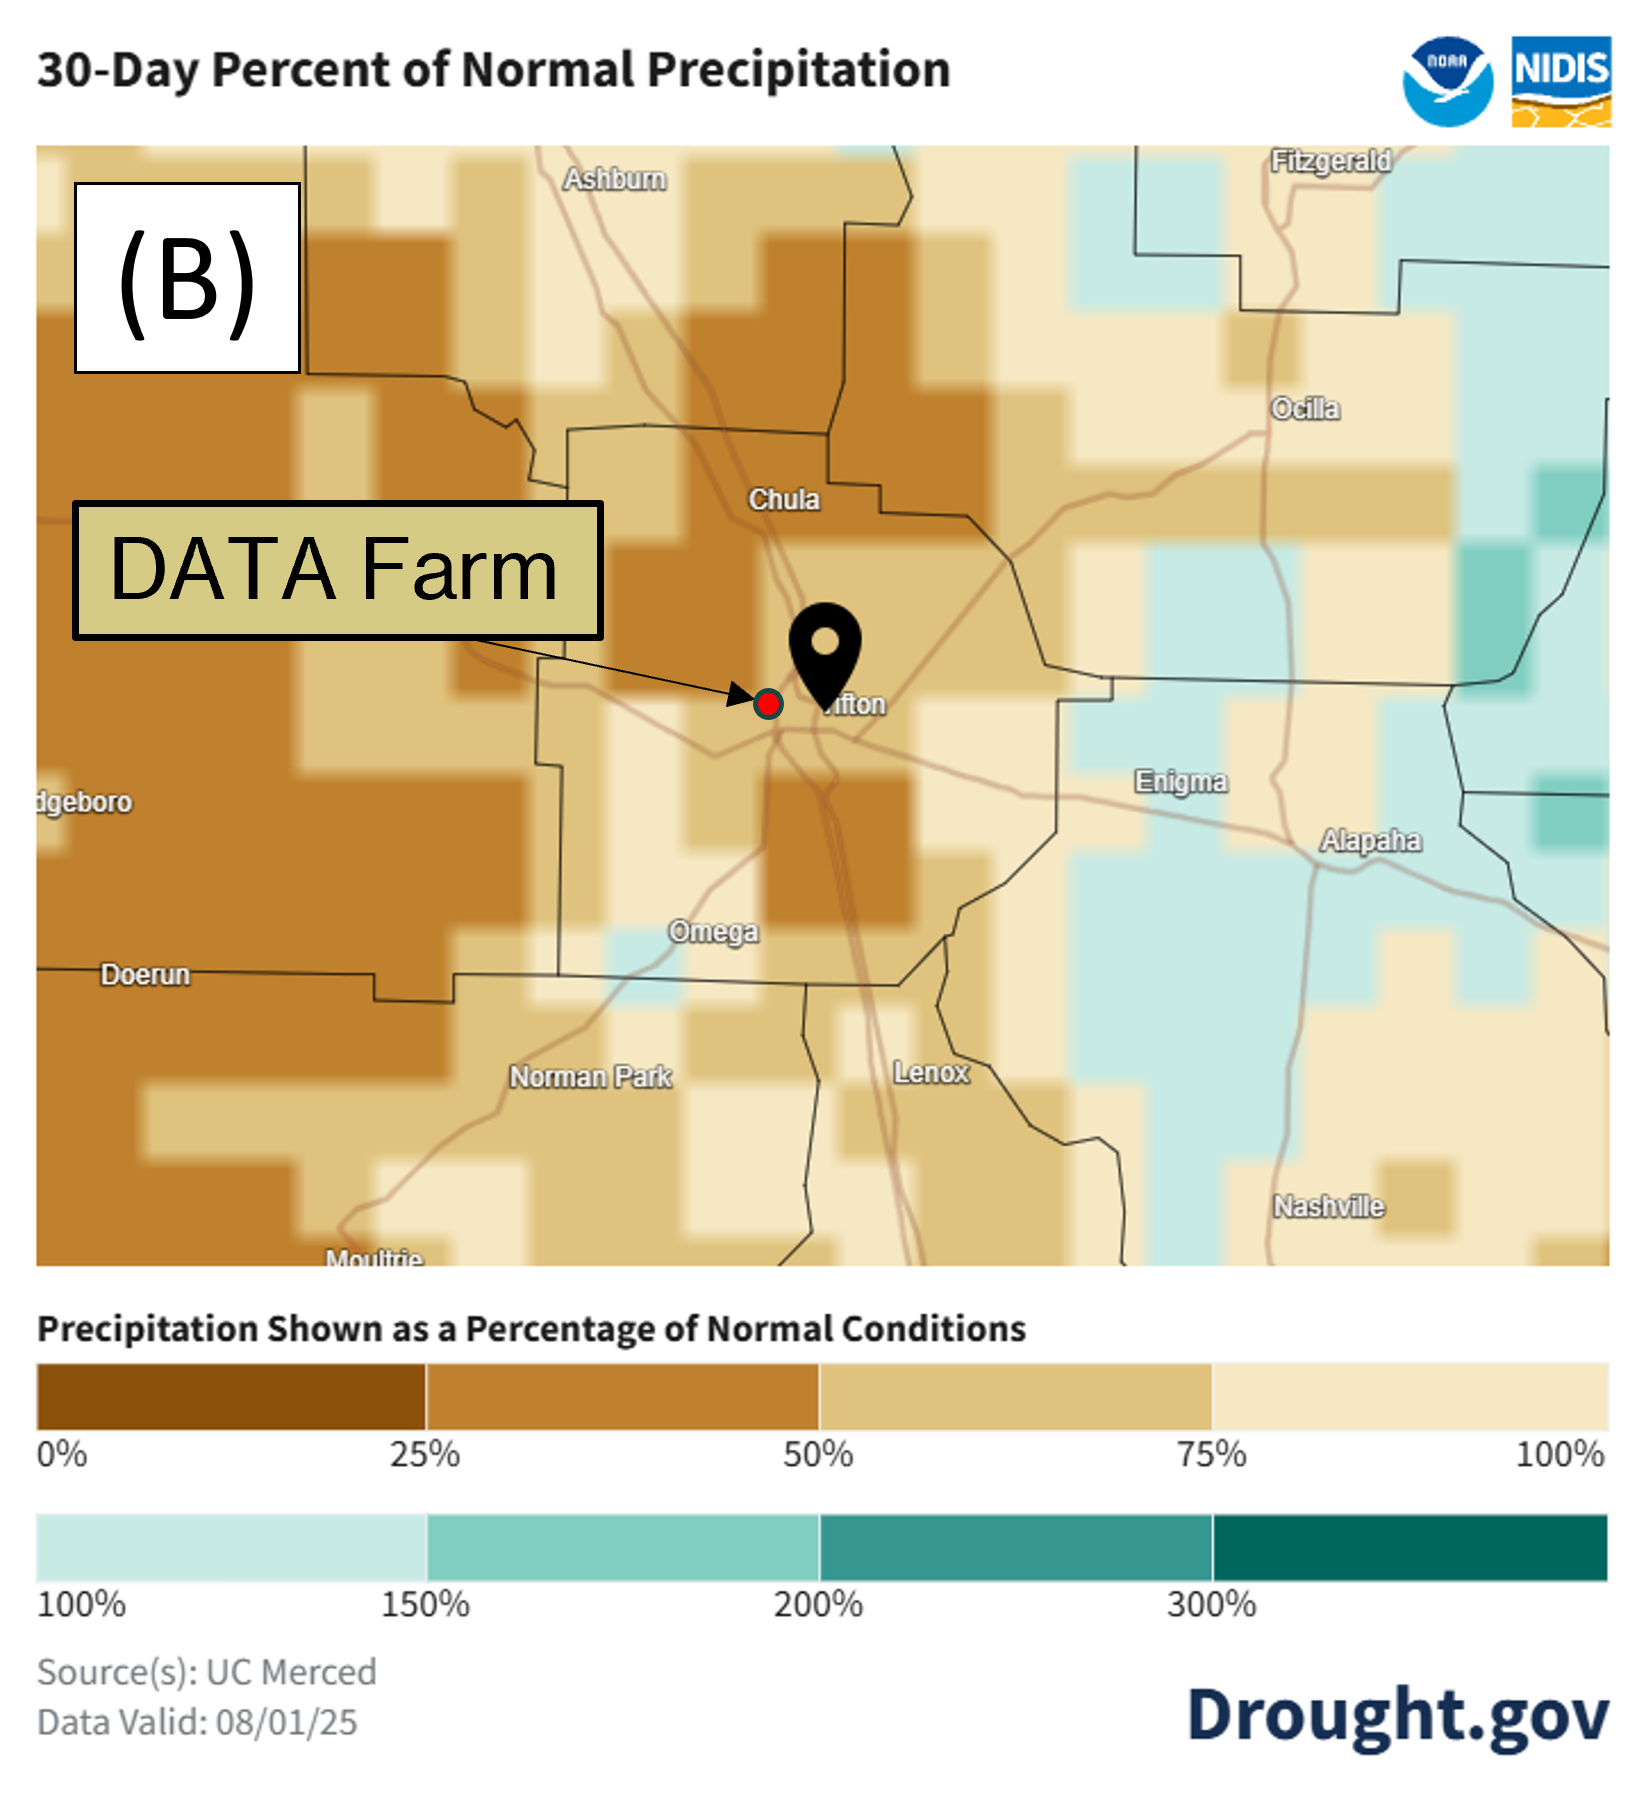
The images in Figure 8 show precipitation for the 30 days prior to August 1st for the state of Georgia (Figure 8A) and the Tift County area (Figure 8B) as a percentage of the historical average (1991–2020) for the same period. These maps show the variation in rainfall received across the state, and that the area around the DATA Farm received slightly below average rainfall during the previous 30 days. We measured approximately 0.75 inches below average. The areas experiencing lower than average rainfall align with the maps above in Figure 7, showing drought conditions.
The following sections list tasks performed during the month of July.


Operations:
Subscribe to get the latest posts sent to your email.