The month of August only had two field operations at the DATA Farm. The peanuts in South Pivot received their 90-day (Elatus, 9.5 oz/ac) and 105-day (Provost Silver, 13 oz/ac) fungicide treatments. The cotton crop reached cut-out during the first week of August, and on August 11th, the first cracked bolls were observed.
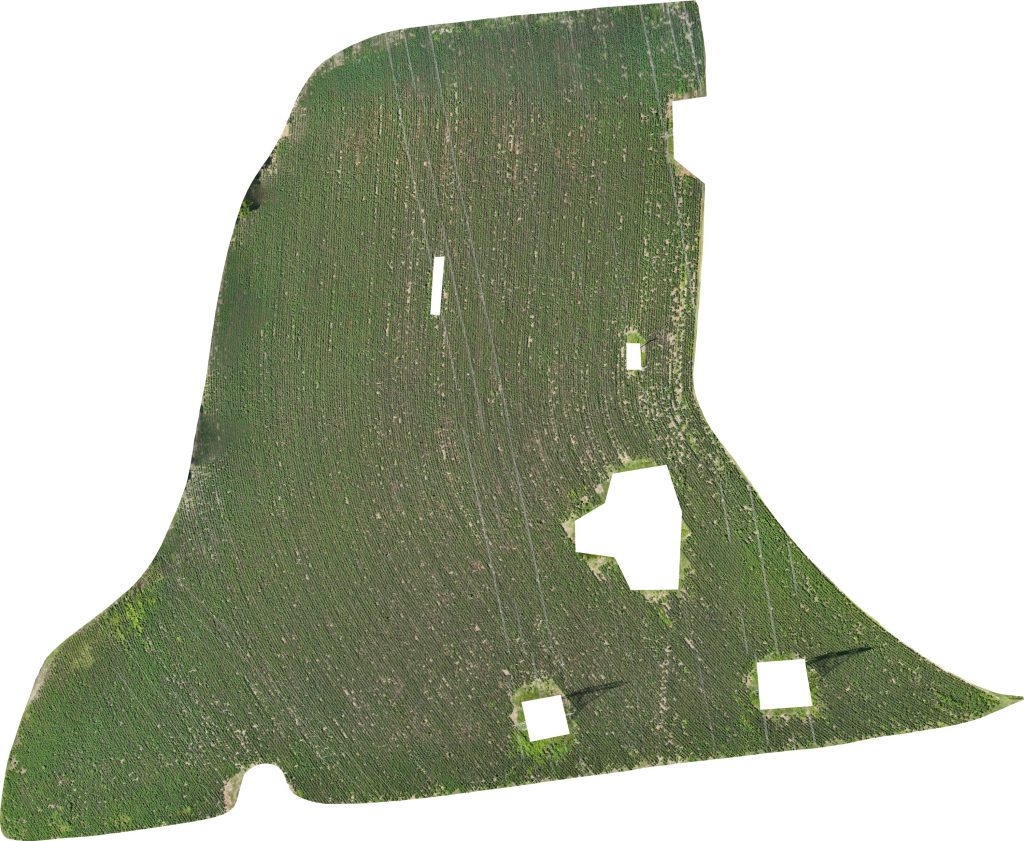
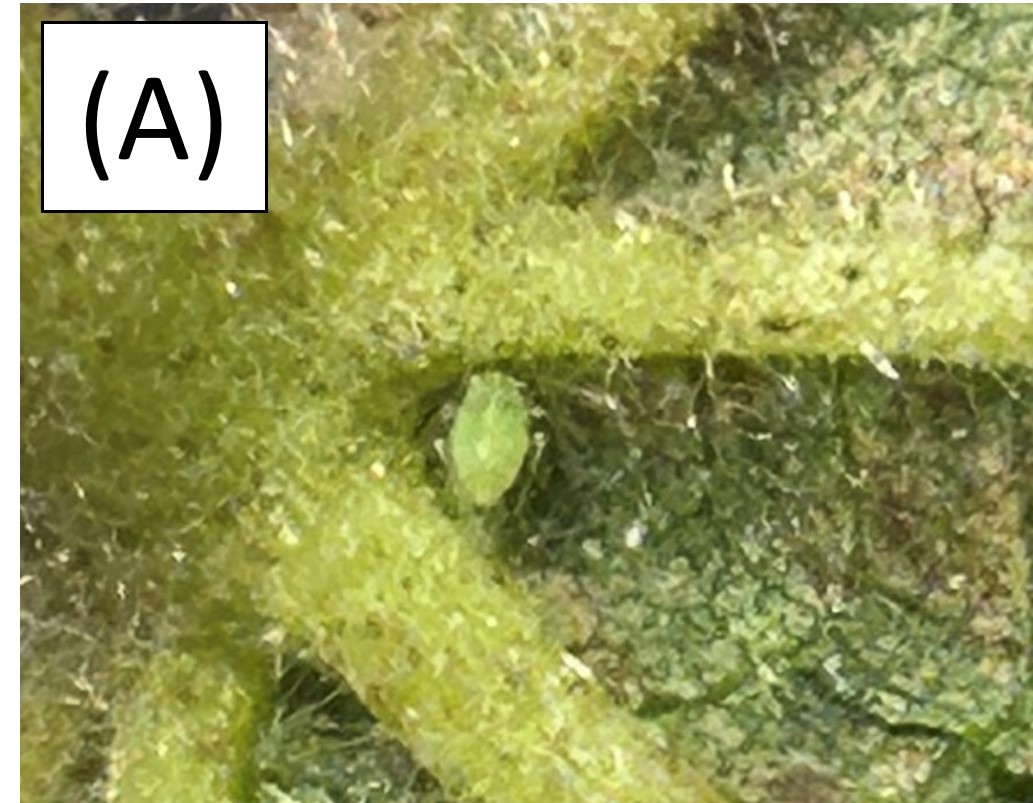
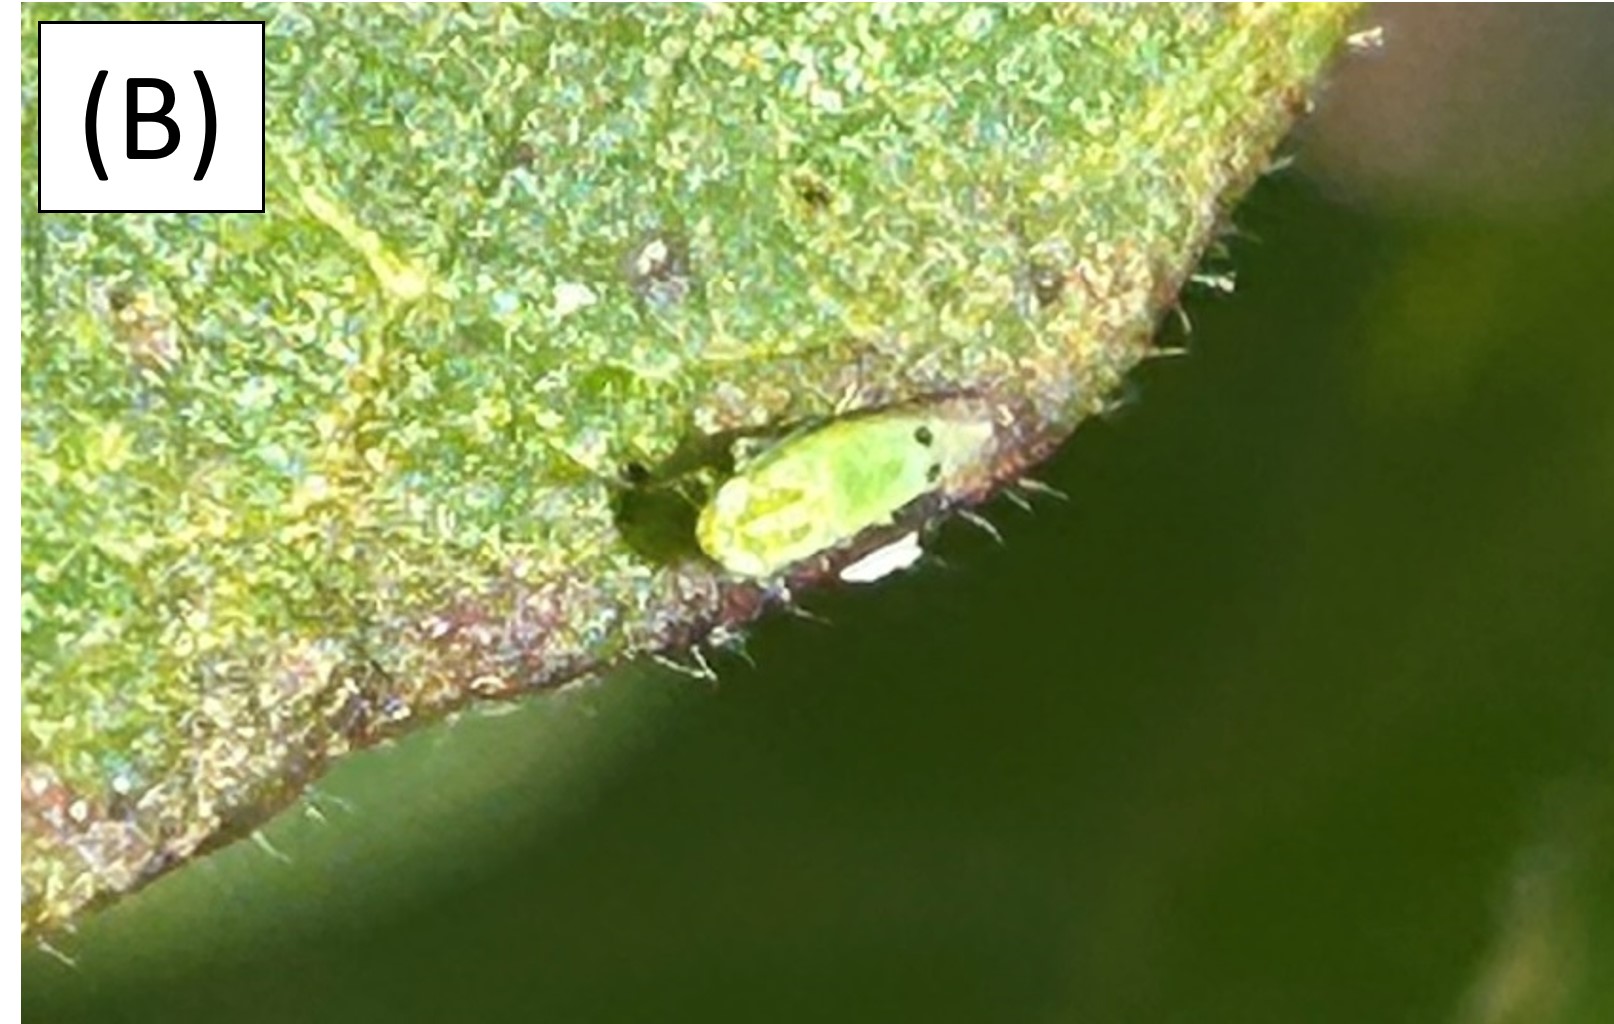
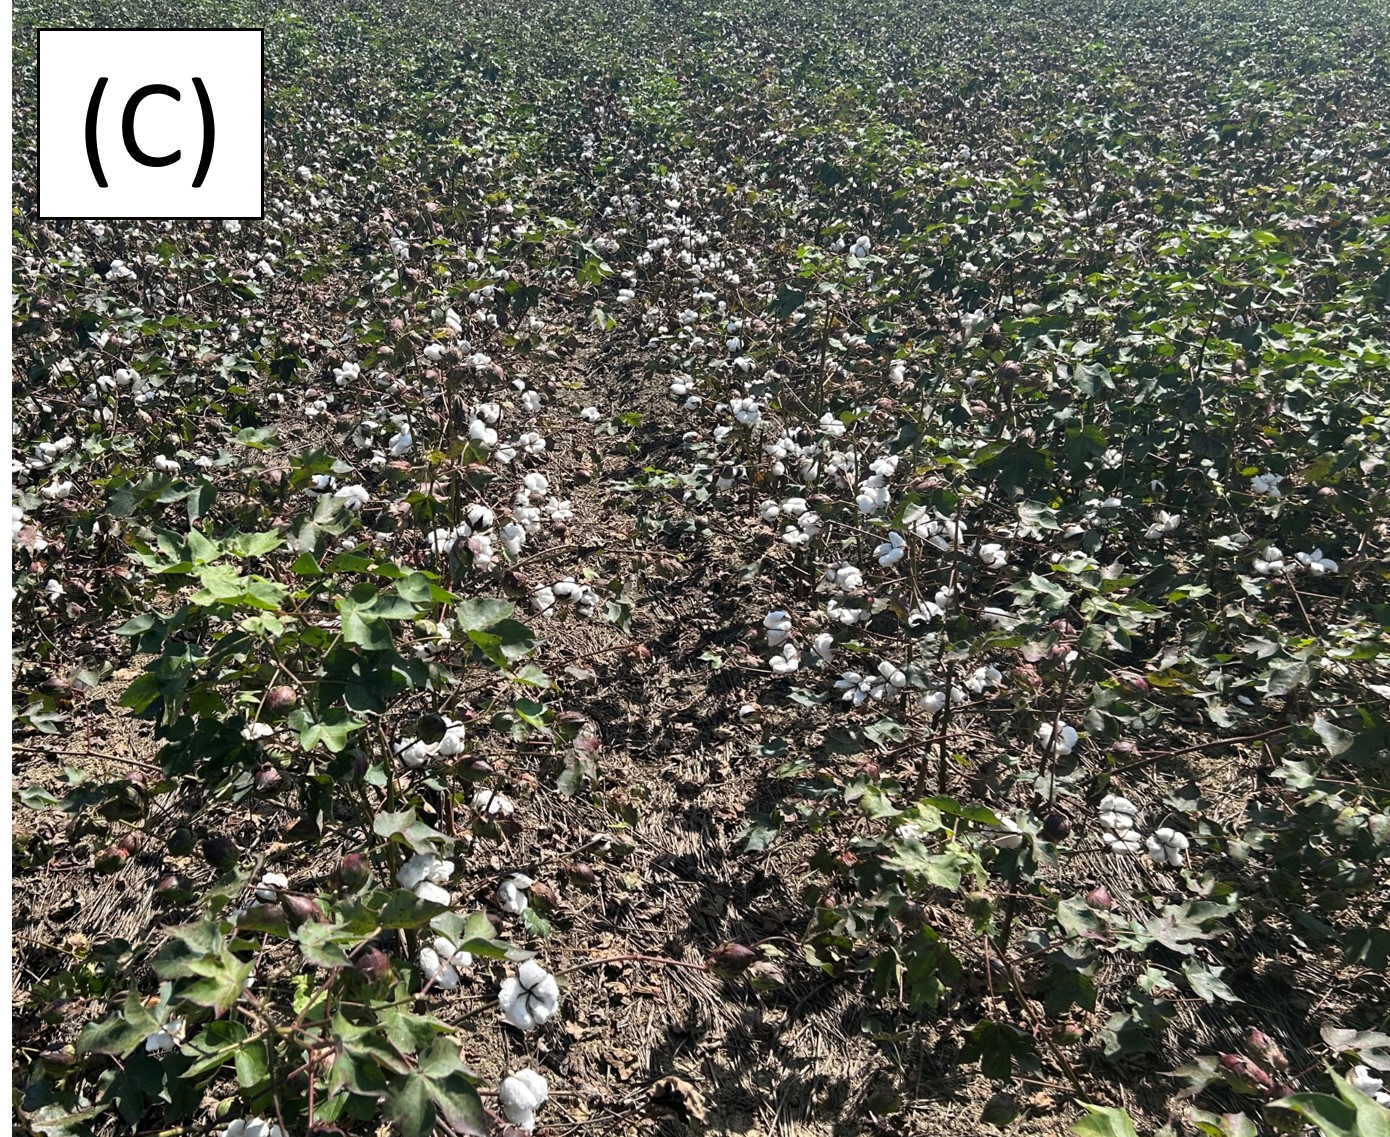
After the bolls started to open, leaves in parts of the fields started to darken and fall off. Upon investigation, the newest insect pest to cotton in our area, the Cotton Jassid (two-spotted cotton leafhopper) was discovered in all three of the cotton fields at the DATA Farm. Figure 1A shows a Cotton Jassid nymph on the underside of a cotton leaf, and Figure 1B shows an adult Cotton Jassid. Figure 1C shows an area of severe damage in West Field caused by the Cotton Jassid.
The cotton at the DATA Farm is close enough to the planned defoliation operation that treatment is not beneficial. The harvestable cotton bolls are close enough to maturity that the fields should be ready for defoliation in early September.
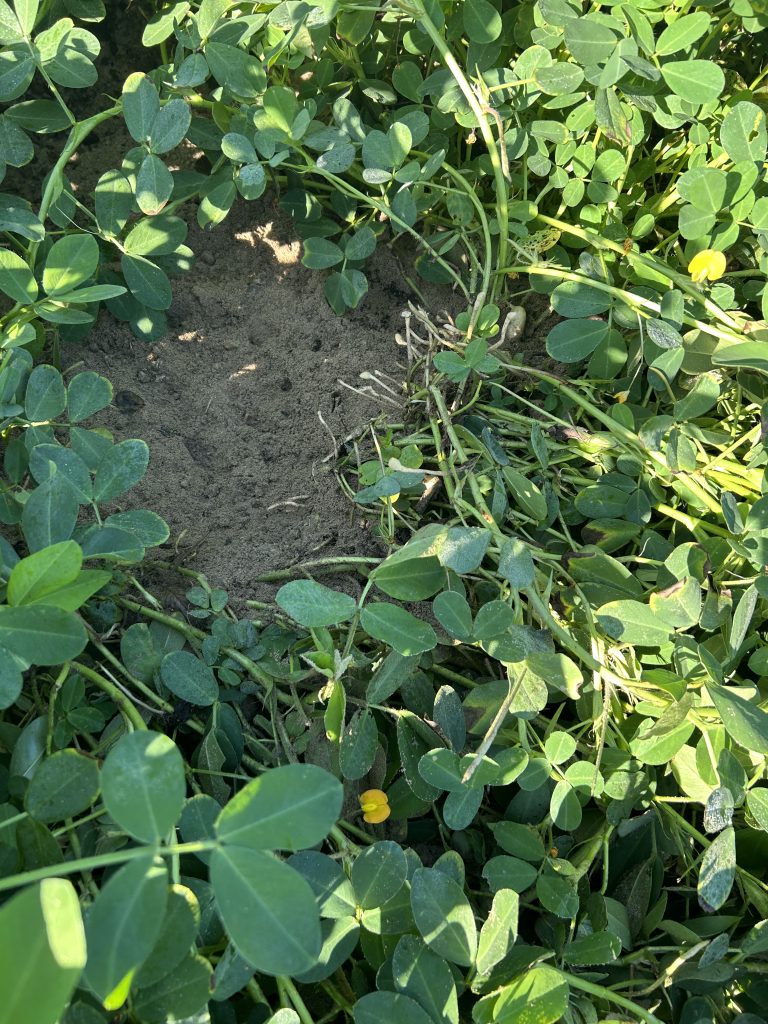
The peanuts in South Pivot were not without predation during August. A new type of deer damage was observed during the first week of August. The deer have started digging up the plants to get to the developing pods underneath instead of just grazing on the canopy. Figure 2 shows an uprooted peanut plant and empty pegs where deer removed the developing pod.
Dr. Rains is working on a project to study deer damage in crops and placed several trail cameras at the DATA Farm this month to start tracking deer activity.
Figure 2. Deer damage to the peanut crop in South Pivot.
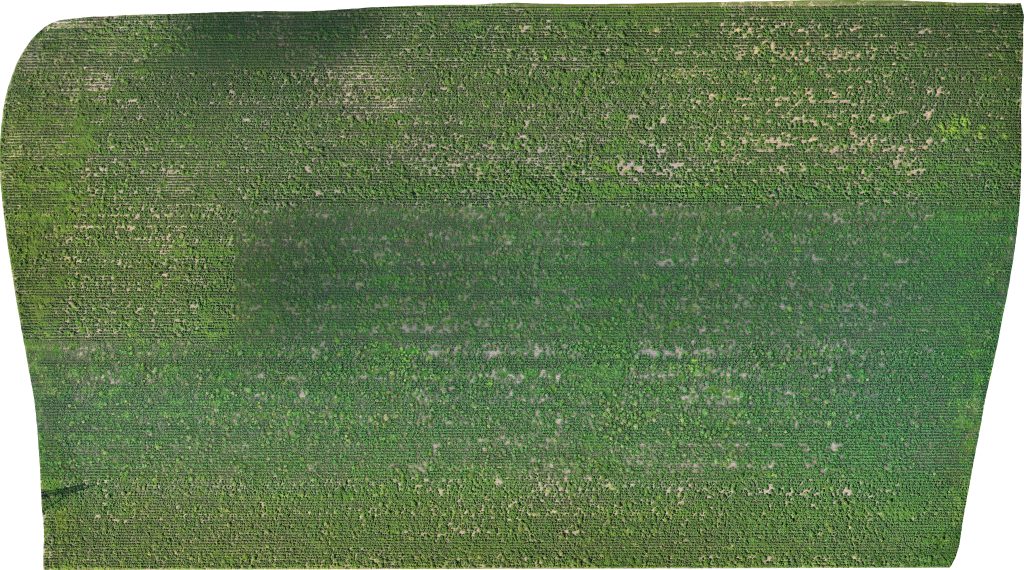
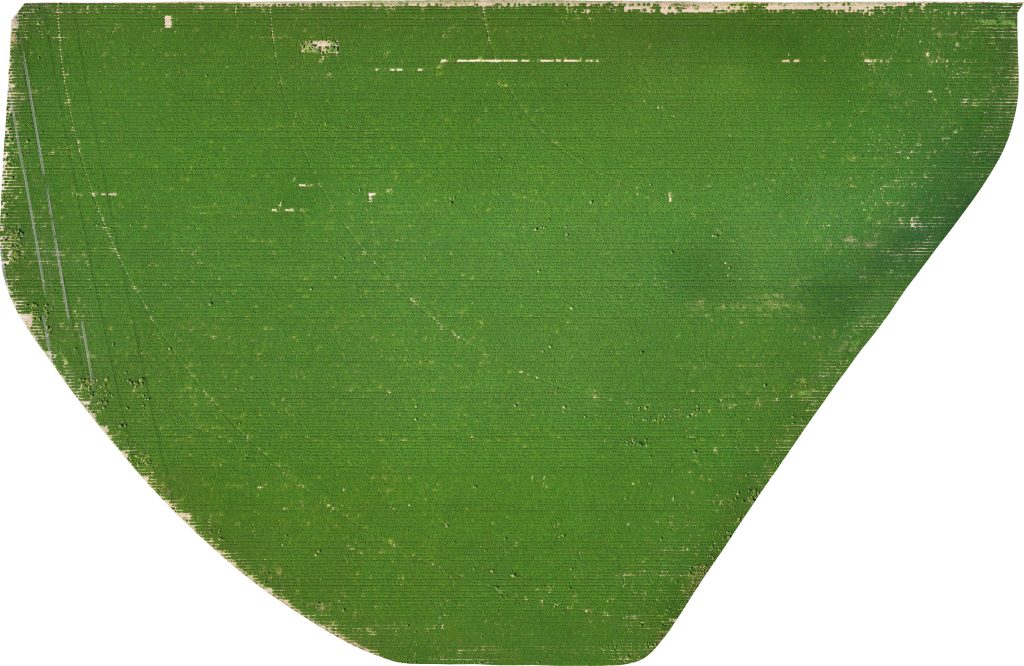
Despite pest pressure, both the peanuts and cotton are quickly heading towards harvest as shown in Figure 3. These pictures were taken at the end of August to highlight the progress of the crops. The cotton should be ready for harvest in mid-September, and the peanuts should be ready at the beginning of October.
The 4D Farm Project team hosted a field day at the DATA Farm on the morning of August 21st. There were fourstops set up where UGA researchers and students presented on projects they are currently working on.
Stop 1: IoT Whitefly Traps
The first stop (Figure 4) featured Dr. Rains talking about his IoT whitefly traps. These traps capture an image of collected specimens during a periodof timeand transmit them via cellular modem to a server where a program counts how many are in the image.
Figure 4. Dr. Rains presenting on IoT insect traps.
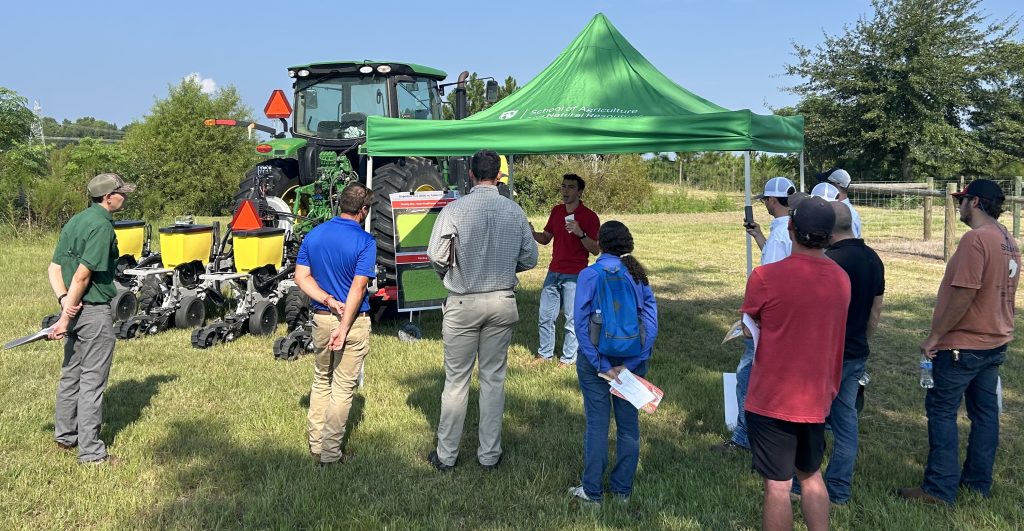
Stop 2: Planter Technology
The fourth stop (Figure 5) featured planter technology presented by Dr. Porter’s graduate student, Marco Torresan. This presentation covered electric seed meters, high speed planters, downforce technology, and closing systems.
Figure 5. Marco presenting on planter research.
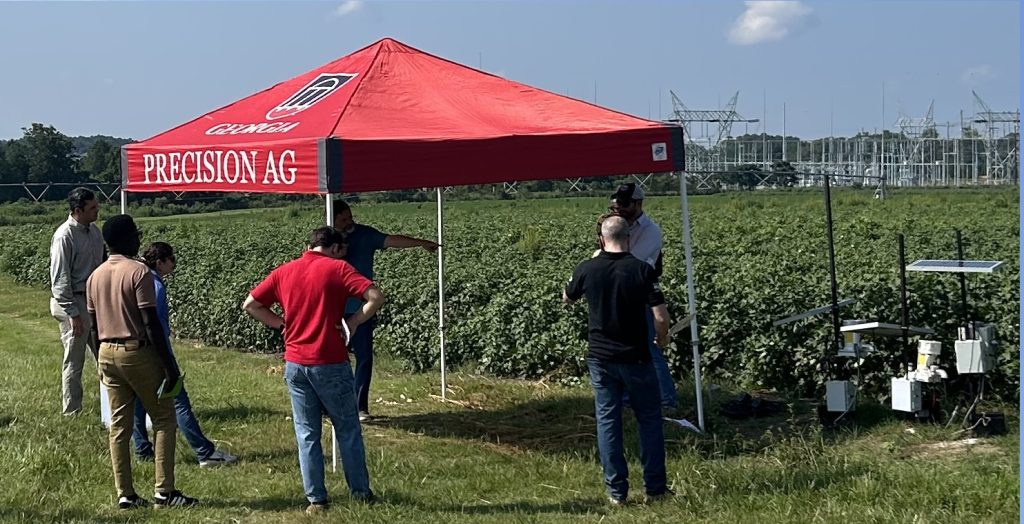
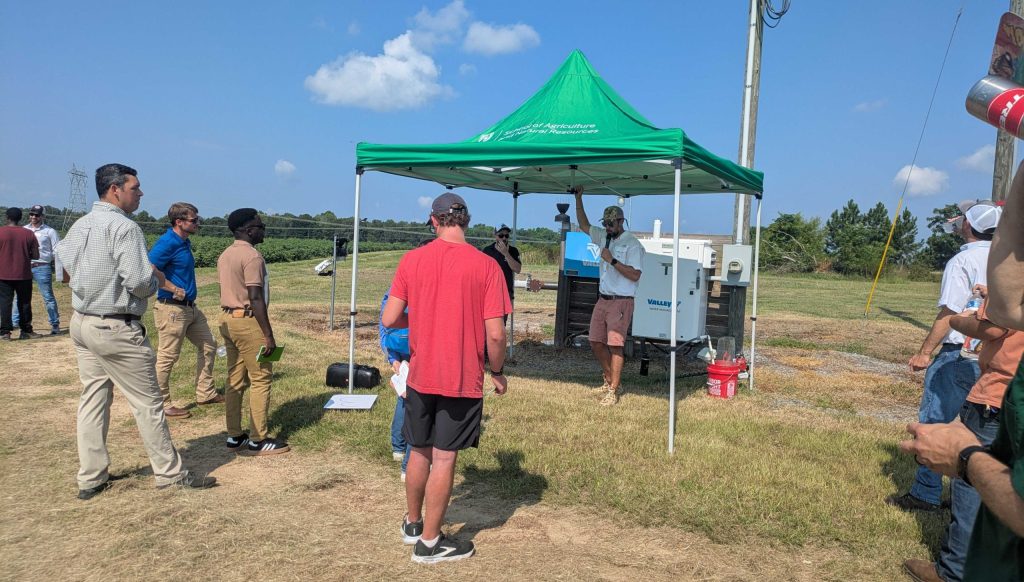
Stop 3: Precision Irrigation
The third stop (Figure 6) featured Dr. Porter discussing his research in irrigation scheduling and application systems. This presentation covered soil moisture sensors, app-based scheduling, and variable rate pivots.
Figure 6. Dr. Porter presenting on sensor-based irrigation management.
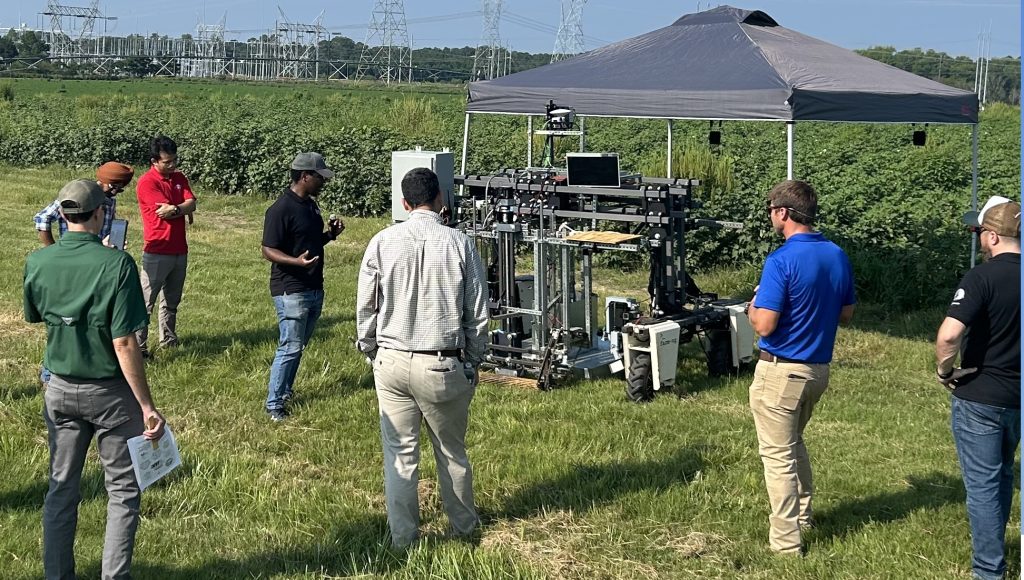
Stop 4: Autonomous Field Rover
At the second stop (Figure 7), Dr. Rains’ graduate students, CaniciusMwitta, Shekhar Thapa, and Taranjeet Sodhi,shared their work on an autonomous field rover toterminate weeds with a laser, pullweeds from the ground, and harvestcotton.
Figure 7. Canicius Mwitta demonstrating an autonomous rover.
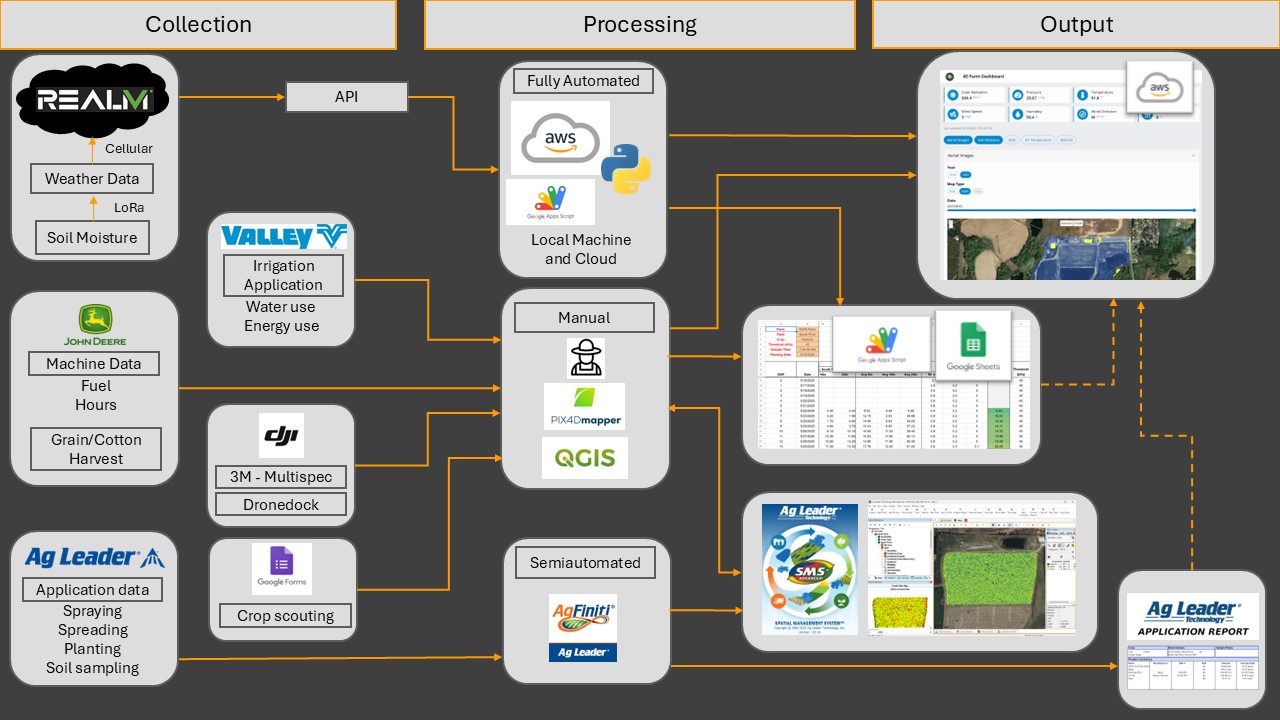
After the first four stops, Dr. McLemore gave a presentation in the DATA Farm building on the use of UAV’s and data flow for the 4D Farm project. Figure 8 shows how data flows from collection through processing to an output for the project.
Figure 8: 4D Farm data flow from collection to output
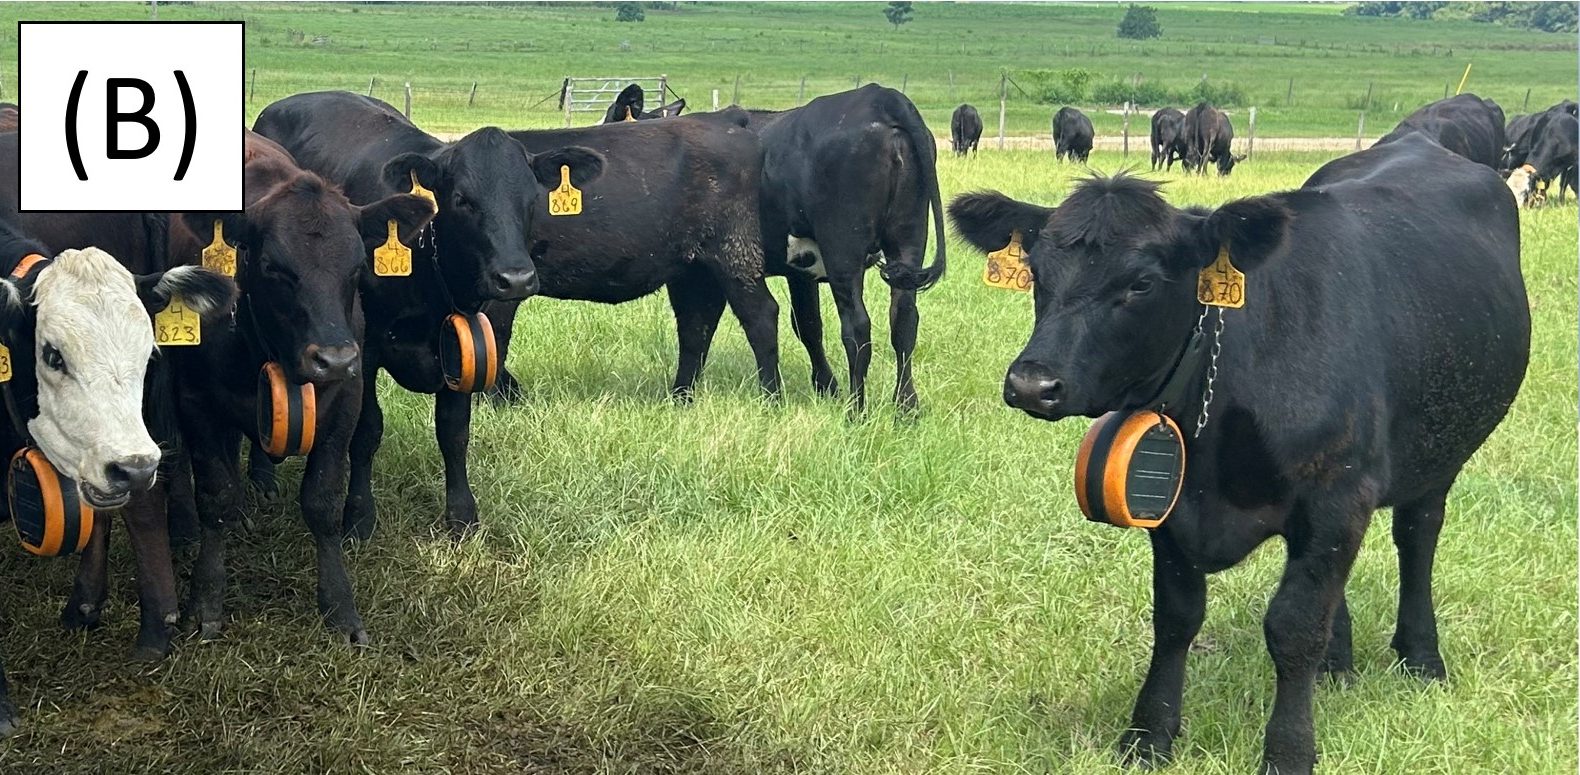
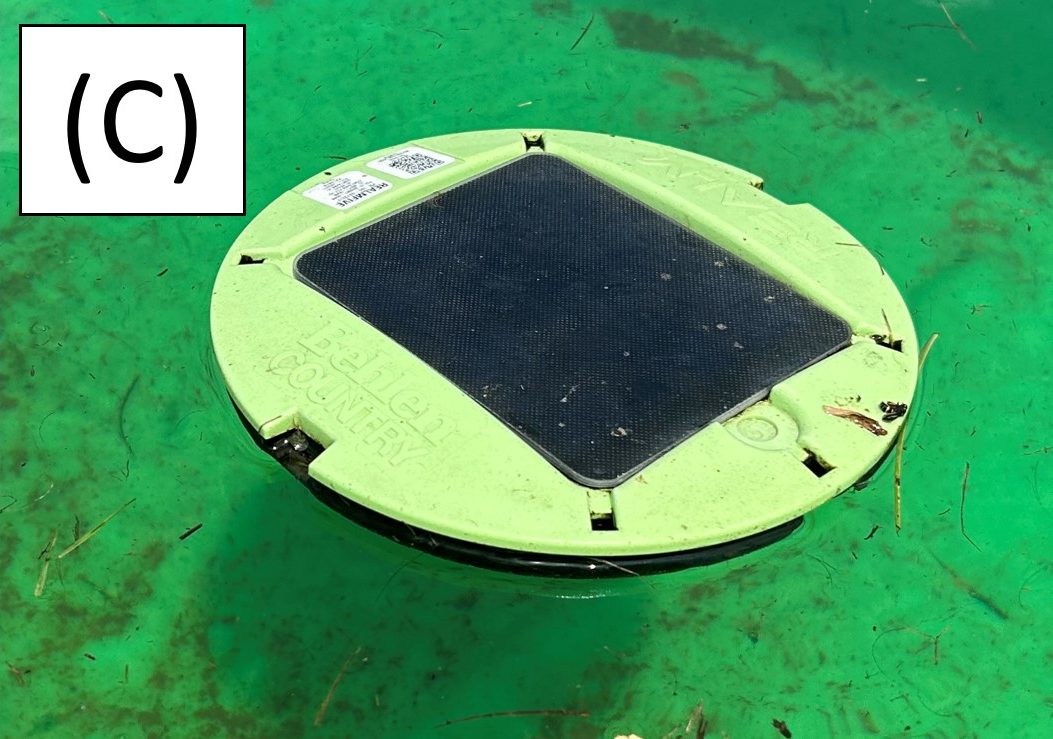
The last stop of the morning was the UGA Animal Science Farm, where Dr. Tucker had a small herd of livestock set up in an open area for demonstrating a portable shade canopy (Figure 9A), cellular-based GPS fence collars (Figure 9B), and cellular water trough monitors (Figure 9C).
Weather
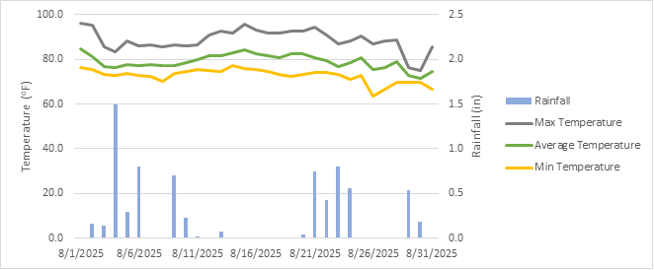
The monthly temperature trends and rainfall recorded by the on-site weather station for Augustare showninFigure10.
Figure 10. Monthly weather for August 2025.
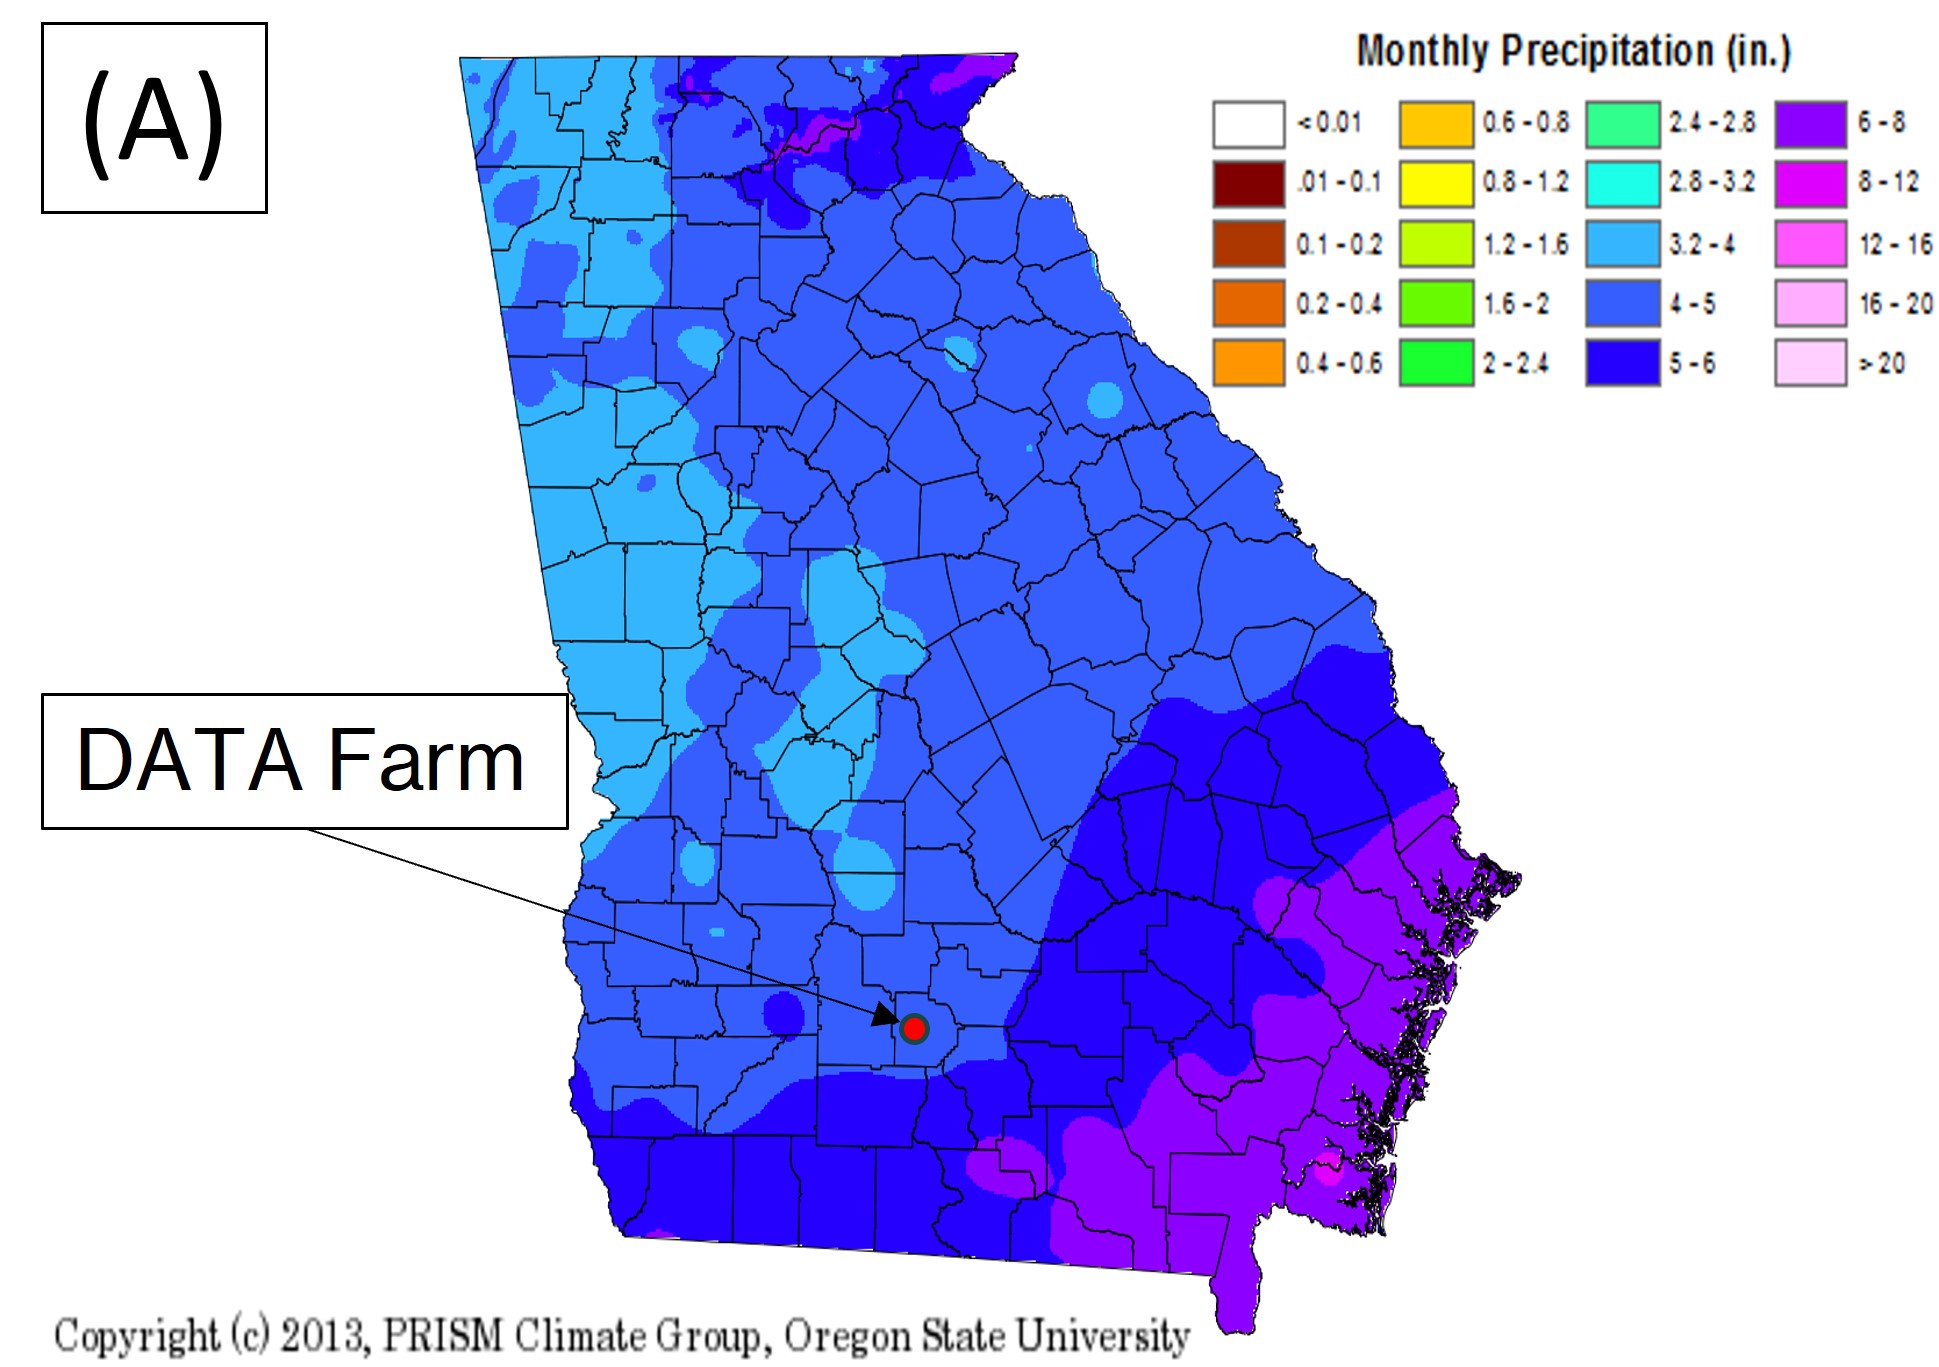
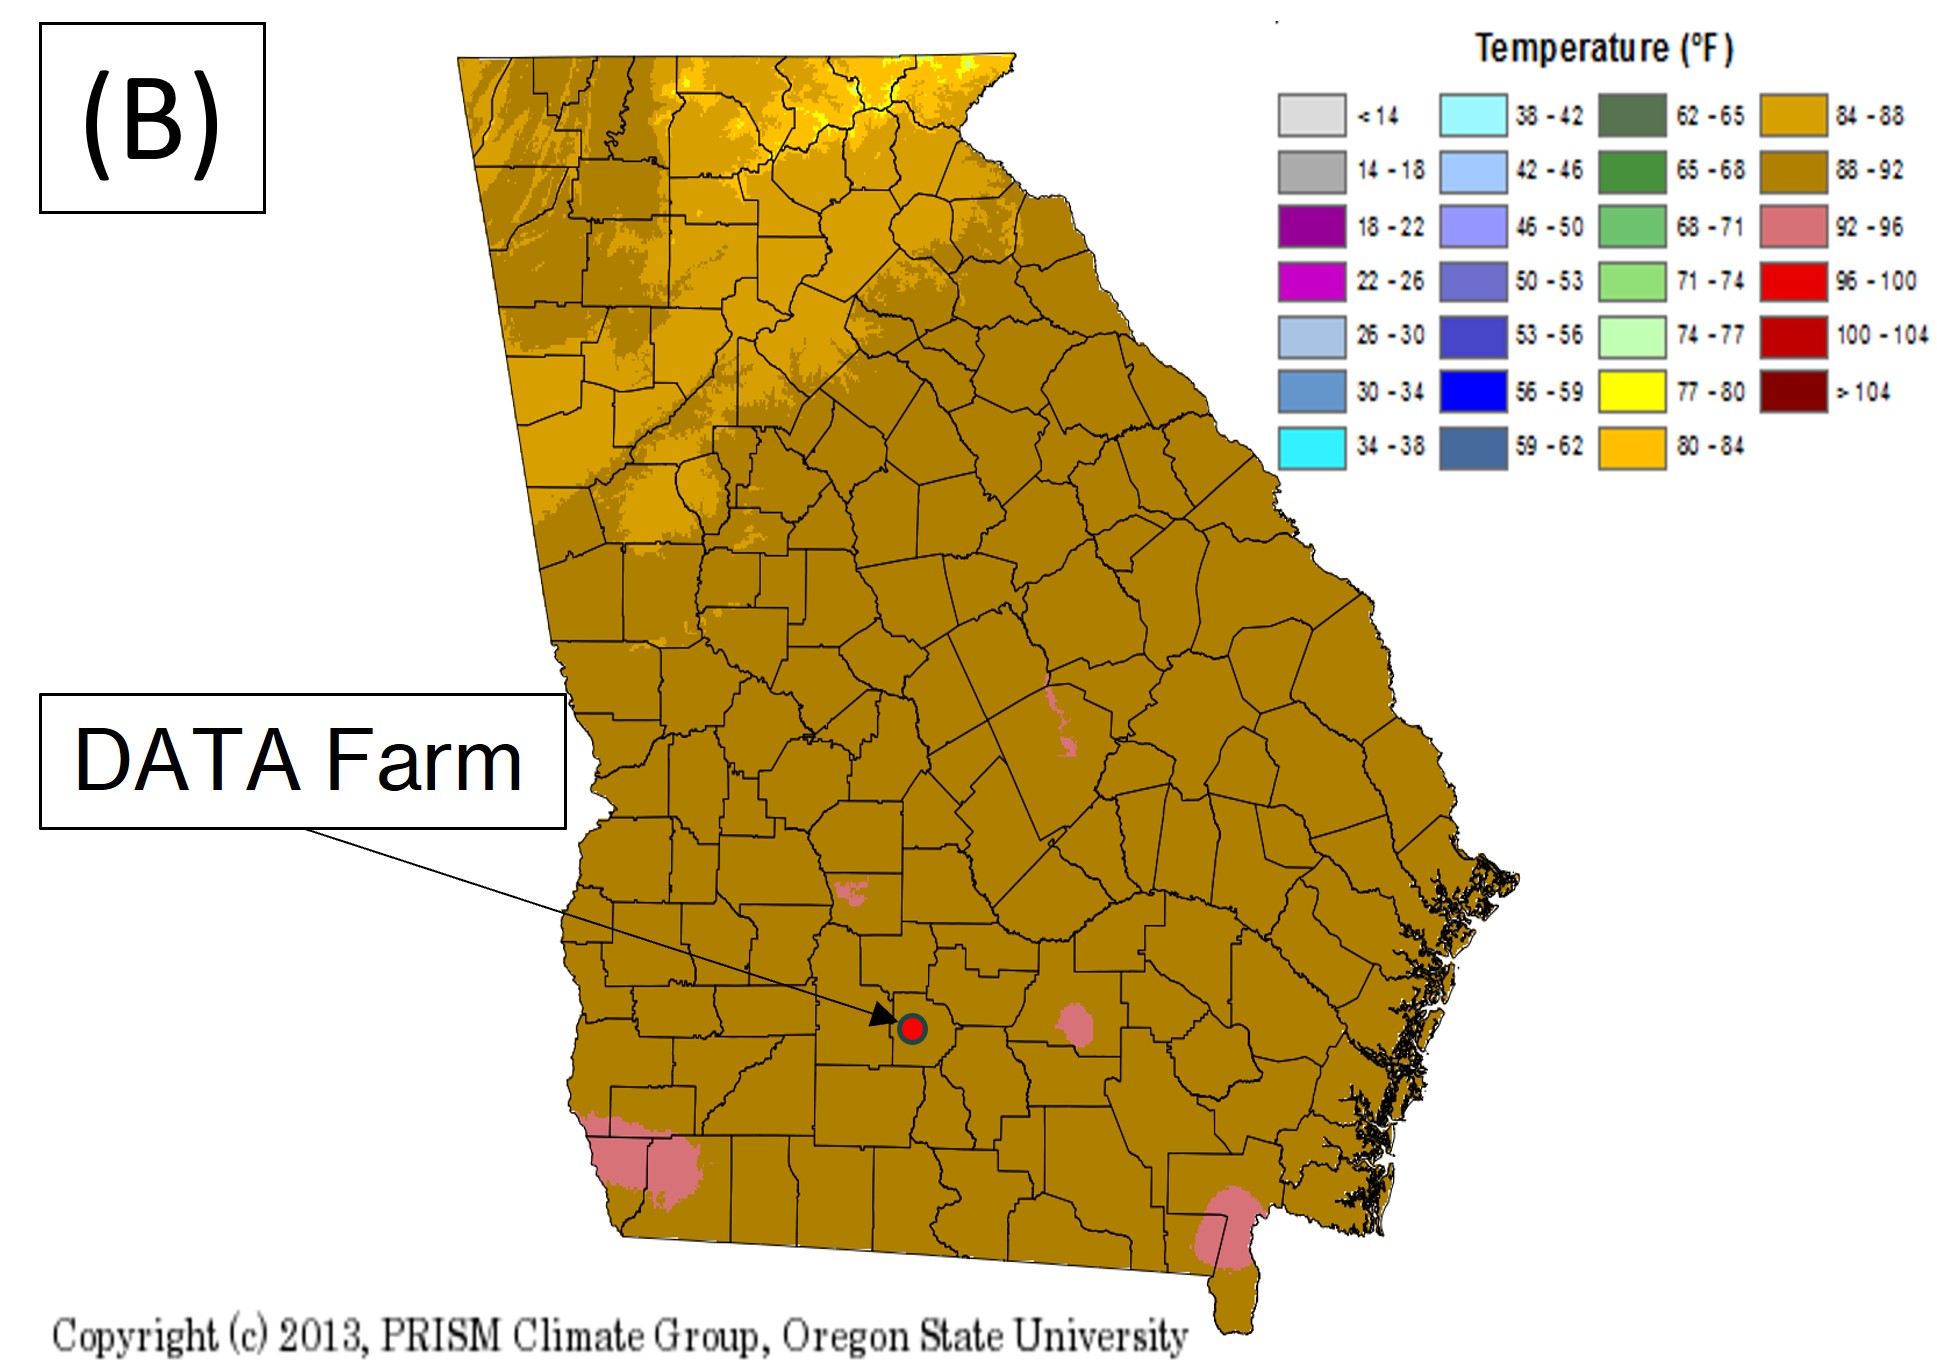
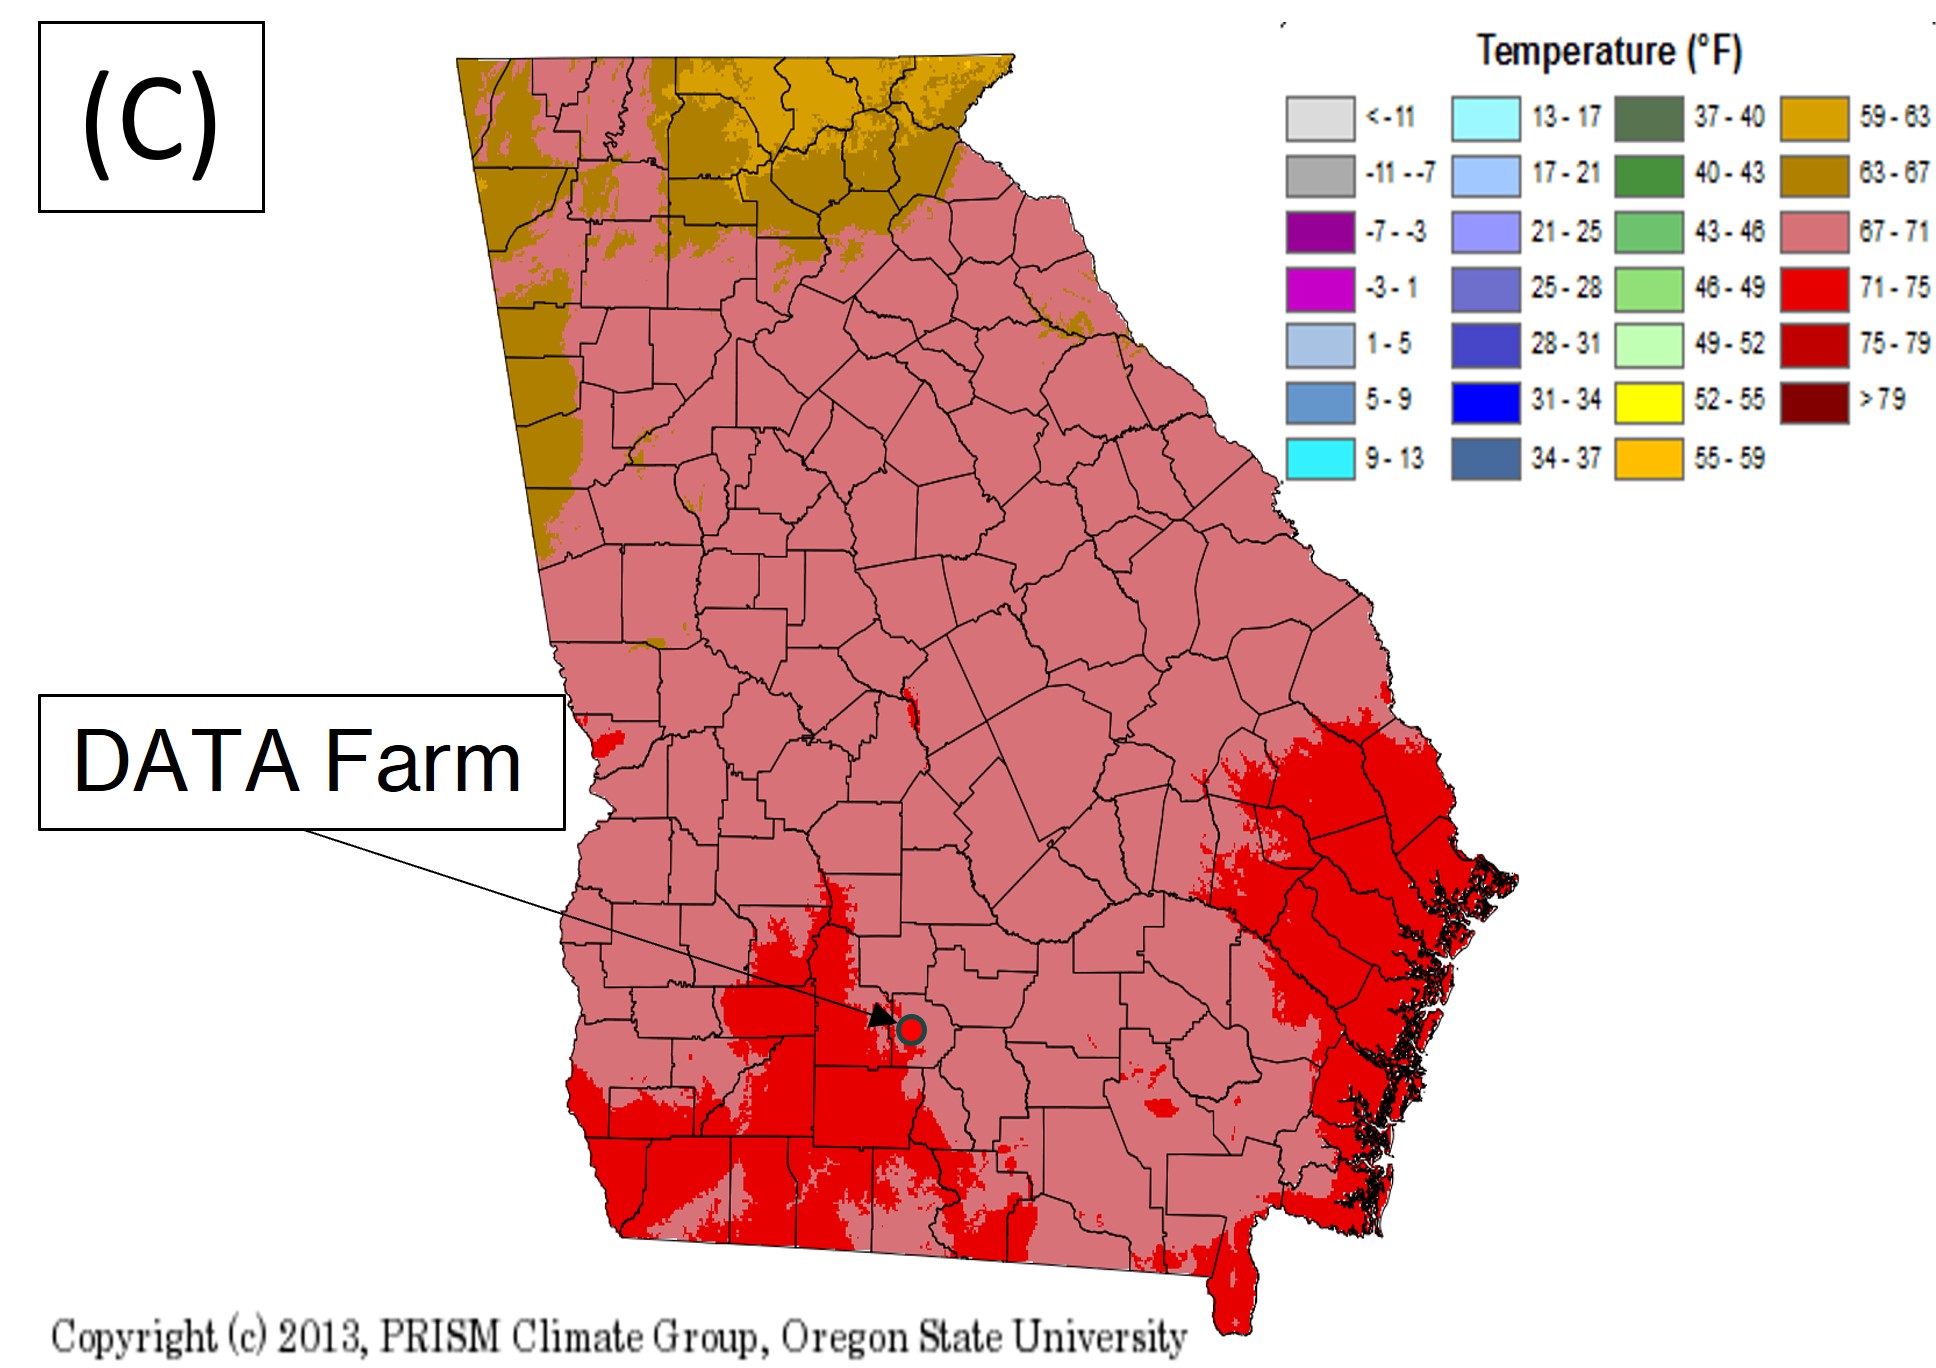
For comparison, Georgia climate maps based on data from 1981 to 2010 (UGA’s Weather Network) are shown in Figure 11 for the month of August for historical reference.
The average of recorded maximum temperatures for the month was 89°F, which is within the average historical range of 88°F – 92°F (Figure 11B), and the average of recorded minimum temperatures was 73°F, which is slightly above the average historical range of 67°F – 71°F (Figure 6C).August temperatures were lower than July’s temperatures,indicating a cooling trend towards the rest of the season. This results in less growing degree units(GDUs) each day from now until harvest.Timing of planting is imperative to ensure the crops receive enough growing degree units (heat units) to develop and mature properly.
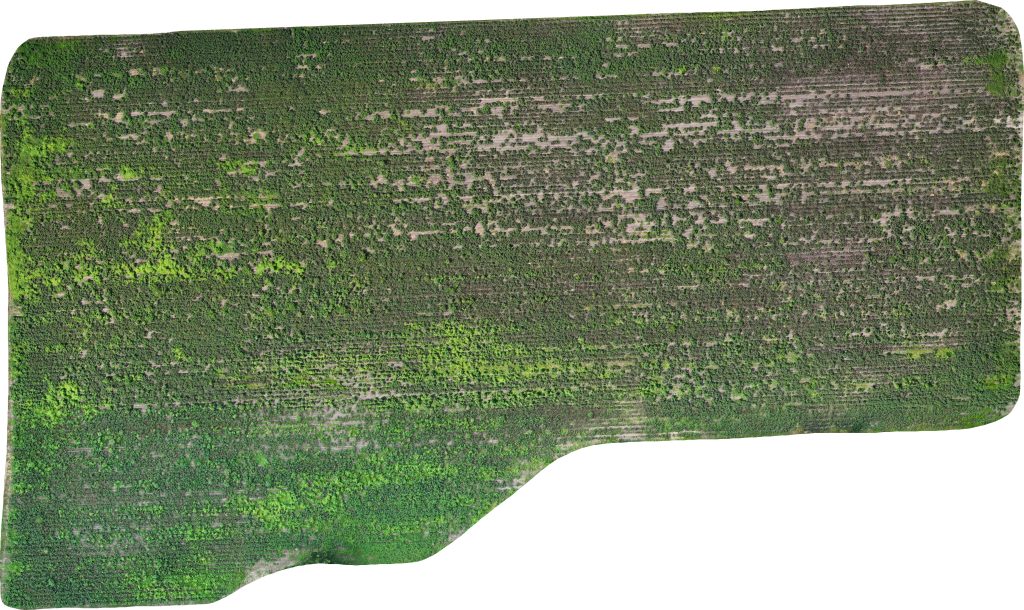
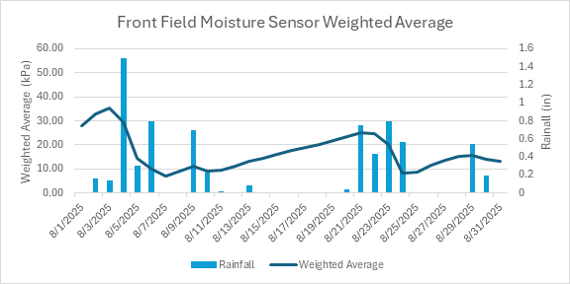
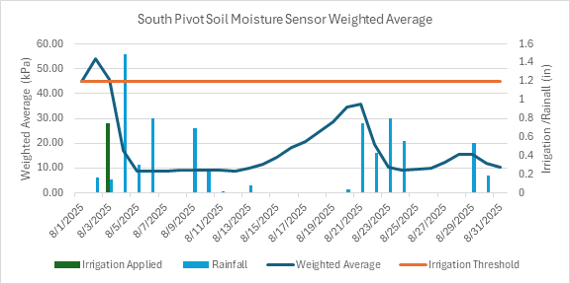
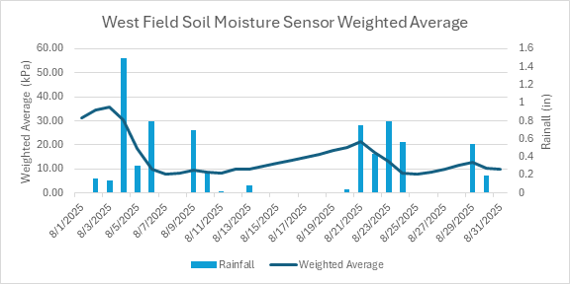
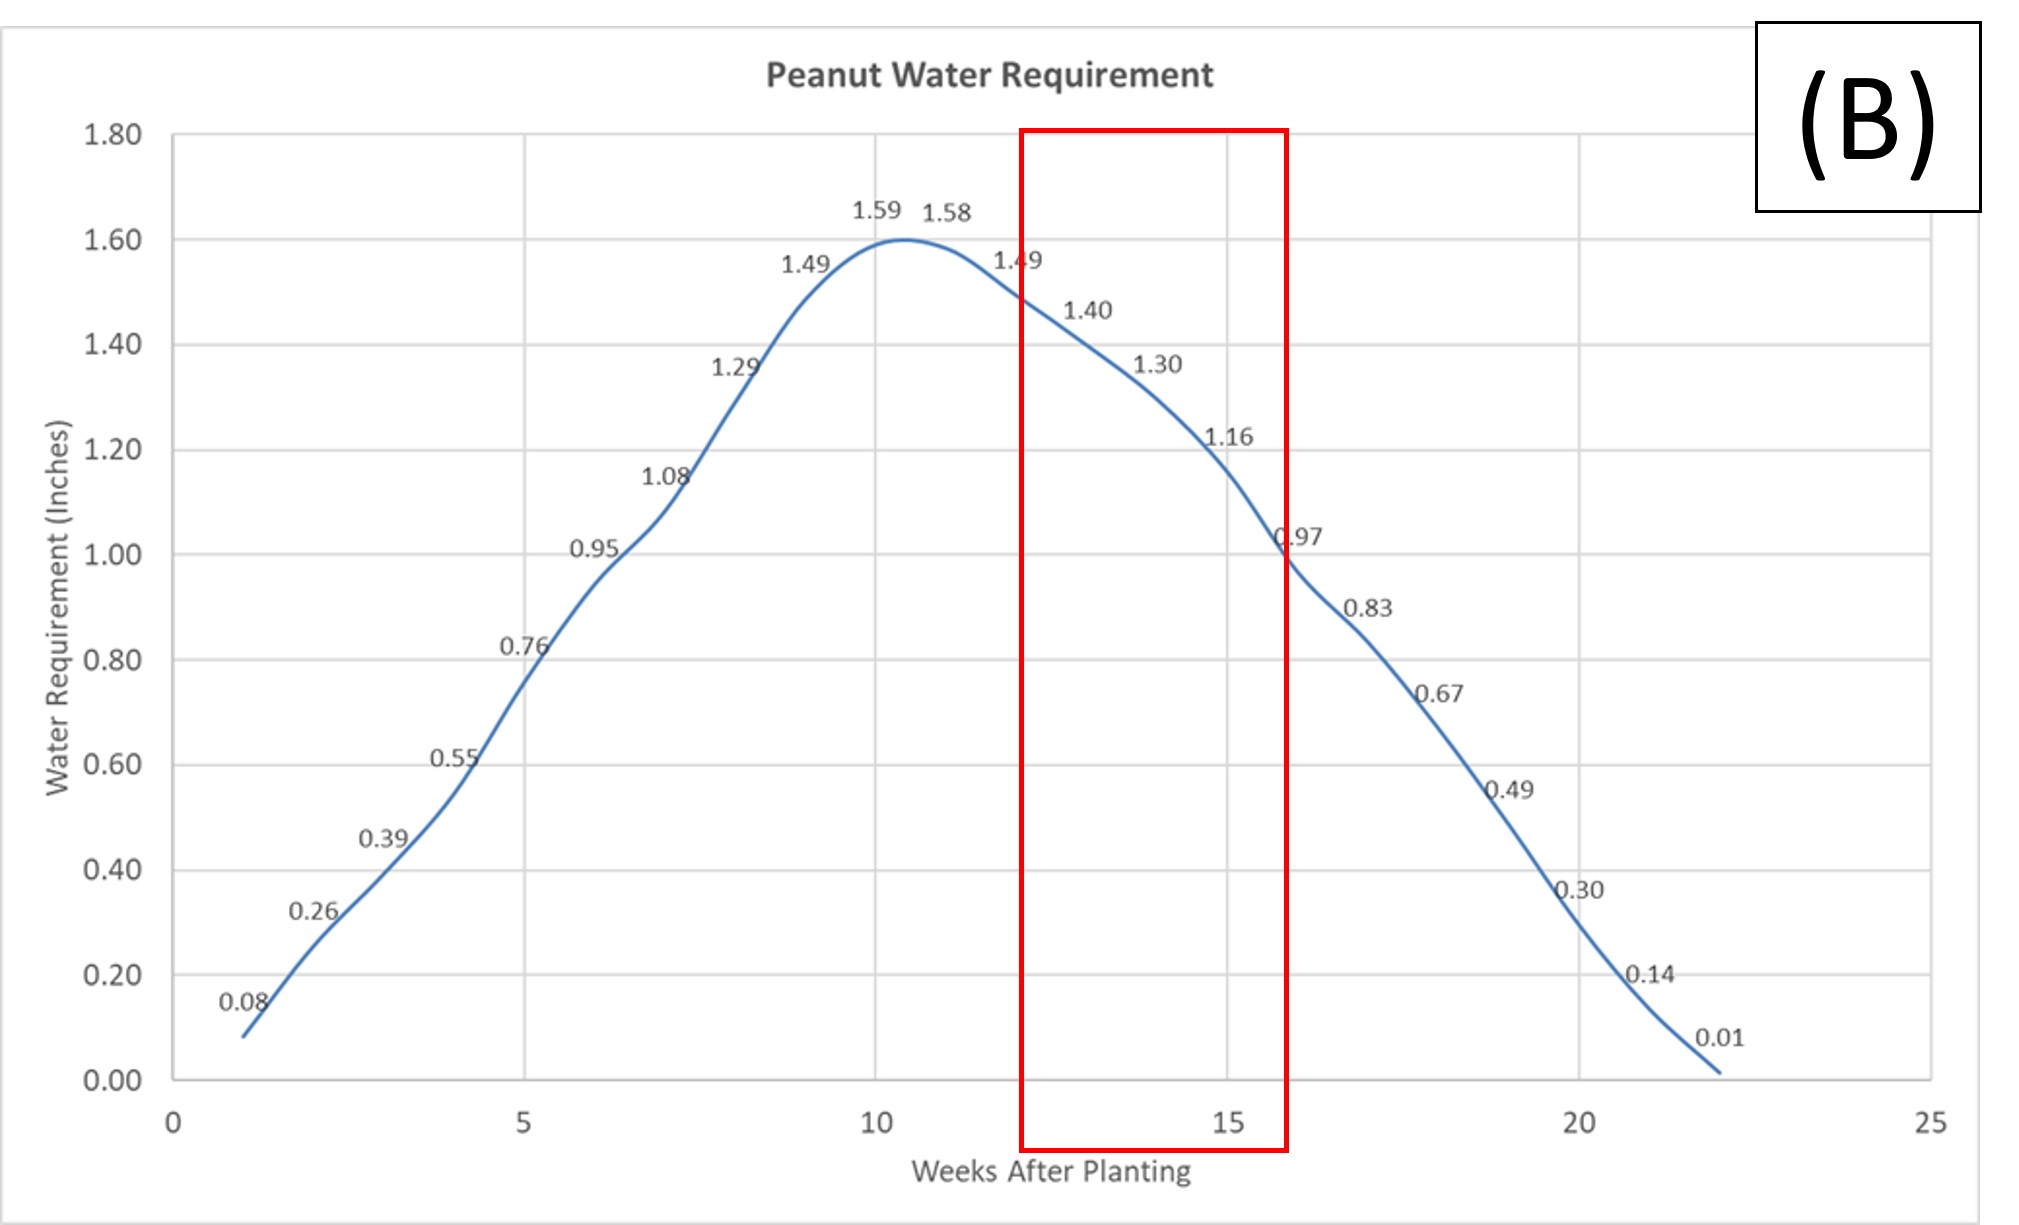
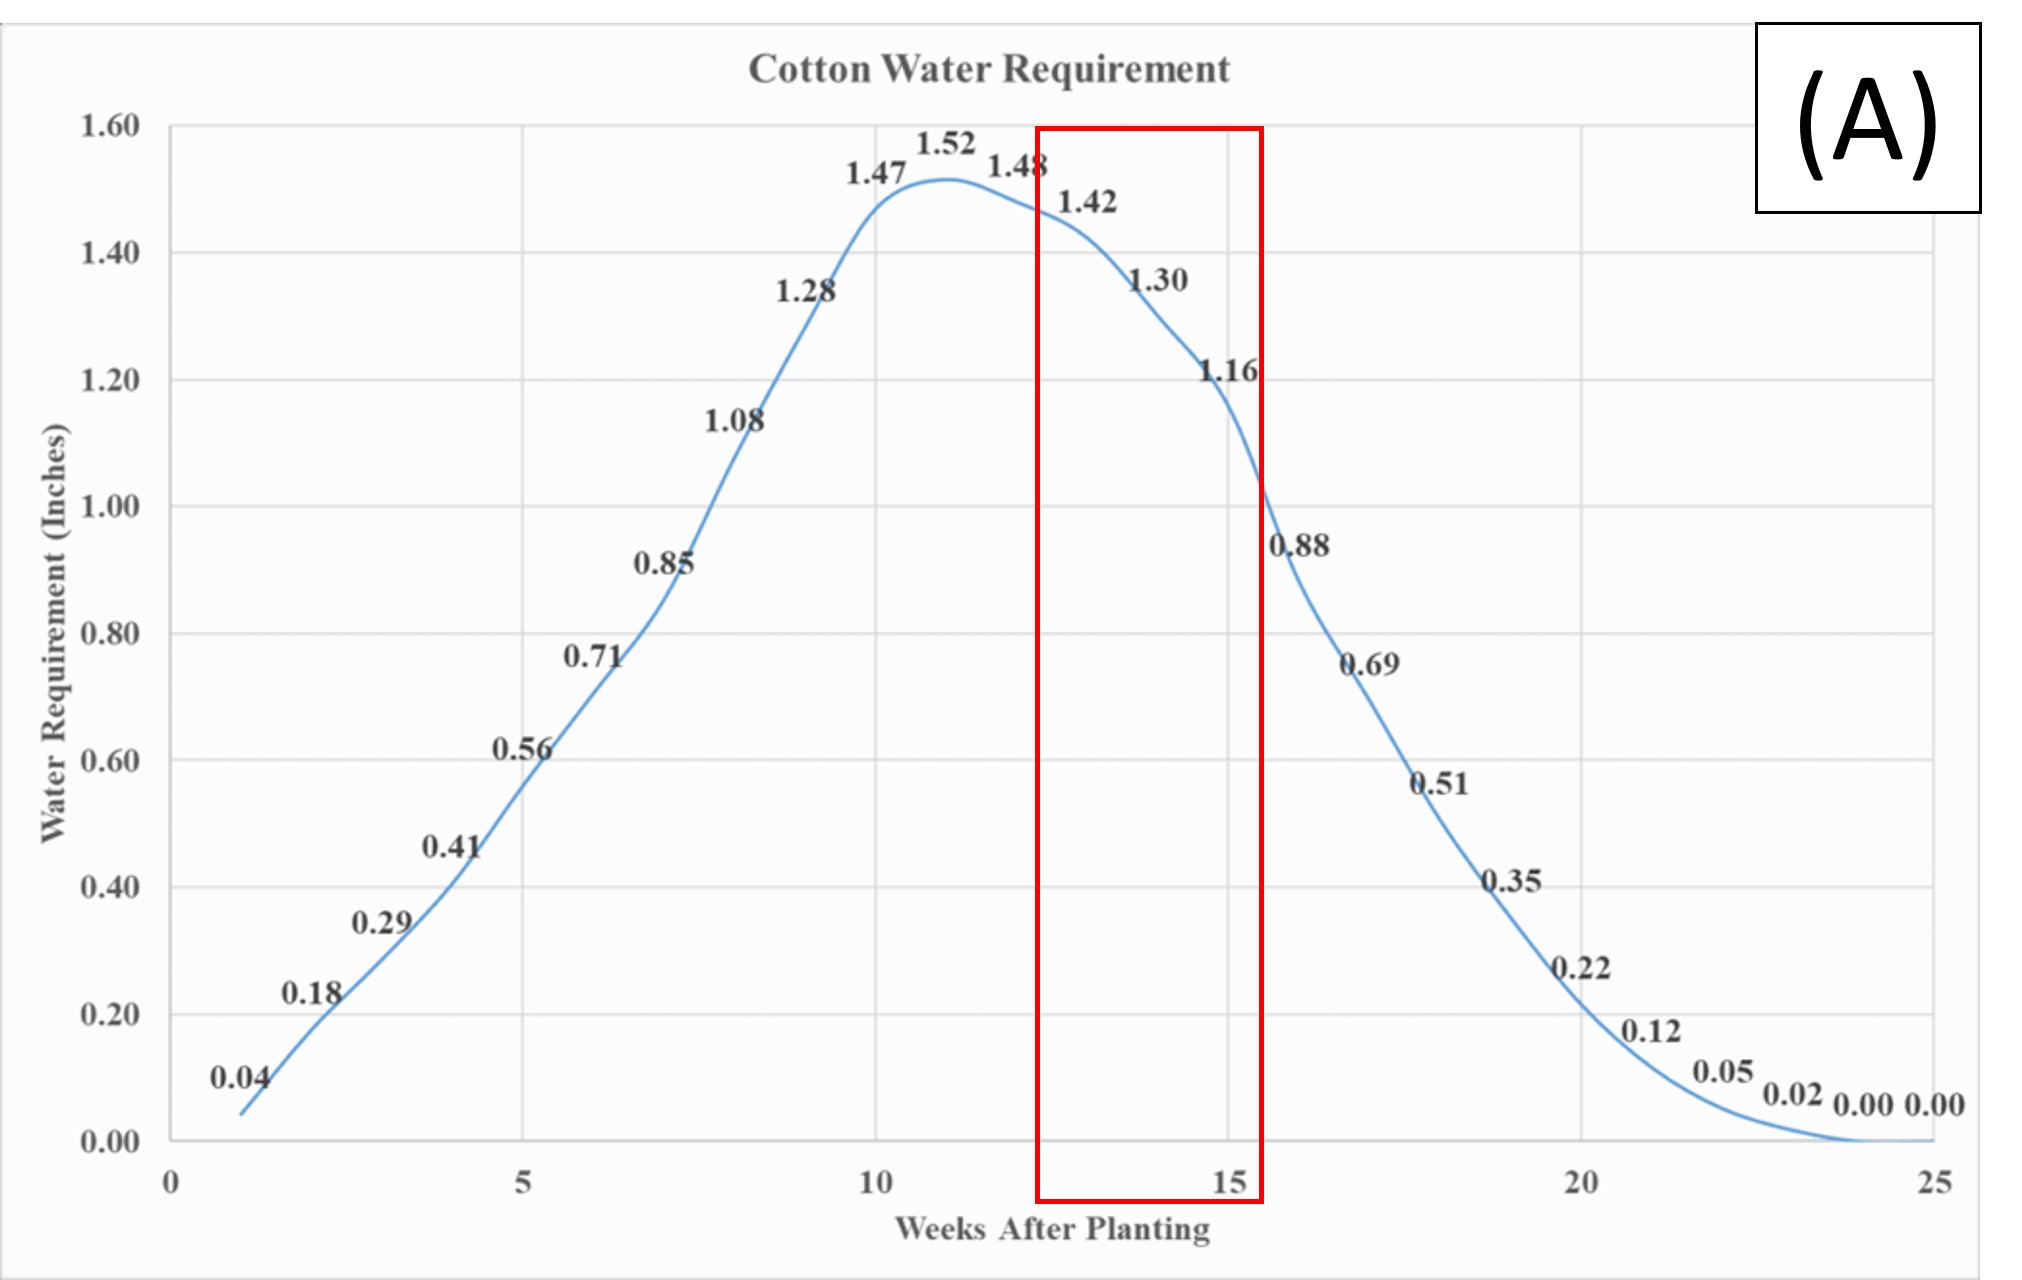
The 7.2 inches of rainfall recorded at the DATA Farm during Augustwas aboveaverage (4 to 5 inches) for this period. This prevented soil sensors from hitting the 45 kPa trigger point for irrigation. During August, both the cotton and peanut crops entered the tail end of their crop water use curves,12 as shown in Figure 12 A and B.
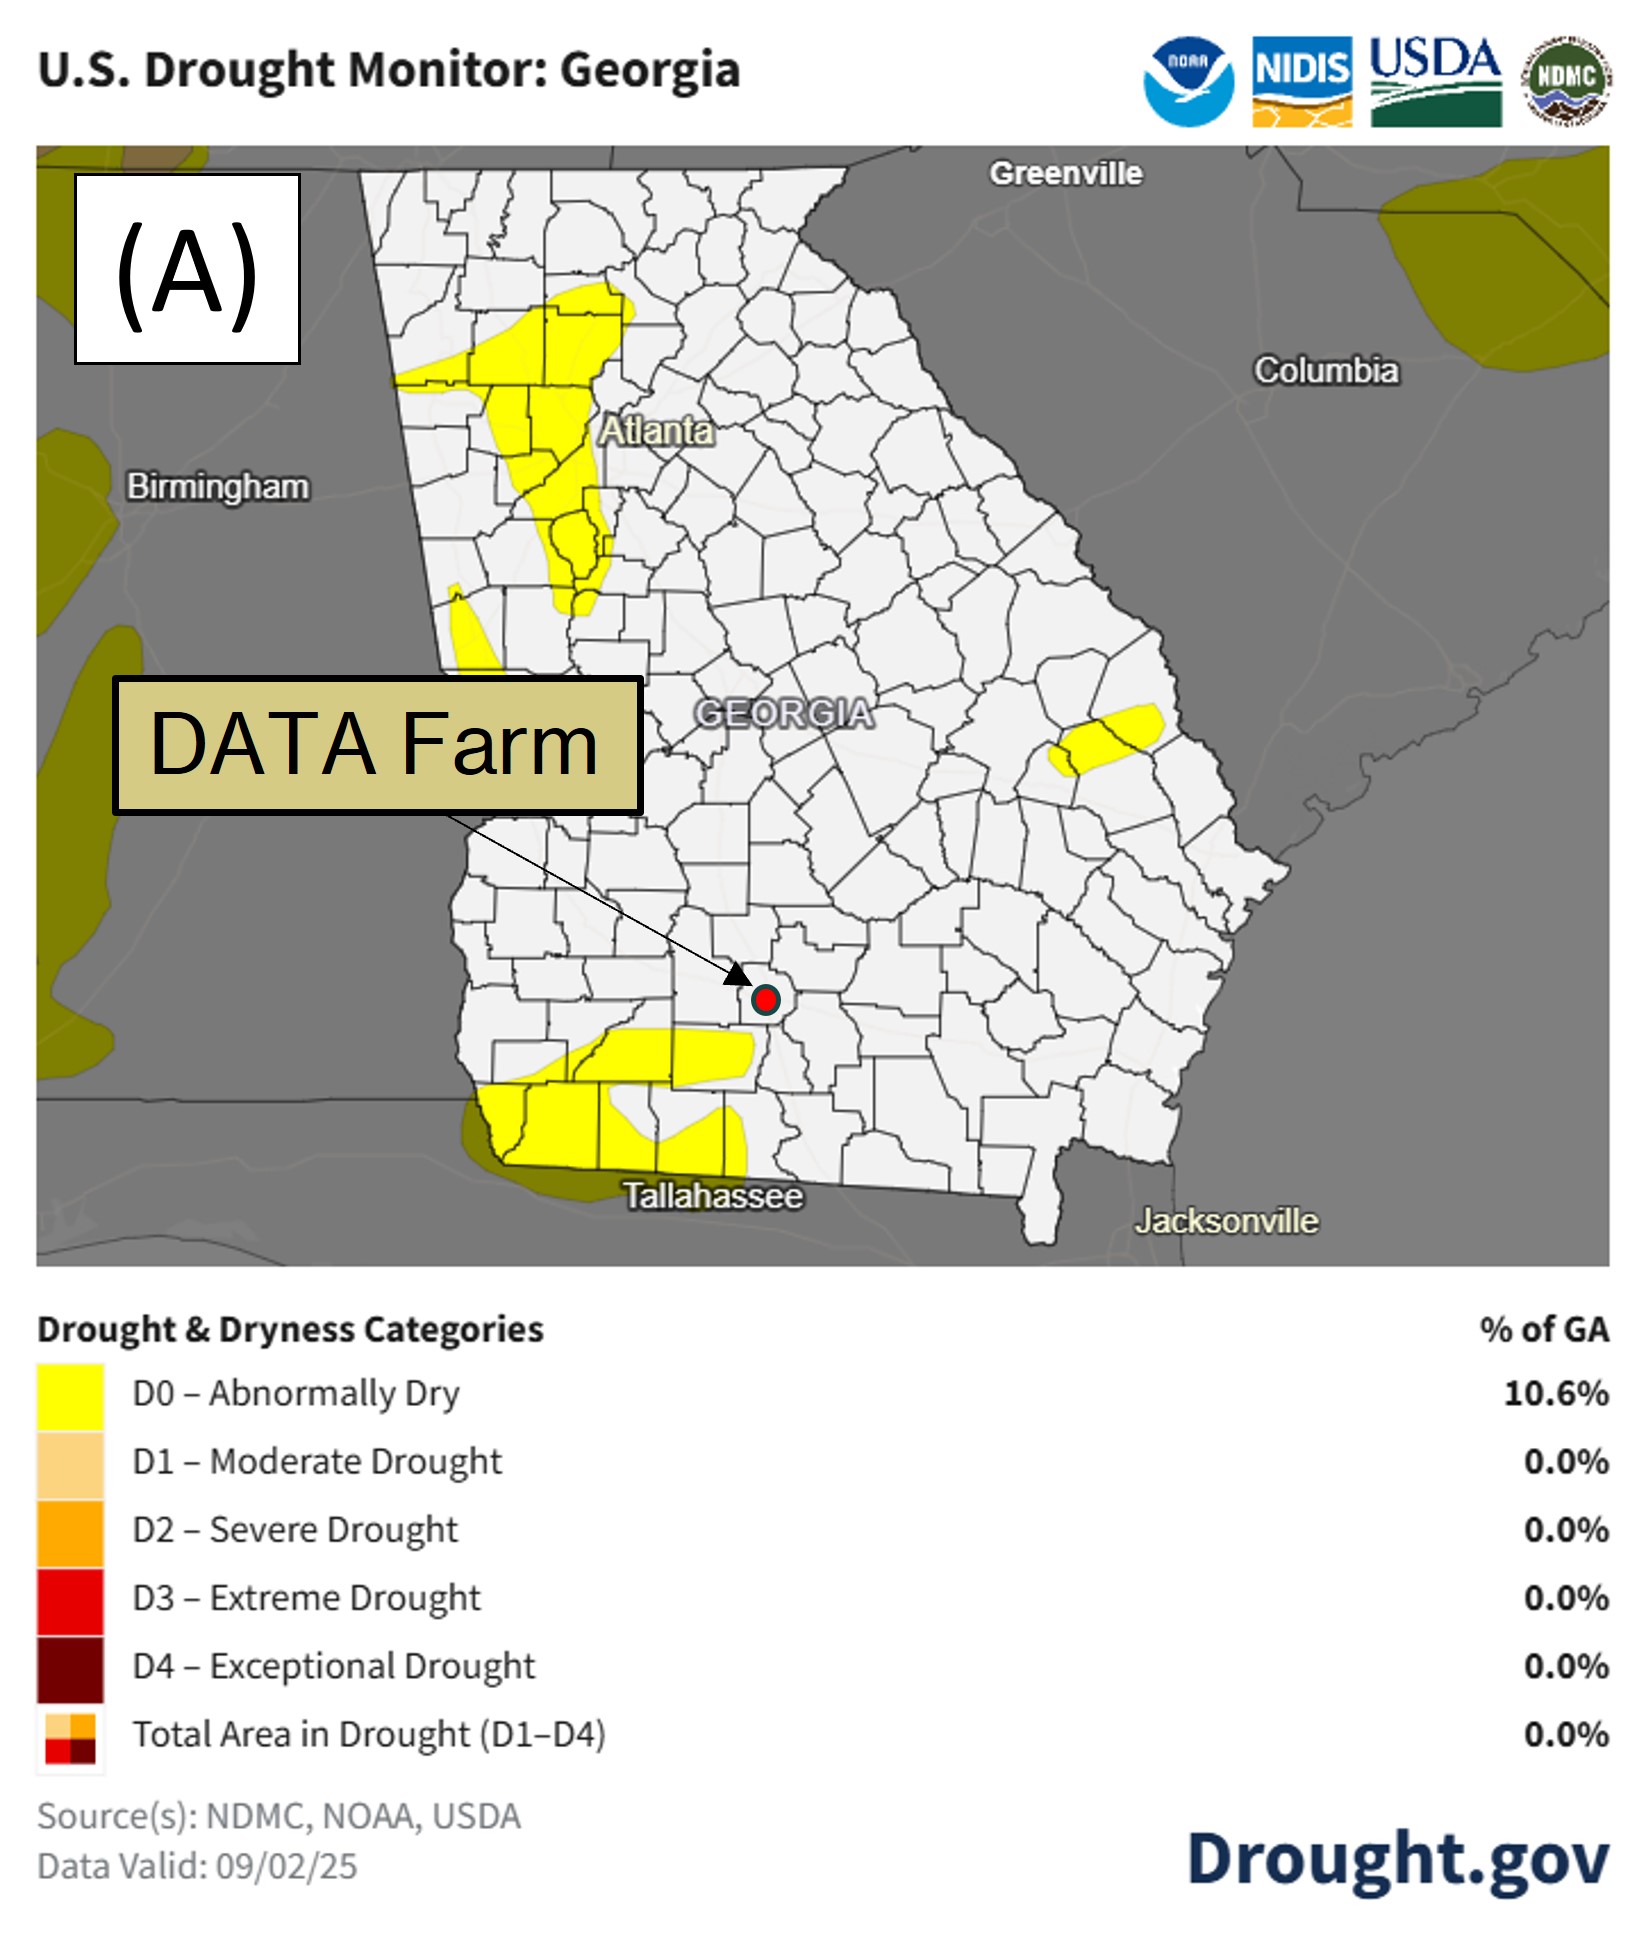
Figure 13A shows the drought monitor map as of September 2nd, from the National Integrated Drought Information System for Georgia. Abnormally dry conditions are present in only 10.6% of the state,with no areas of the state experiencing moderate drought conditions. Figure 13B shows Tift County is not experiencing any drought or dry conditions, but Colquitt Countyto the Southwesthas some abnormally dry areas. Based on this, the above average rainfall during August reversed July’s trend towards drier conditions.
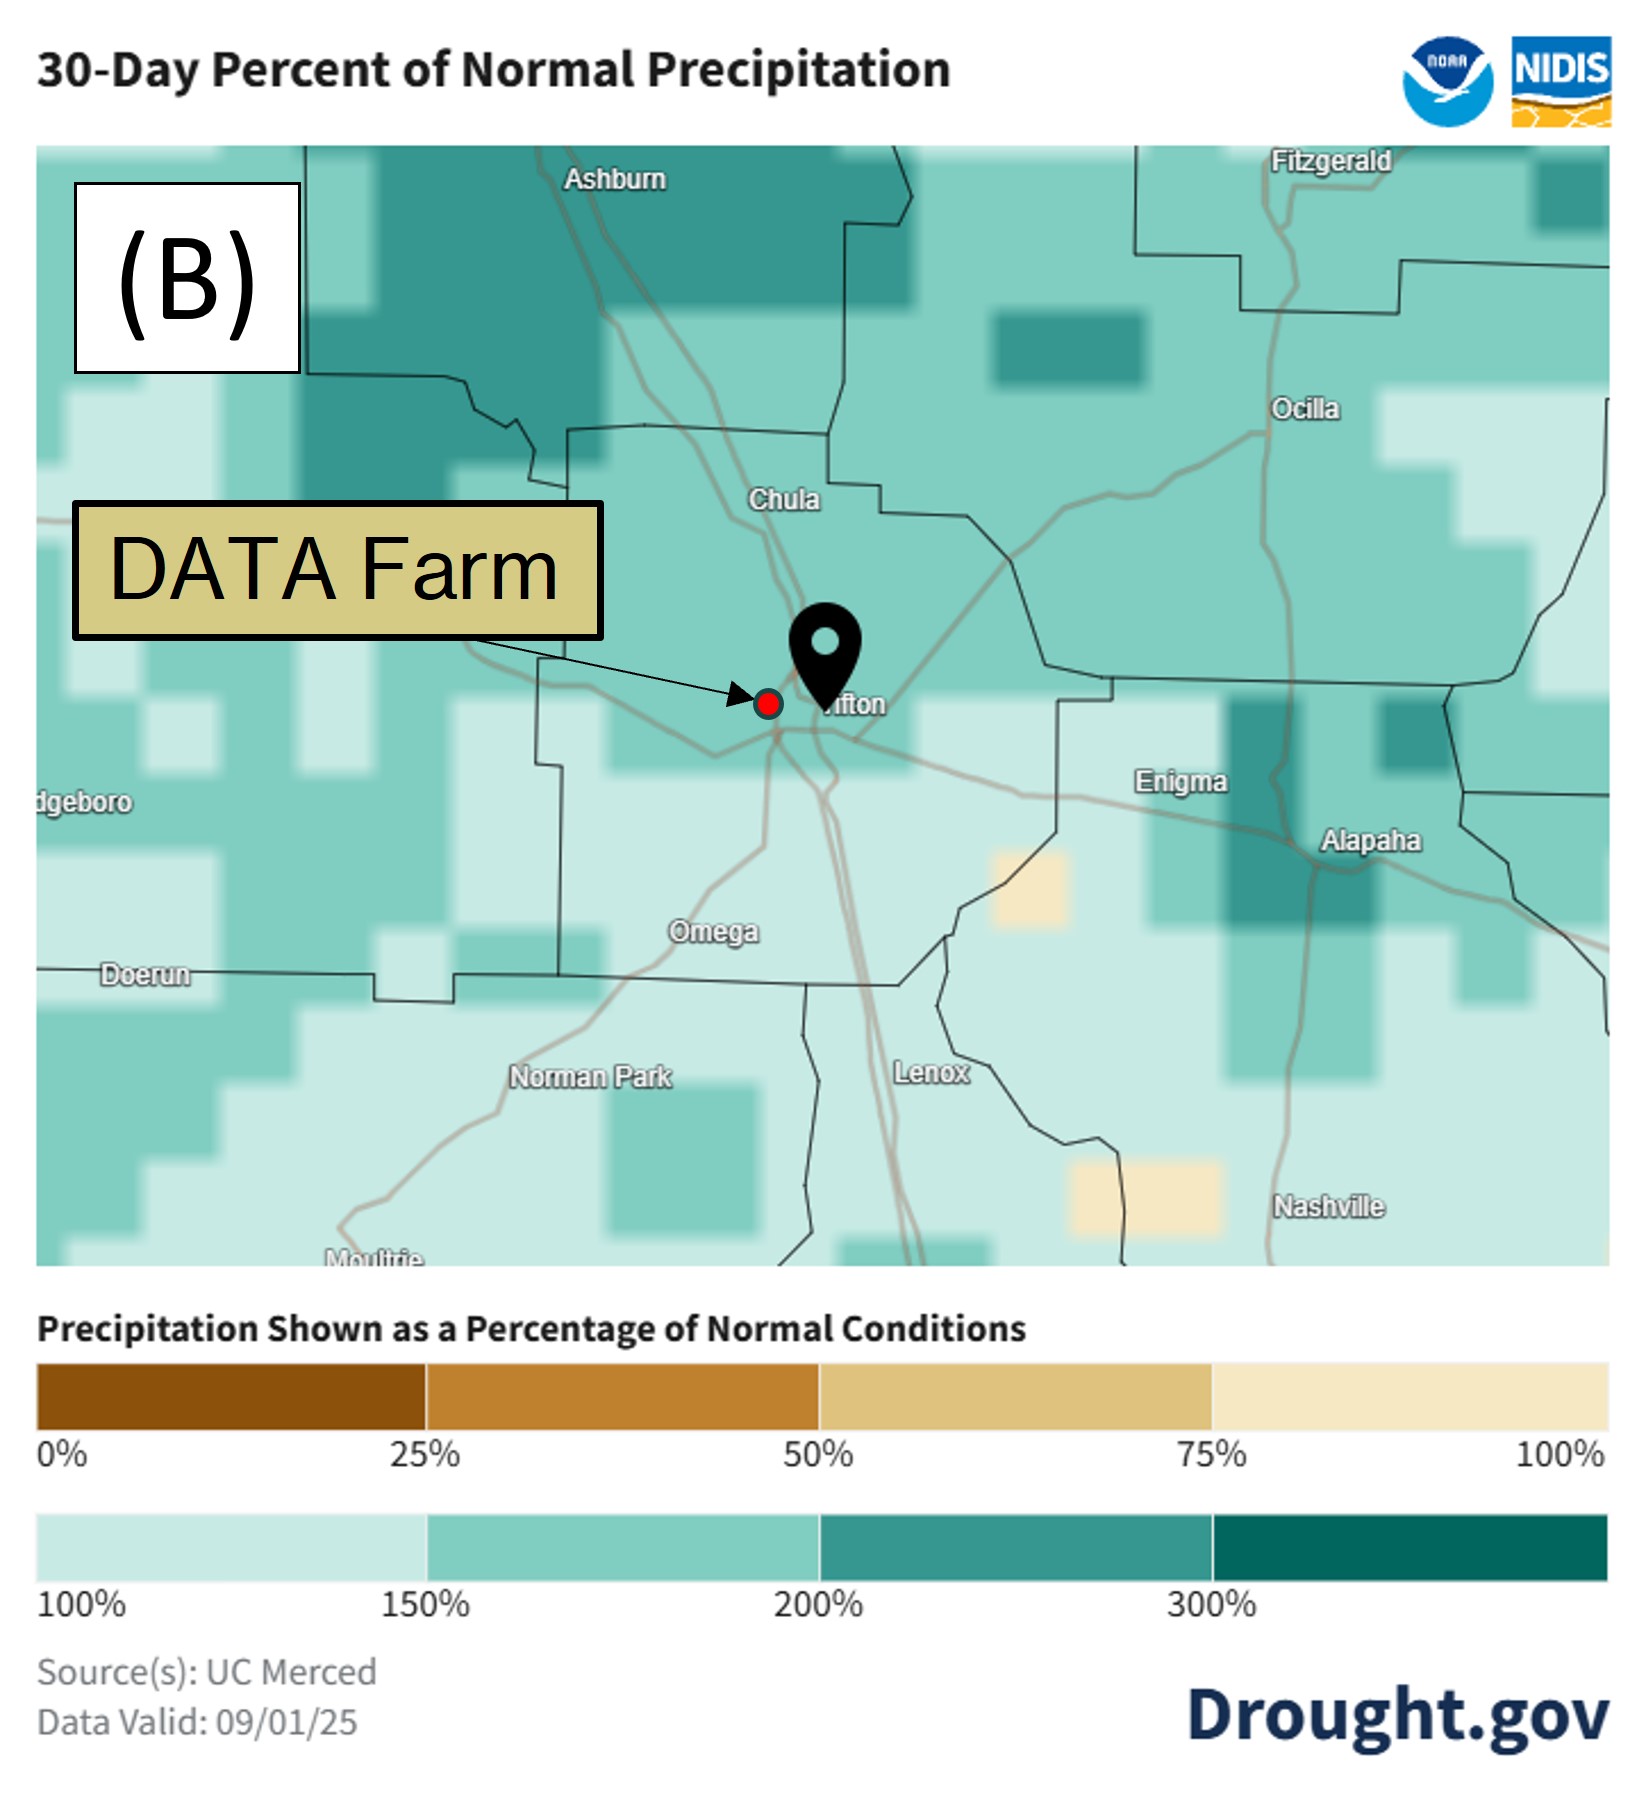
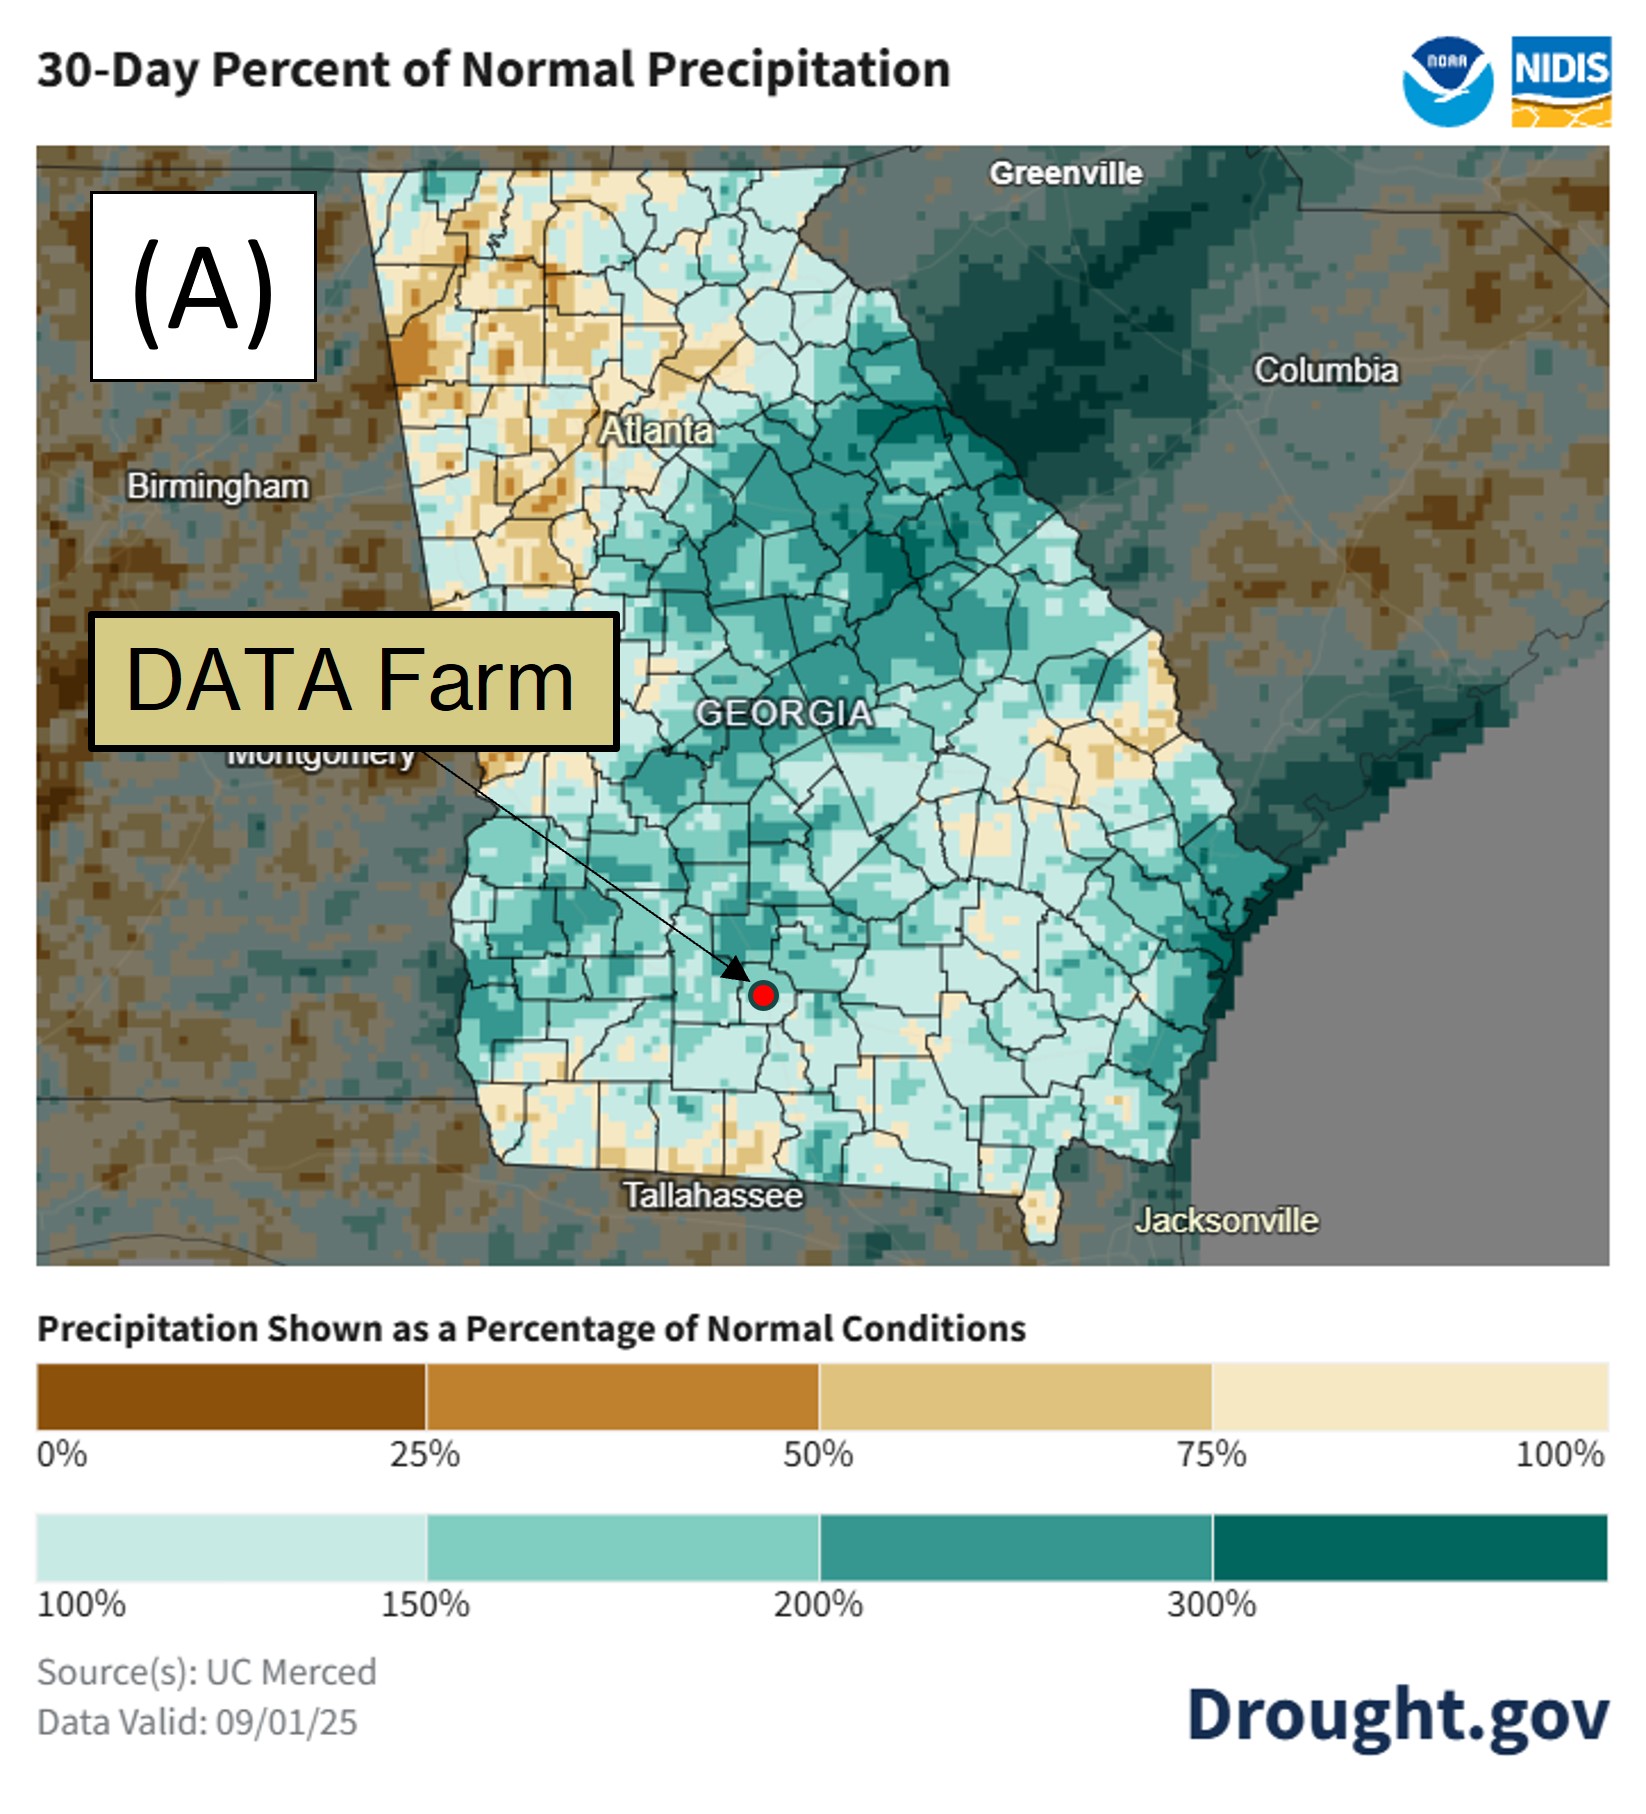
Theimagesin Figure 14show precipitation for the 30 days prior to September 1stfor the state of Georgia (Figure 14A) and the Tift County area (Figure 14B) as a percentage of the historical average (1991–2020) for the same period. These maps show the variation in rainfall received across the state, and that the area around the DATA Farm received aboveaverage rainfall during the previous 30 days. We measured approximately 2.2 inches above average. The regions experiencing lower or higher than average rainfall align with the maps above in Figure 13,showing drought conditions.

