

The warm temperatures and low rainfall in late March created the need for an irrigation application of 0.75” of water to the ryegrass in South Pivot. During the previous 7 days South Pivot only received 0.45” of rainfall and 0.85” of rainfall after the nitrogen application on March 19th.
On April 9th, representatives from Valley Irrigation came out to the DATA Farm to configure the pivot panel Variable Rate Irrigation (VRI). They also trained on how to set up prescription irrigation maps in AgSense 365, Valley’s web platform. During testing of the system, many of the sprinklers were not applying water. A technician discovered that on each of the non-functioning sprinklers, the exhaust tubing for the nozzle valves was clogged from dirt daubers which prevented them from opening. They came back on April 23rd to install a T fitting on each nozzle valve to reduce the chance of dirt daubers clogging the exhaust port.
On Thursday April 17th, the cereal rye cover crop in Front Field, North Pivot, and West Field was sprayed with a burndown herbicide mix to terminate the rye and any weeds present. The herbicides included in the mix were glyphosate (30 oz/ac), 2,4-D (9 oz/ac), and Valor (2 oz/ac). The herbicide mix was applied at a rate of 15 gal/ac using air-inducted twin fan spray tips.
On Friday April 18th, the second cutting of the ryegrass in South Pivot took place. The cut ryegrass was allowed to dry over the weekend, and on April 21st, the cut ryegrass was baled by ABAC’s forage team. The round bales were moved to the ABAC Main Farm where they were wrapped in plastic to seal them for the fermentation process to take place and convert them into silage to feed the cows at ABAC. The second cutting produced 32 bales in South Pivot for a total of 57 bales this season. This season’s result is a 42-bale increase over the 15 bales produced during the 2024 season.
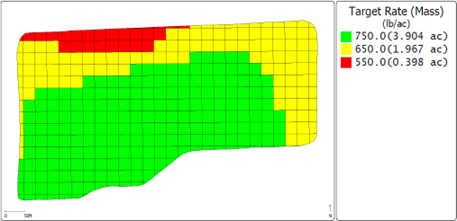
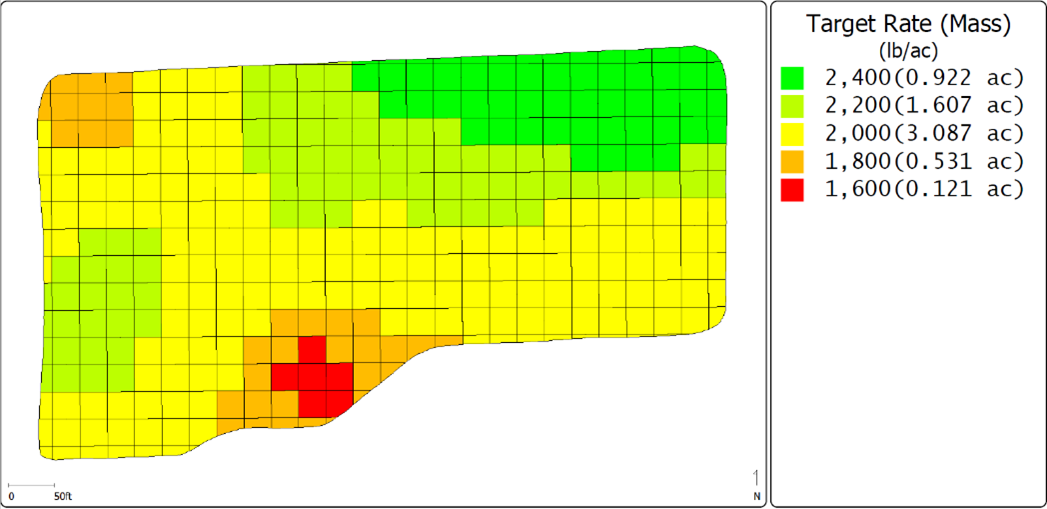
During the 2024 season Dr. Henry Sintim with UGA saw promising yield results from his fertility trials at one of UGA’s Emerging Technology Demonstration Sites (ETDS). The DATA Farm’s Fall 2024 soil results were sent to him for review. He responded that our calcium and potassium base saturations are low. He recommended applying normal lime rates but adding gypsum to increase calcium base saturation without affecting pH. To address the potassium base saturation, he recommended increasing the potash rates. He sent a spreadsheet with recommended rates for lime, gypsum, and potash for each DATA Farm soil sample point. Figure 1 shows the lime prescription for Front Field based on Dr. Sintim’s recommended rates produced using Ag Leader SMS. Lime was already applied based on the UGA Crop Codes at a rate of 1,000 lbs/ac by the time we received his recommendation. Figure 2 shows the recommended gypsum prescription, which will be applied in May. Figure 3 shows the recommended potash prescription, which was applied on April 22nd and 23rd.
Table 1 shows the total amounts of fertilizer and input costs for Dr. Sintim’s rates compared to the UGA Crop Code rates. Similar prescriptions for gypsum and potash were created for North Pivot, South Pivot, and West Field. The detailed prescription maps and cost analysis for each field will be in the crop plan documents to be released in May.
| Method | Lime (lbs) | Lime Cost | Gypsum (lbs) | Gypsum Cost | Potash (lbs) | Potash Cost | Total Cost | Cost Per Acre |
|---|---|---|---|---|---|---|---|---|
| Henry Sintim | 4,247 | $98 | 13,068 | $490 | 1,379 | $302 | $889 | $143 |
| UGA Crop Codes | 6,266 | $144 | 780 | $171 | $315 | $51 |
Table 1. Fertilizer Amounts And Cost For Dr. Sintim’s Recommendation
The monthly temperature trends and rainfall recorded by the on-site weather station for February are shown in Figure 4. Total rainfall was 3.4 inches.

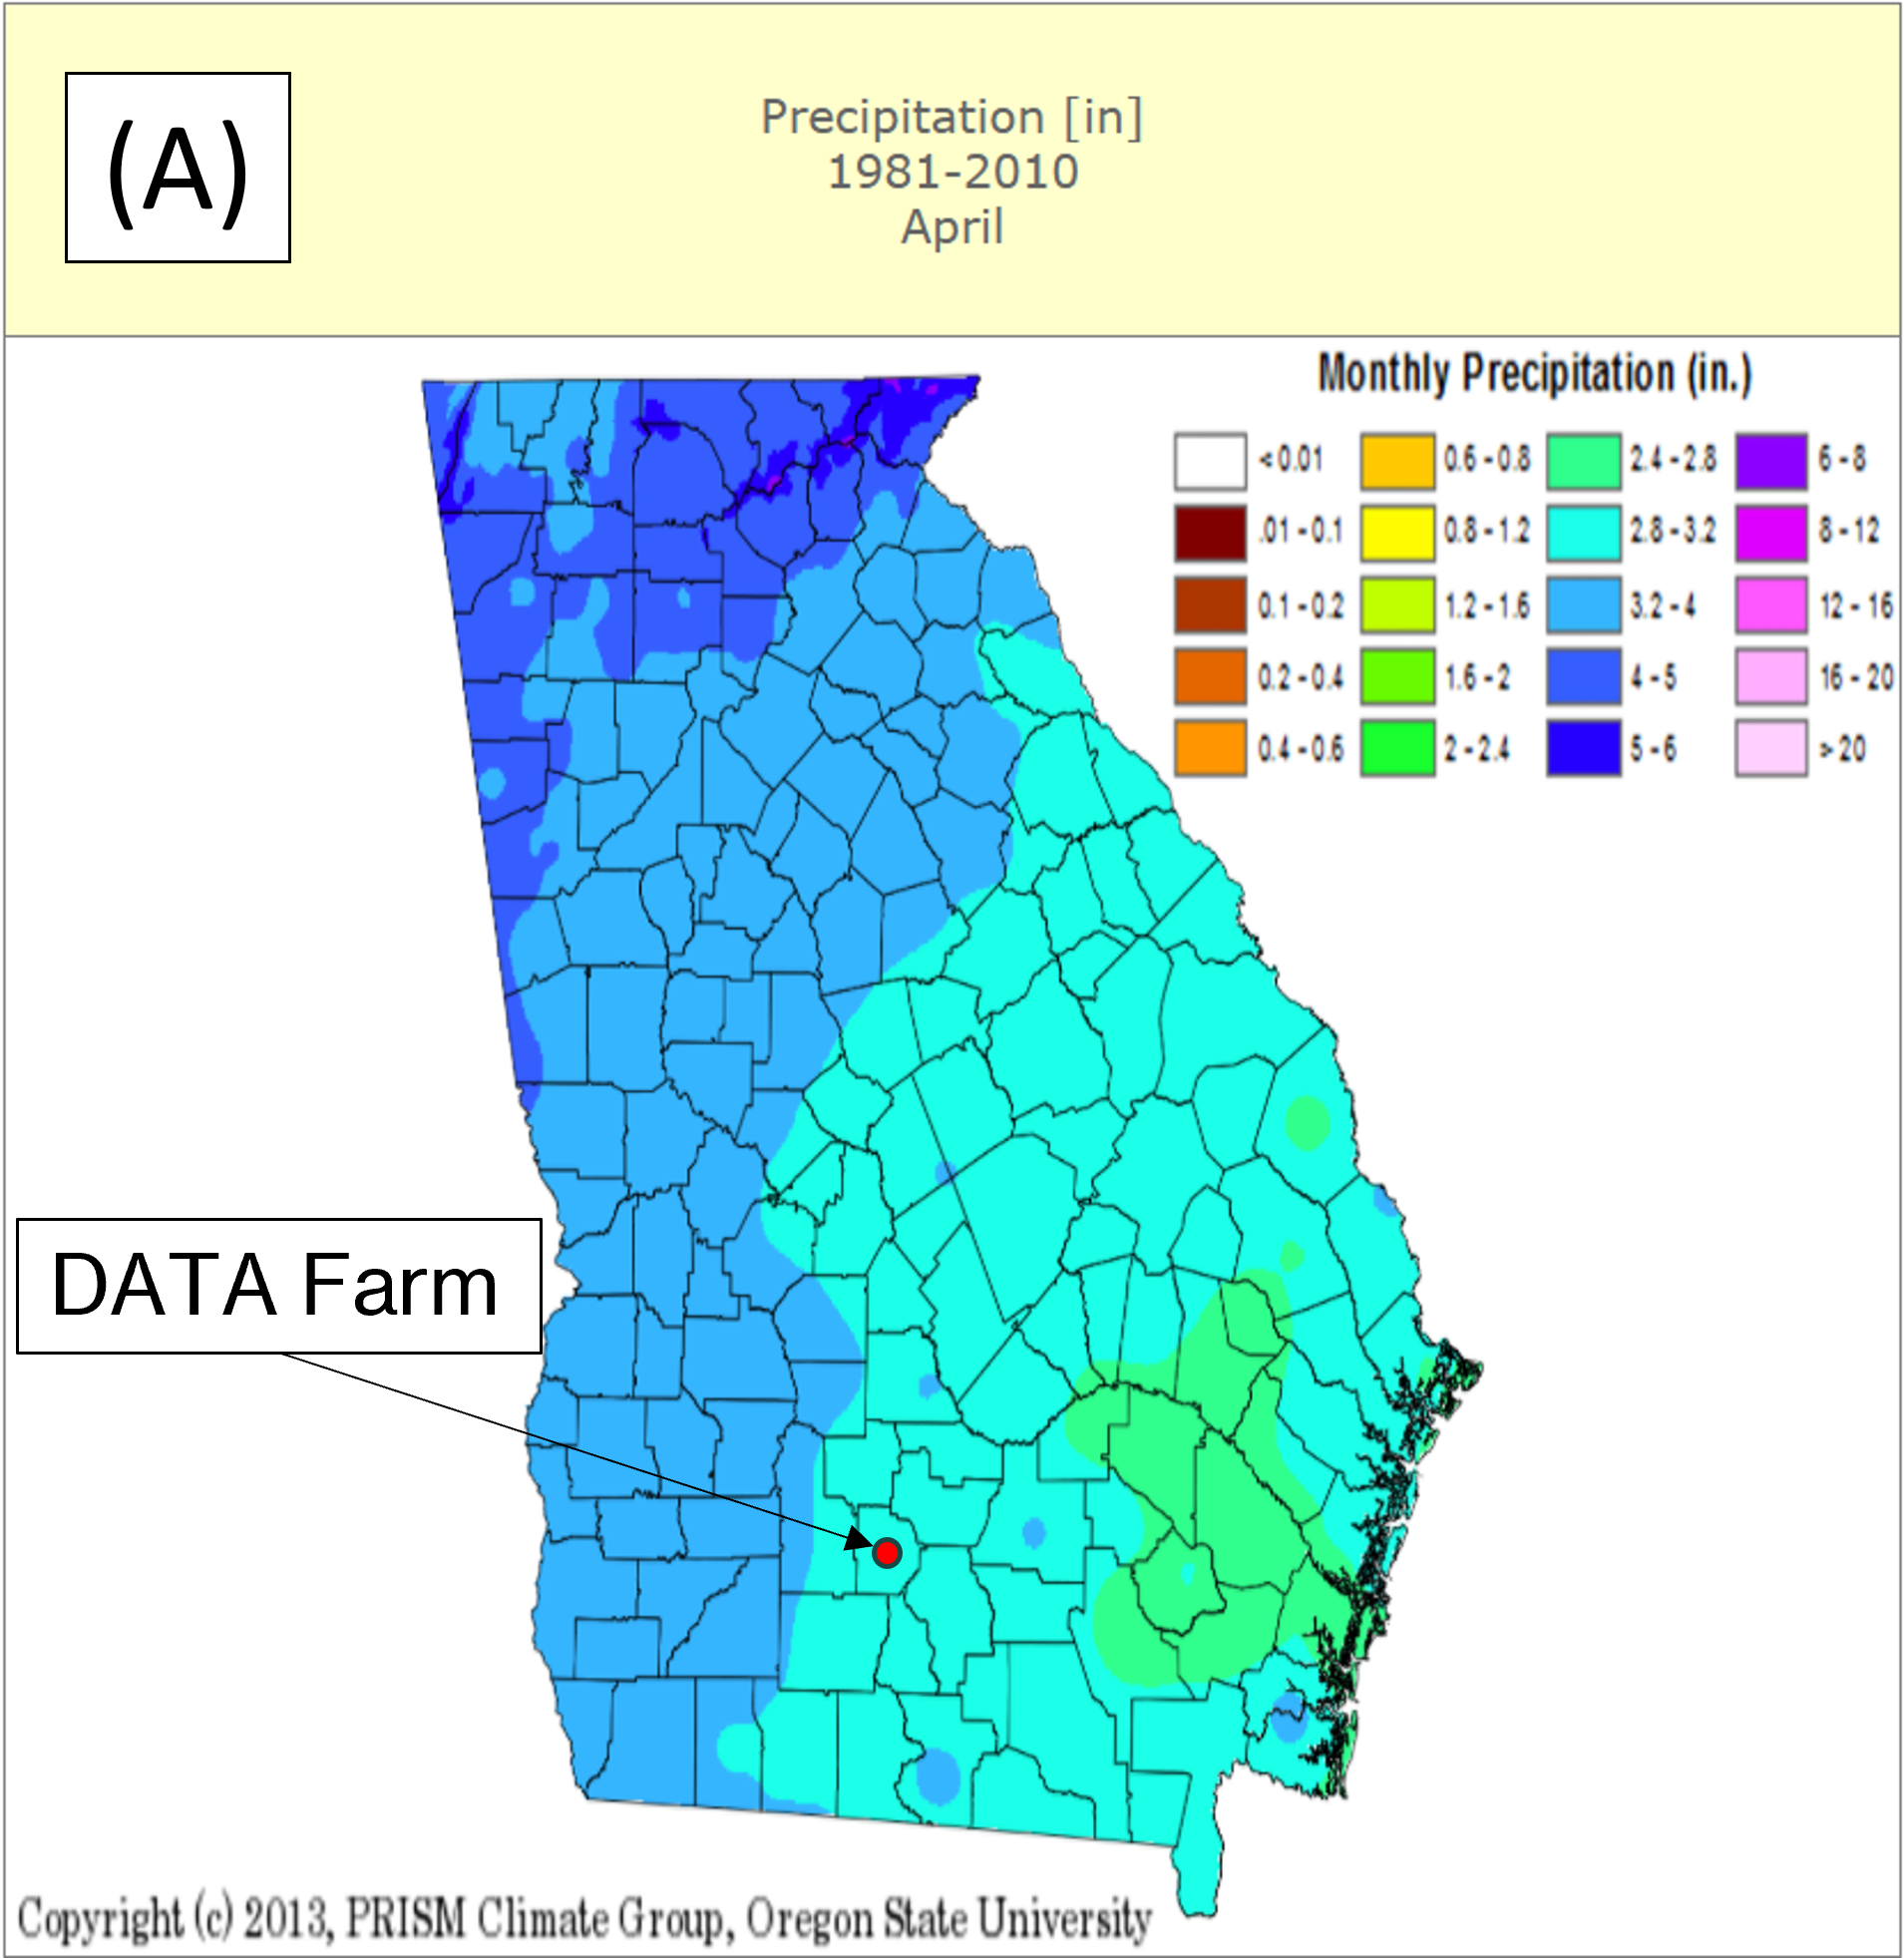
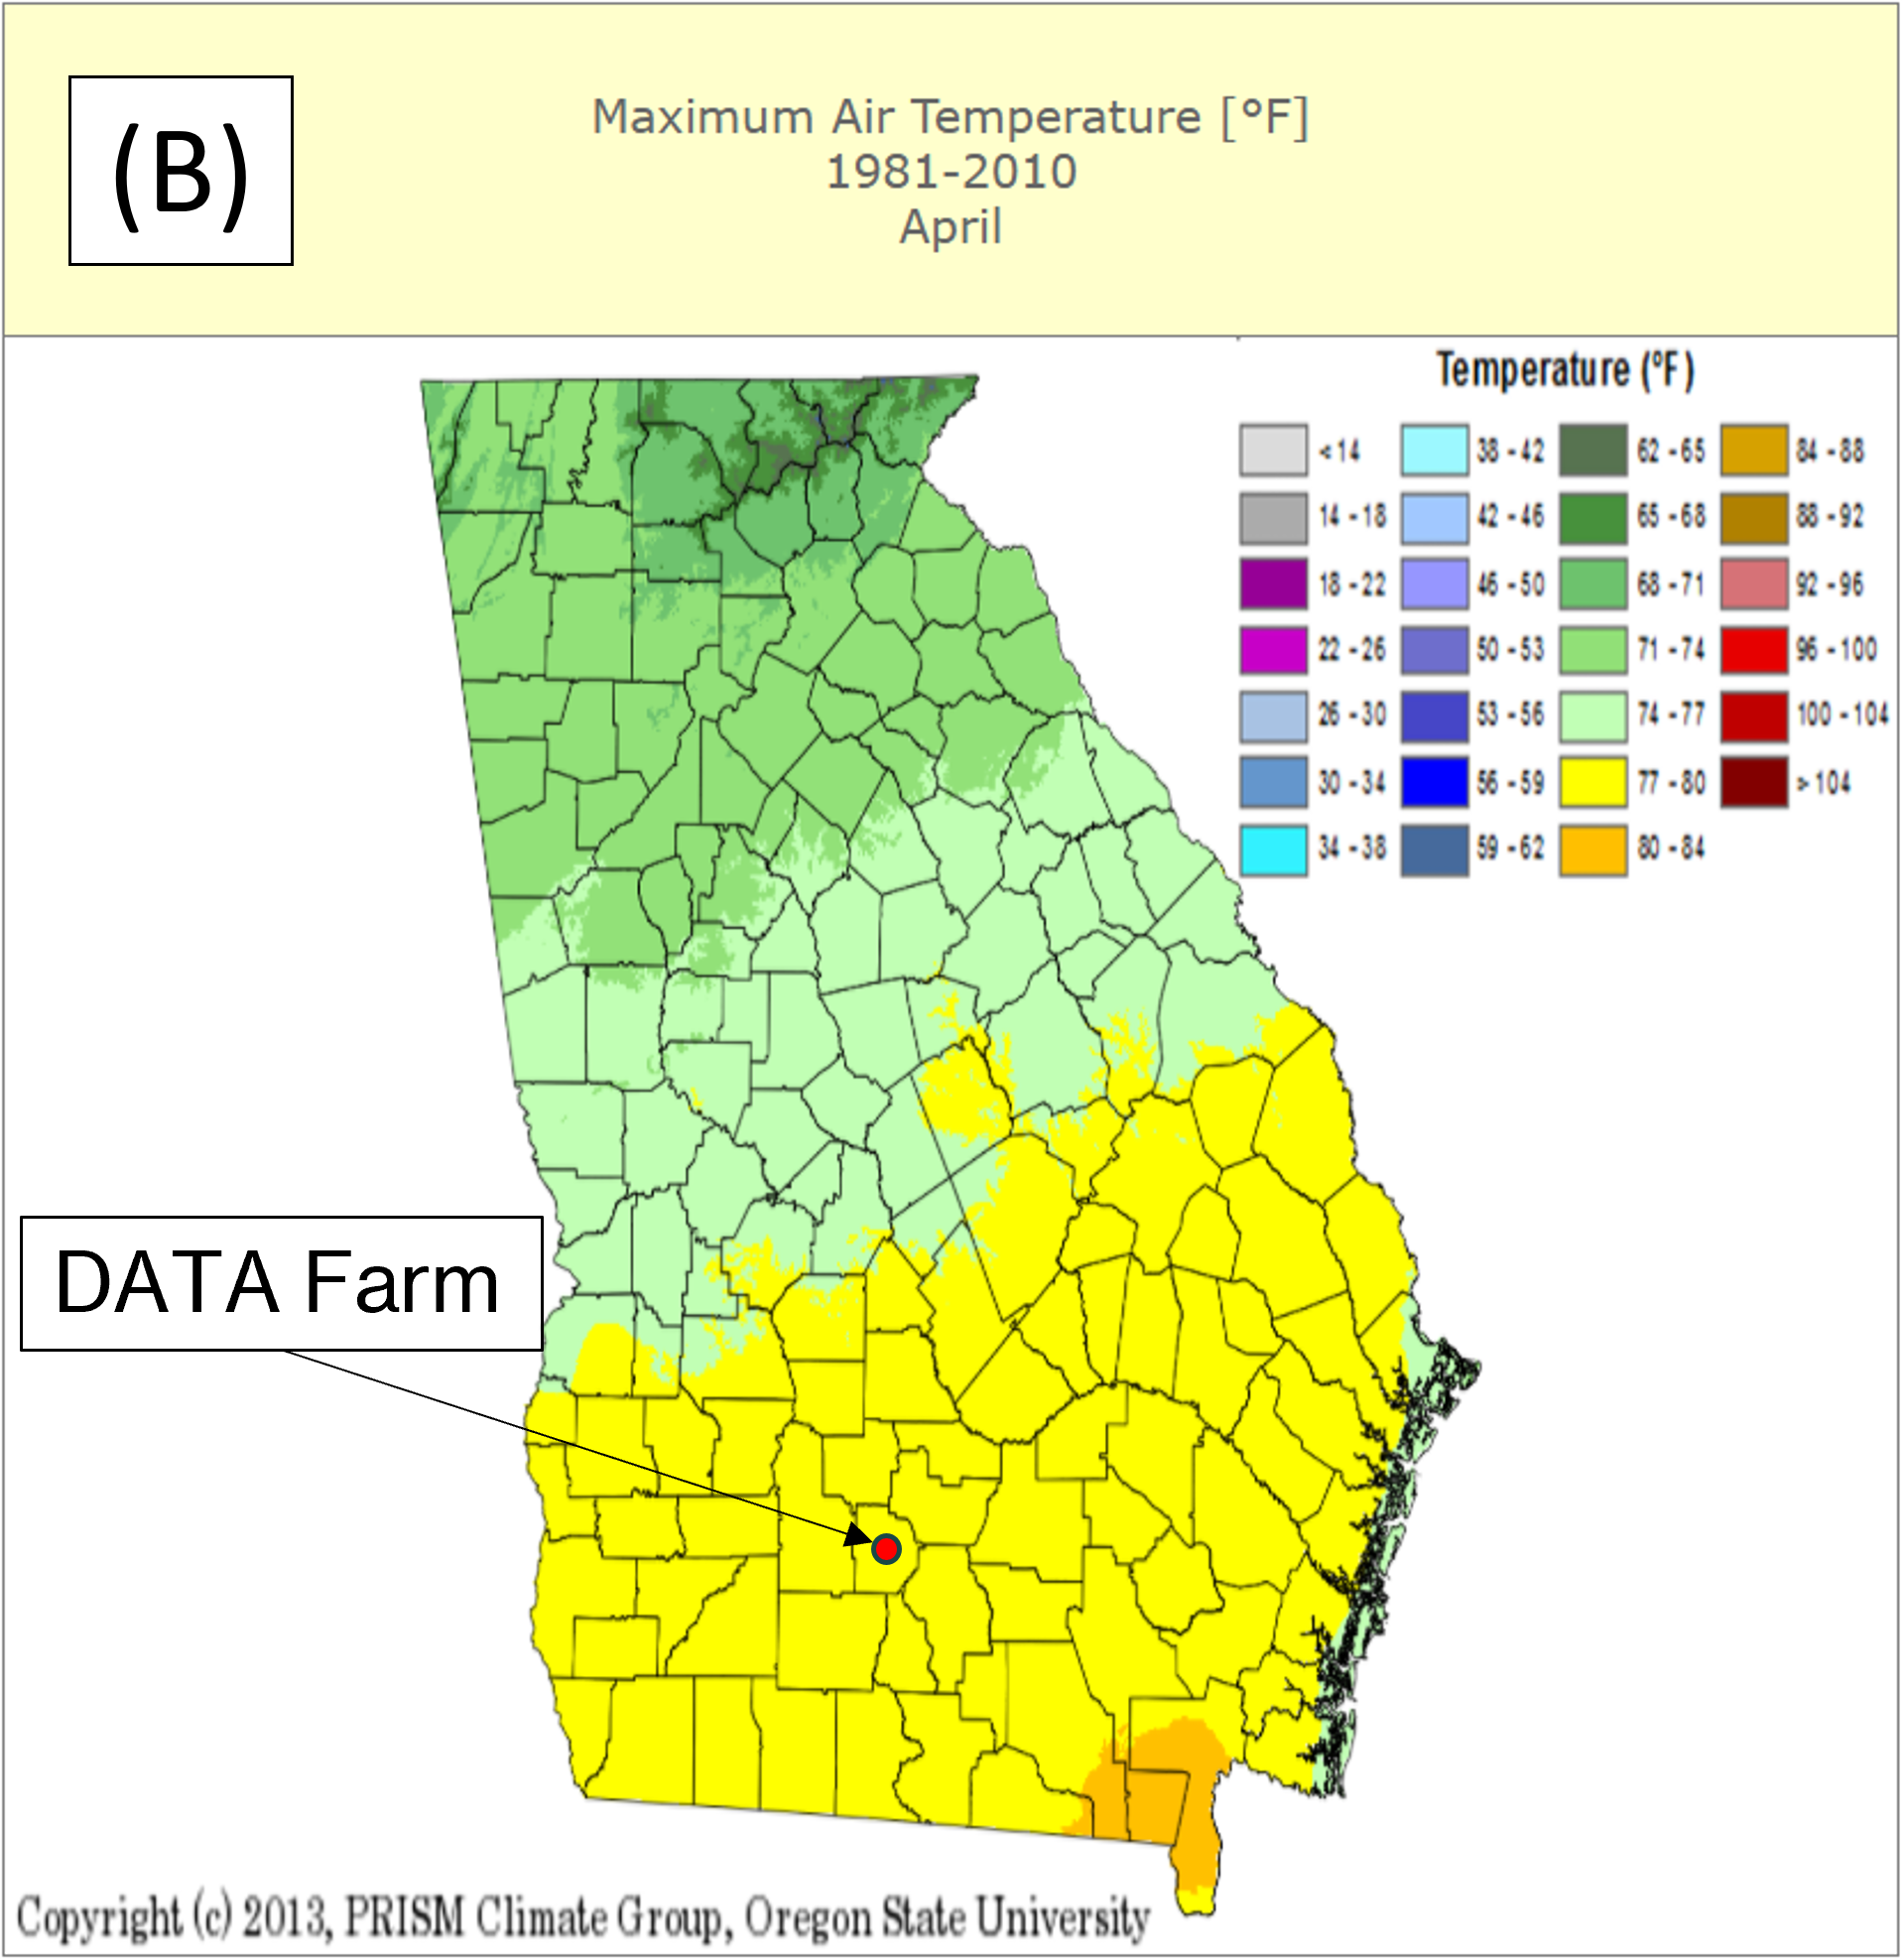
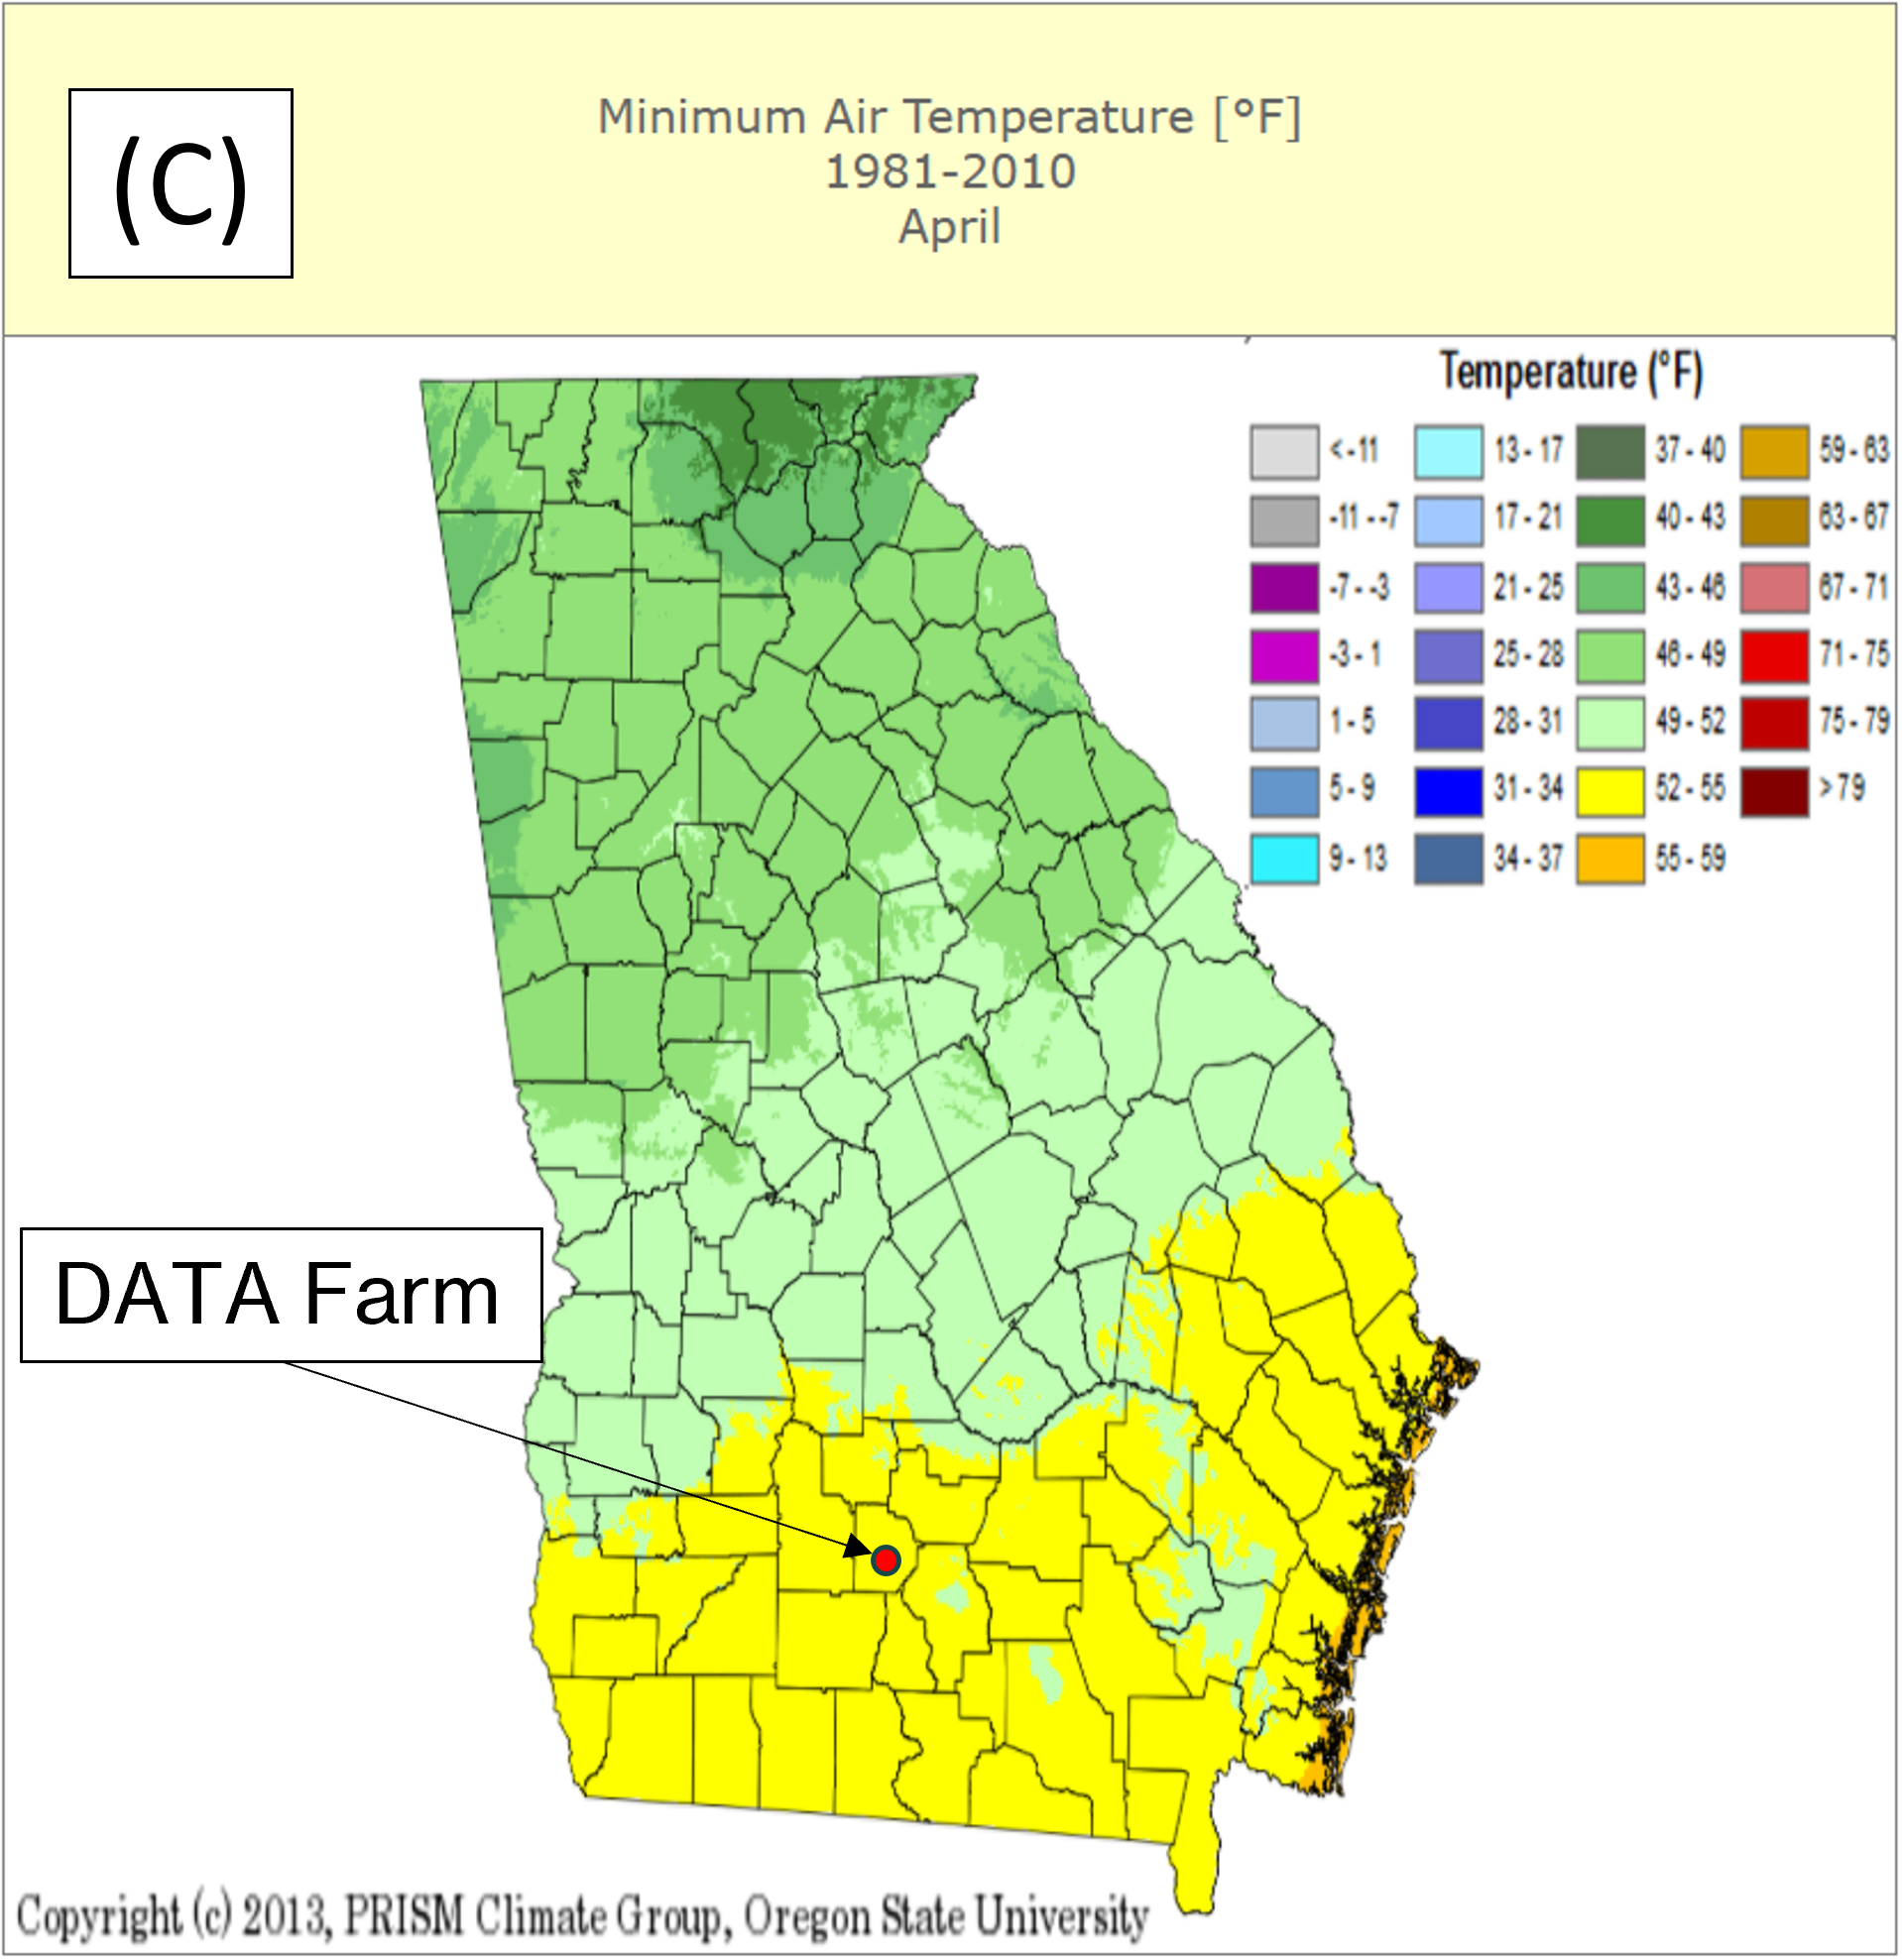
For comparison, Georgia climate maps based on data from 1981 to 2010 (UGA’s Weather Network) are shown in Figure 5 for the month of April for historical reference. The rainfall recorded at the DATA Farm during April is just above the average (2.8 to 3.2 inches) for this period. However, 2.5 inches that occurred early in the month accounts for 73% of the month’s rainfall. This has resulted in abnormally dry conditions that continue to persist in our area. The target plant date of May 1st for cotton was altered due to the dry conditions and weather forecast showing no rain for the first week of May. One of the fields planned for cotton has irrigation capabilities but we decided to wait to plant the irrigated and dryland cotton fields at the same time. This will keep field operation timing consistent during the season. The average of recorded maximum temperatures for the month was 82°F which is slightly above the average historical range (Figure 5B), and the average of recorded minimum temperatures was 70°F which is significantly higher than the average historical range (Figure 5C).
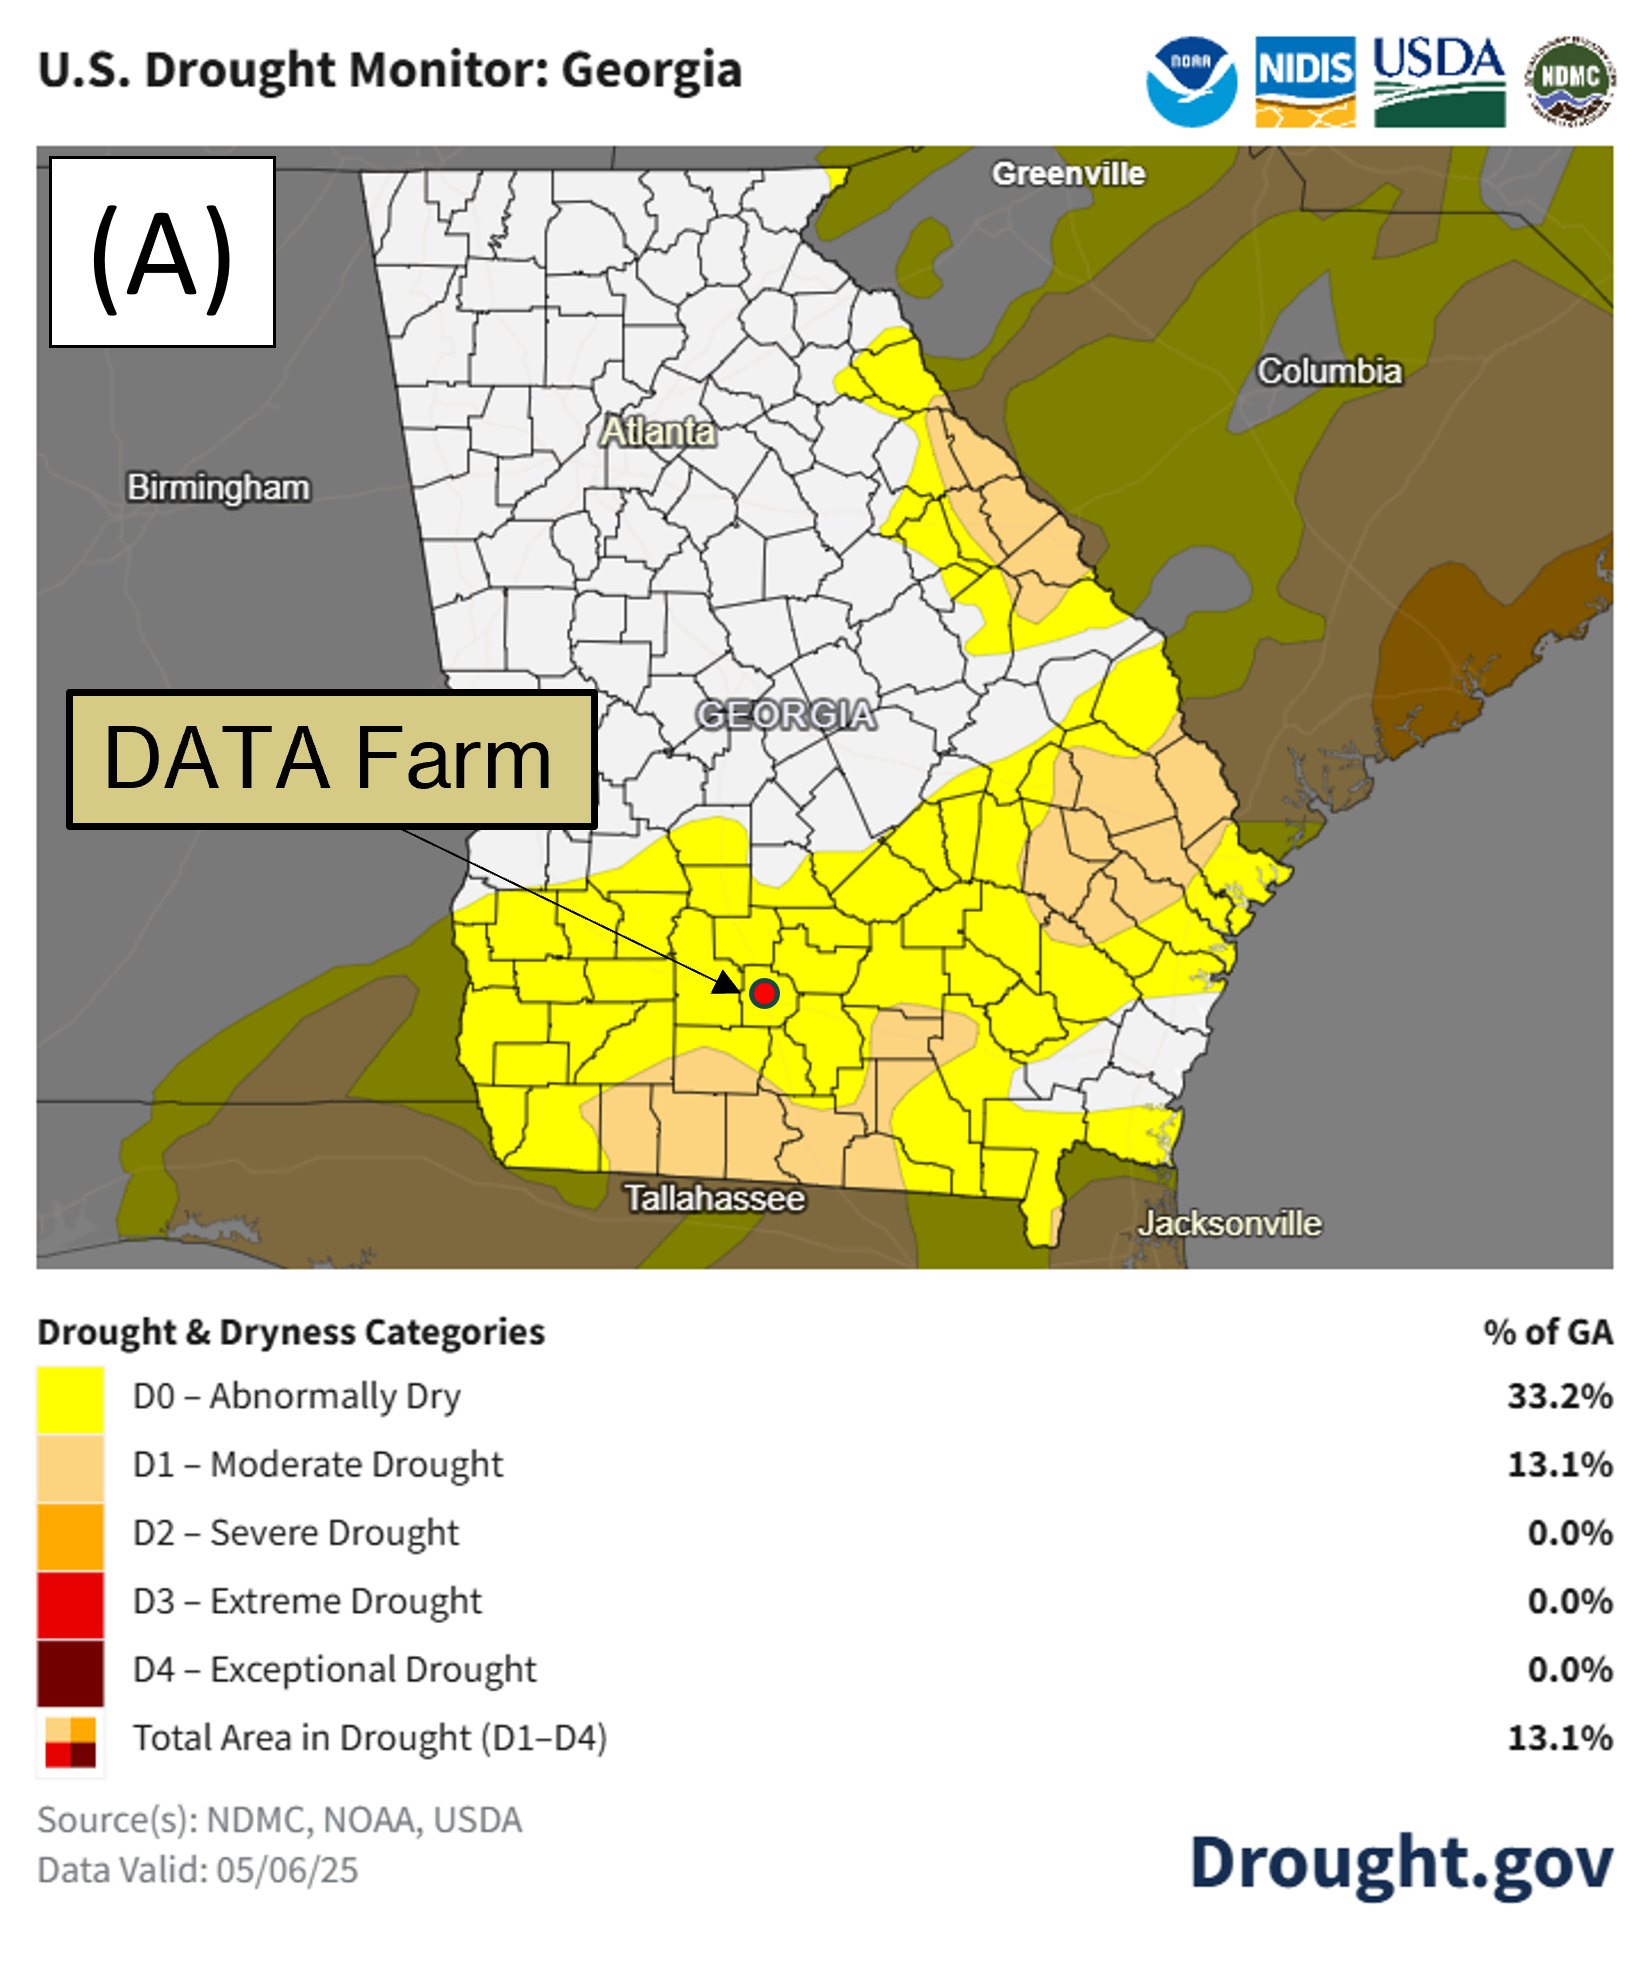
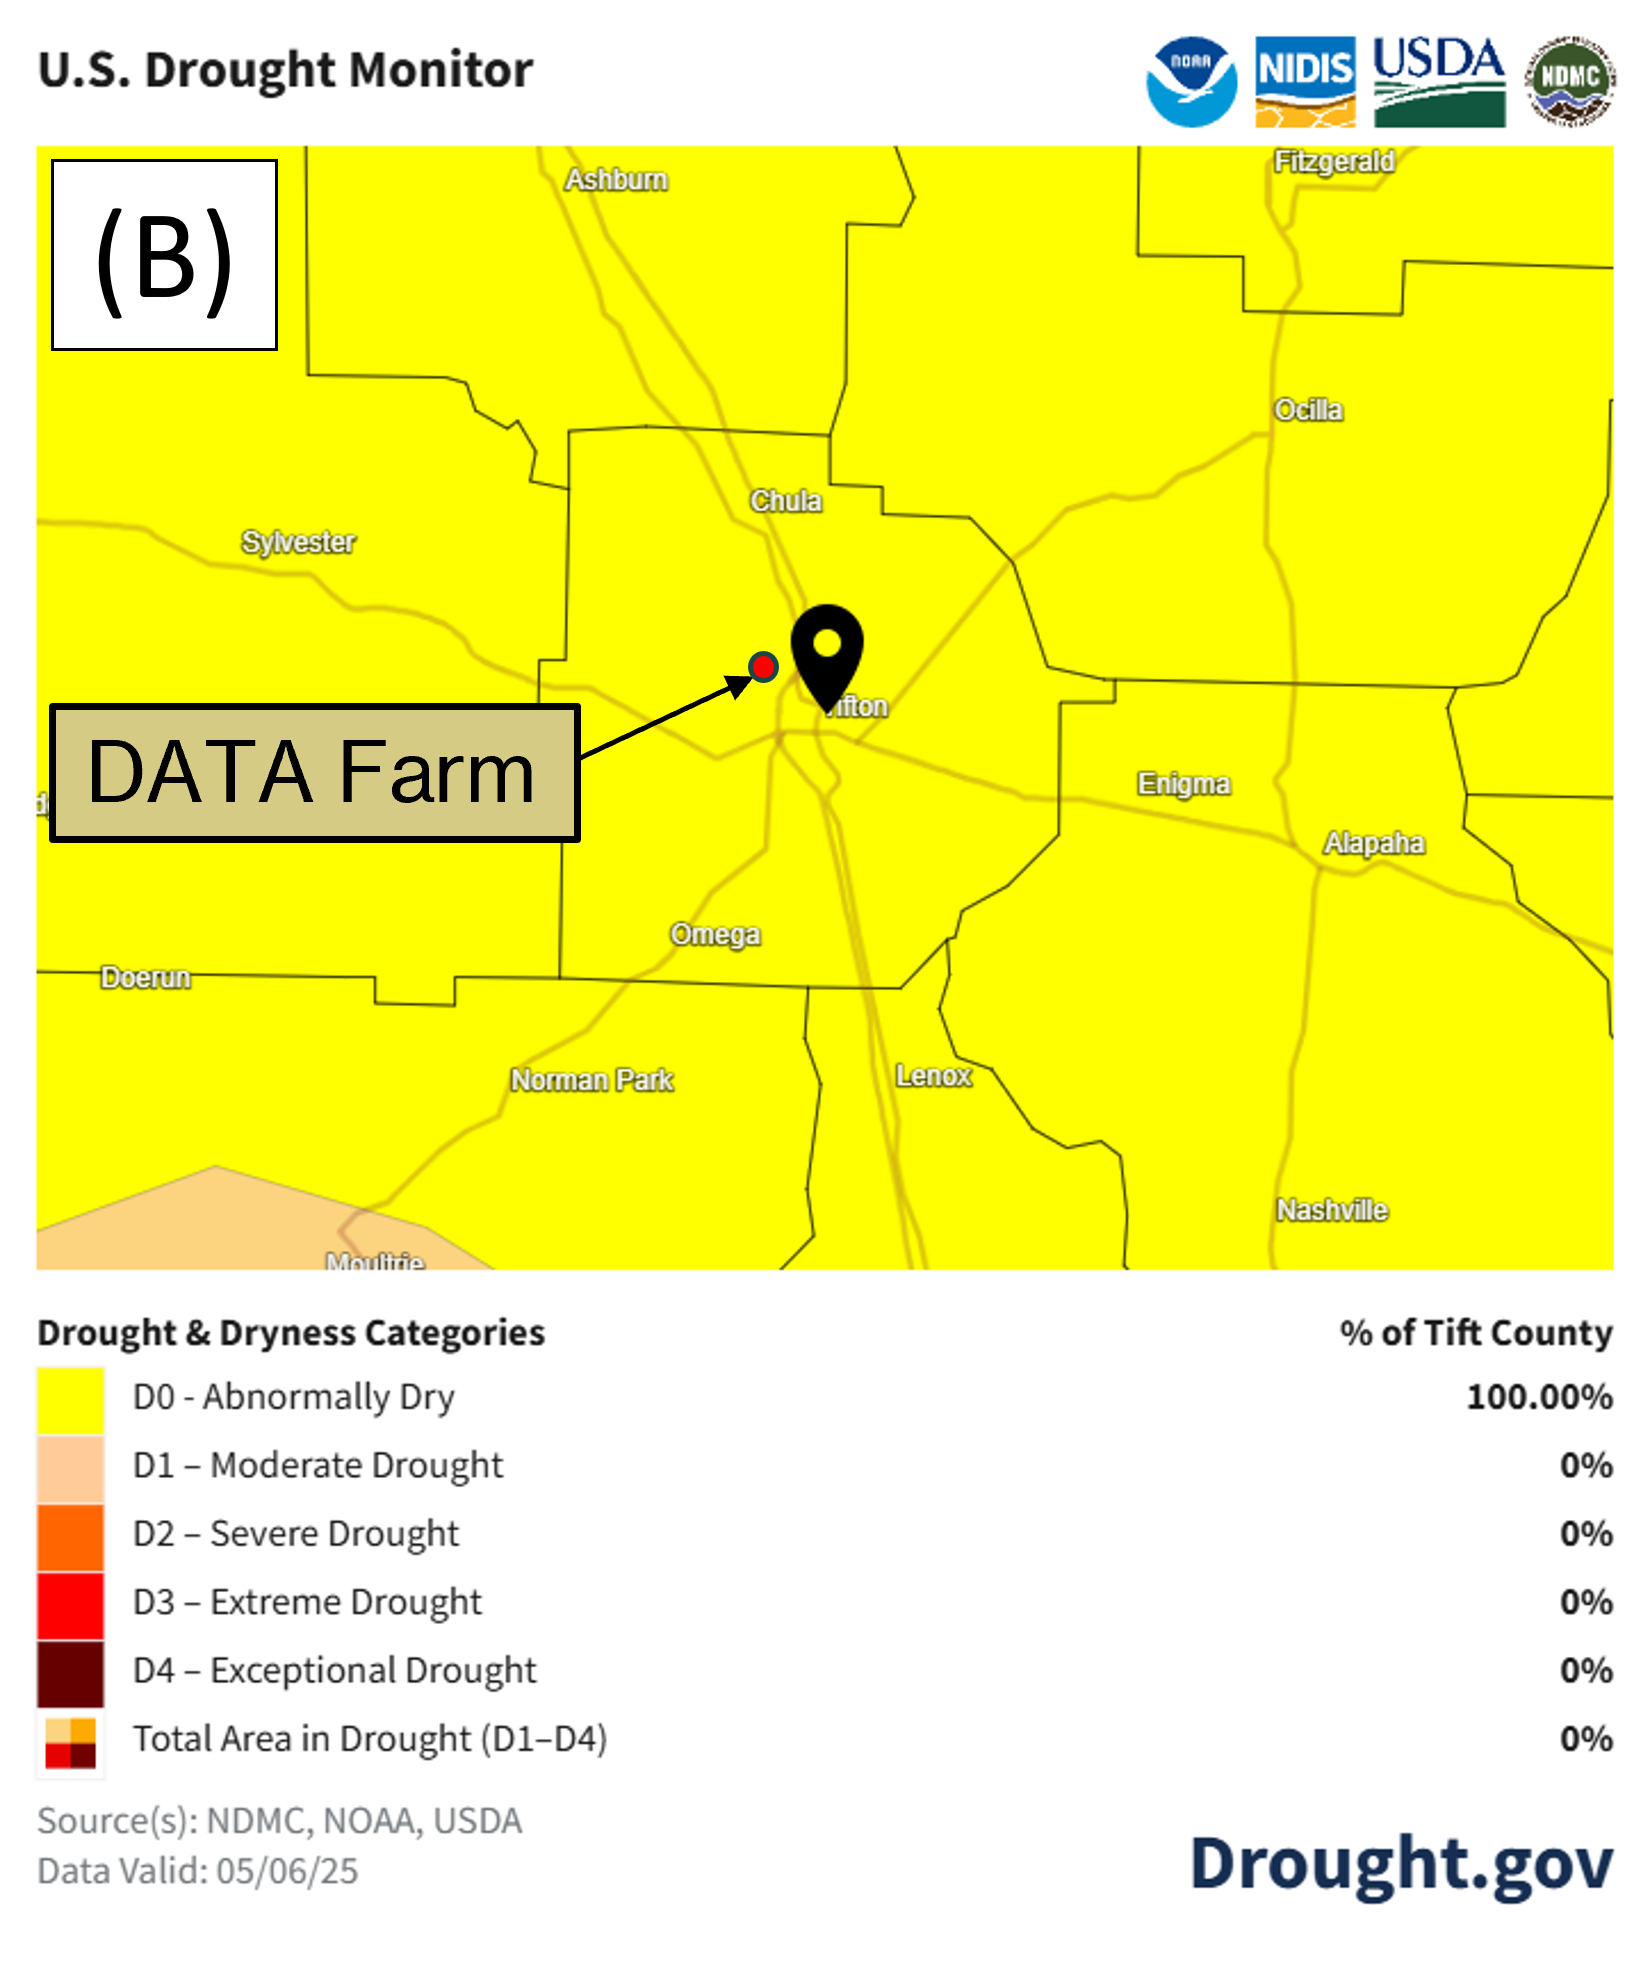
Figure 6A shows the drought monitor map as of May 6th, from the National Integrated Drought Information System for Georgia. Abnormally dry conditions are present in 33.2% of the state and moderate drought conditions decreased from 25.4% of the state on March 25th to 13.1%. Figure 6B shows drought conditions for Tift County where the 4D Farm is located. The entire county is now in mostly the abnormally dry (100%) range and no areas in the county are in the moderate drought range.
The following sections list tasks performed during the month of April in each field. All four fields received fertilizer applications and herbicide application in preparation for planting the 2025 row crops in May.
Operations:
Subscribe to get the latest posts sent to your email.