Front Field – Crop: Dryland Peanuts, 86 DAP, 2190 GDU’s, pegging and peanuts developing
North Pivot – Crop: Irrigated Field Corn, 159 DAP, harvested 8/27/2024
South Pivot – Crop: Irrigated Cotton, 107 DAP, 2219 GDU’s, first bolls opened 8/26/2024
West Field – Crop: Dryland Peanuts, 86 DAP, 2190 GDU’s, pegging and peanuts developing
Recent Activities
May, June, July, and August were busy months at the DATA Farm. In May, cotton was planted in South Pivot, but unfortunately, over the following four weeks, the DATA Farm received 6 inches of rain, which delayed planting peanuts until June. Despite the continual rain during May, cover crop residue and reduced tillage kept soil erosion to a minimum. After the peanuts were planted in the first week of June, the weather turned hot and dry. Figure 1 shows the daily average temperature, maximum temperature, minimum temperature, and rainfall (1.6 inches total during June) for the month of June. The North Pivot soil moisture sensors reached the trigger point for irrigation of 30 kPa on June 3rd for the first time as the corn began to tassel. Before this point, the farm received 19.24” of rainfall after planting the corn. Operations in July and August mostly were irrigation and spraying.
The following sections give a brief update on each field with images of the crop in its current growth stage. A graph showing projected income and operational costs for each field is included. The operational and input costs are logged for each field event with the current market price of that crop at the time of the operation. Projected incomes are calculated as the current market price at an operations date and the management yield goal.
Figure 1: June 2024 rainfall and temperature measured at the DATA Farm
Front Field
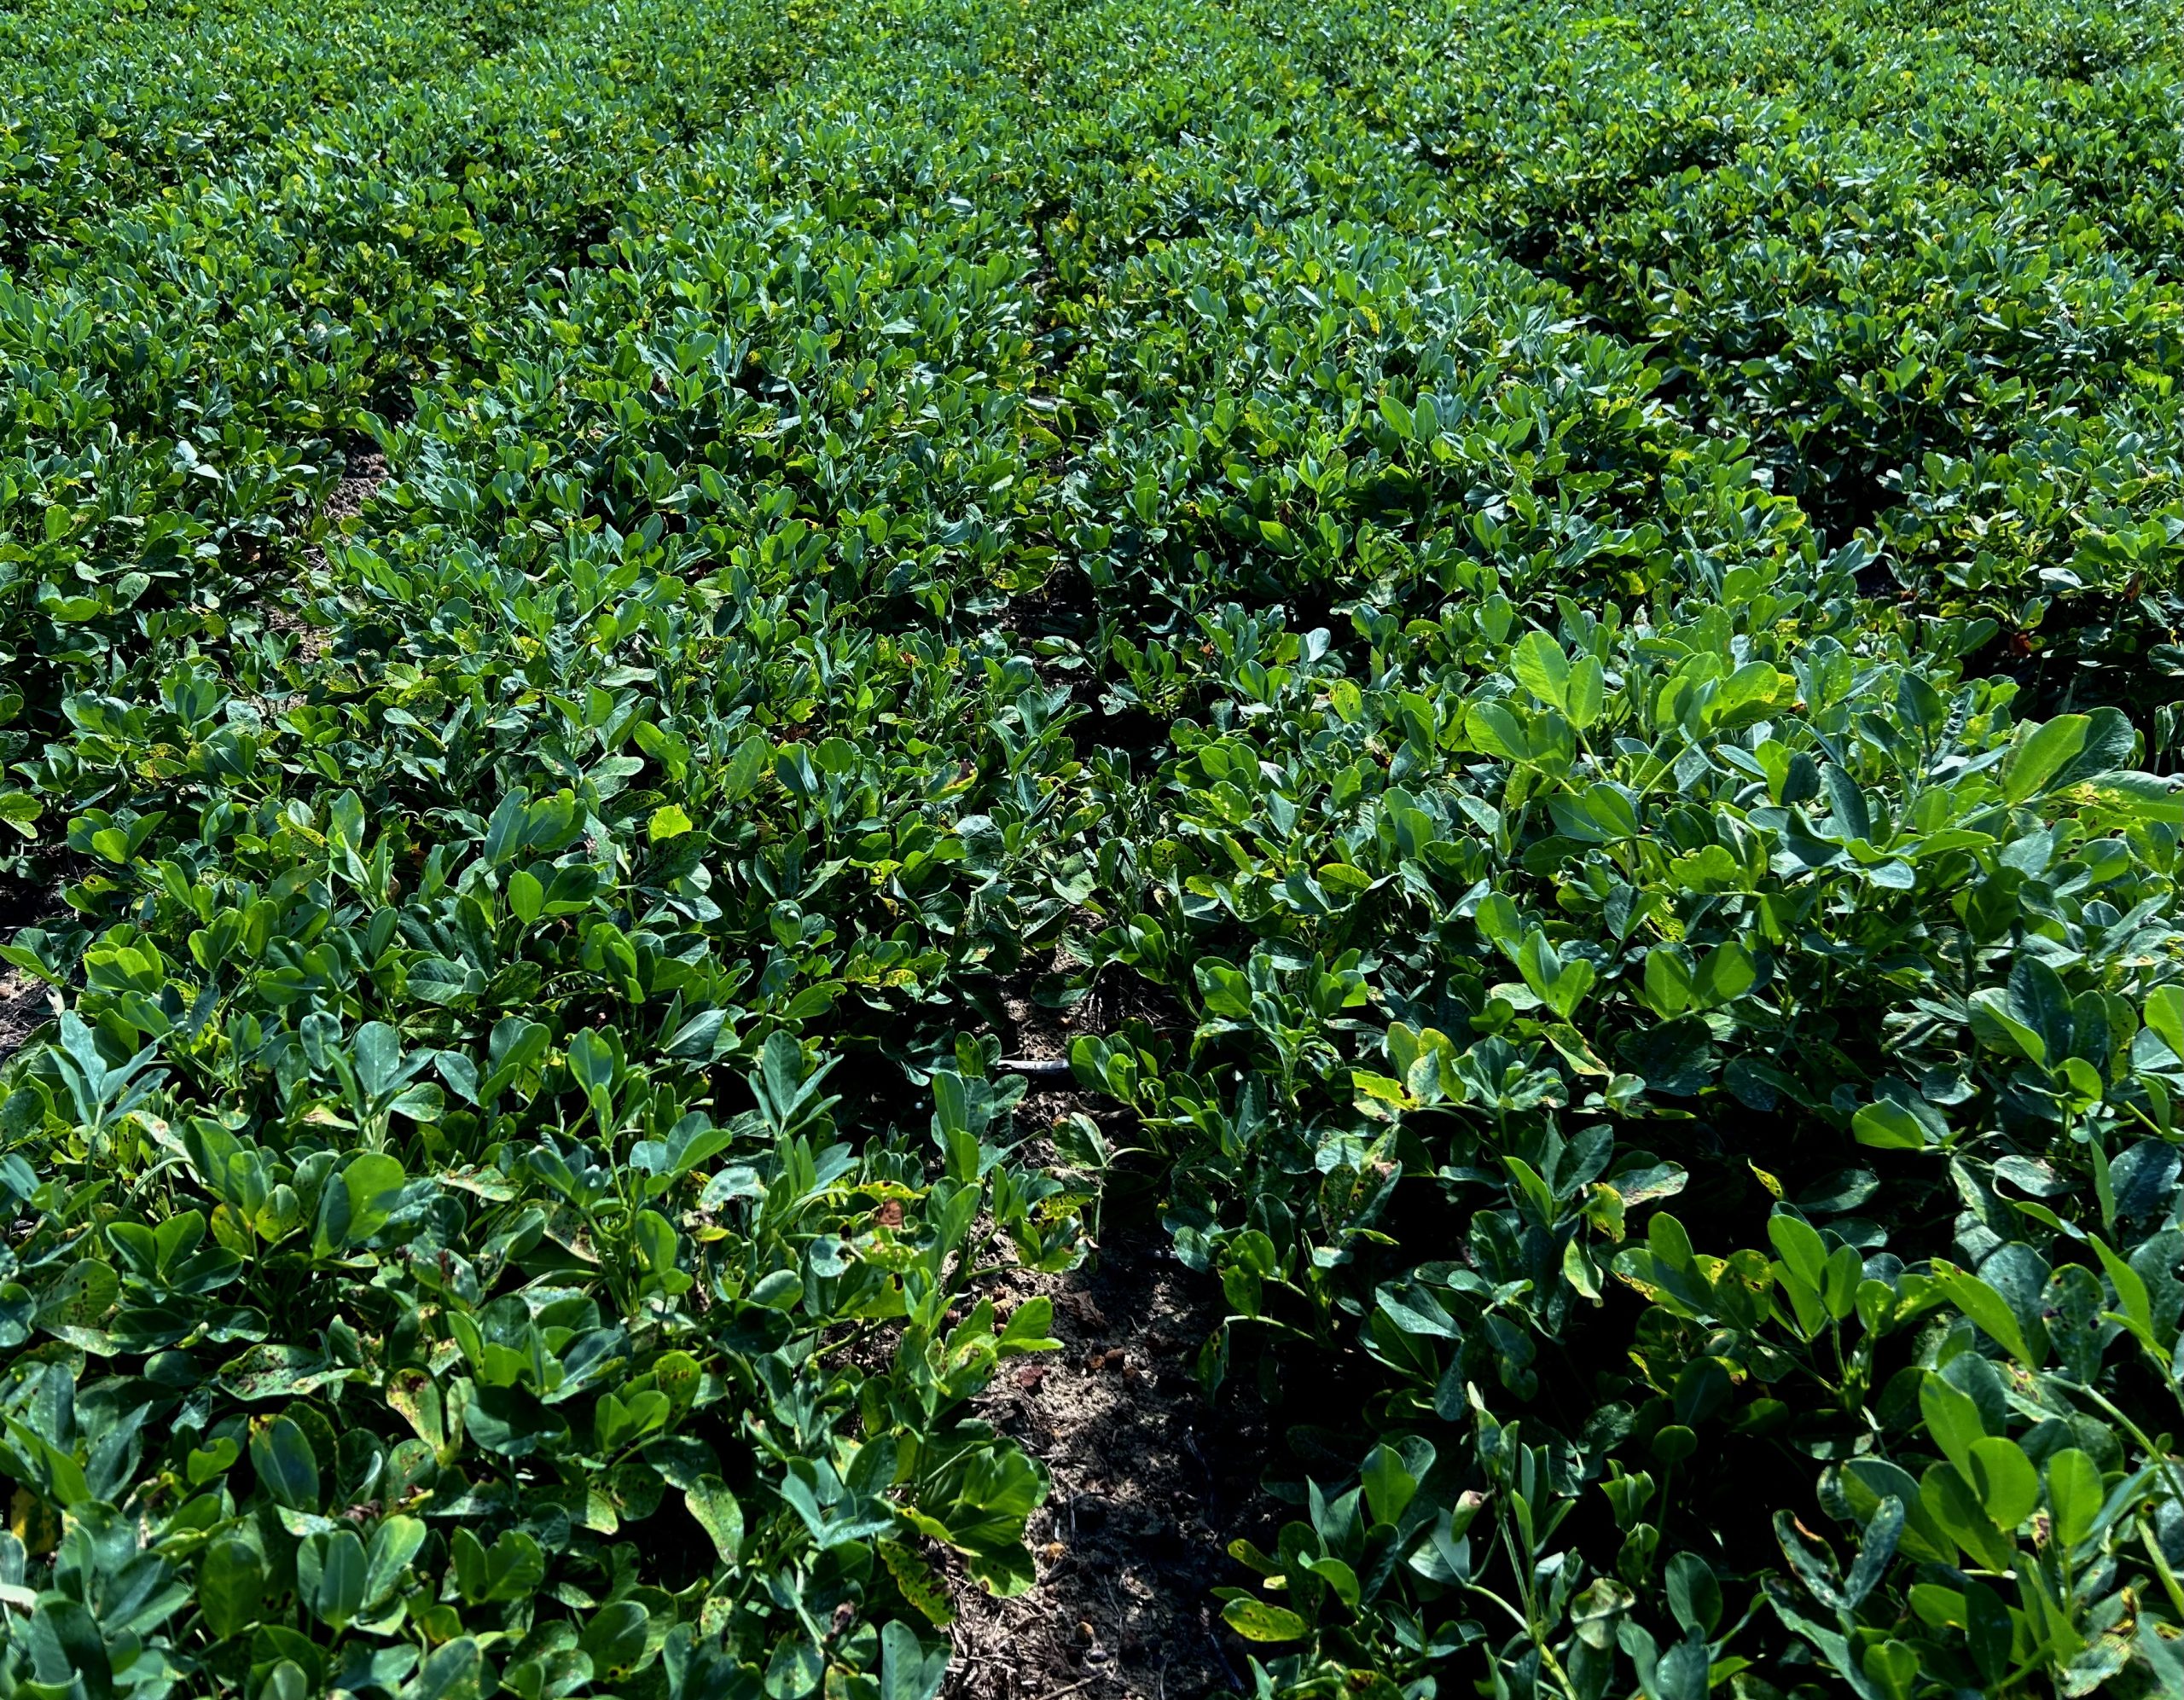
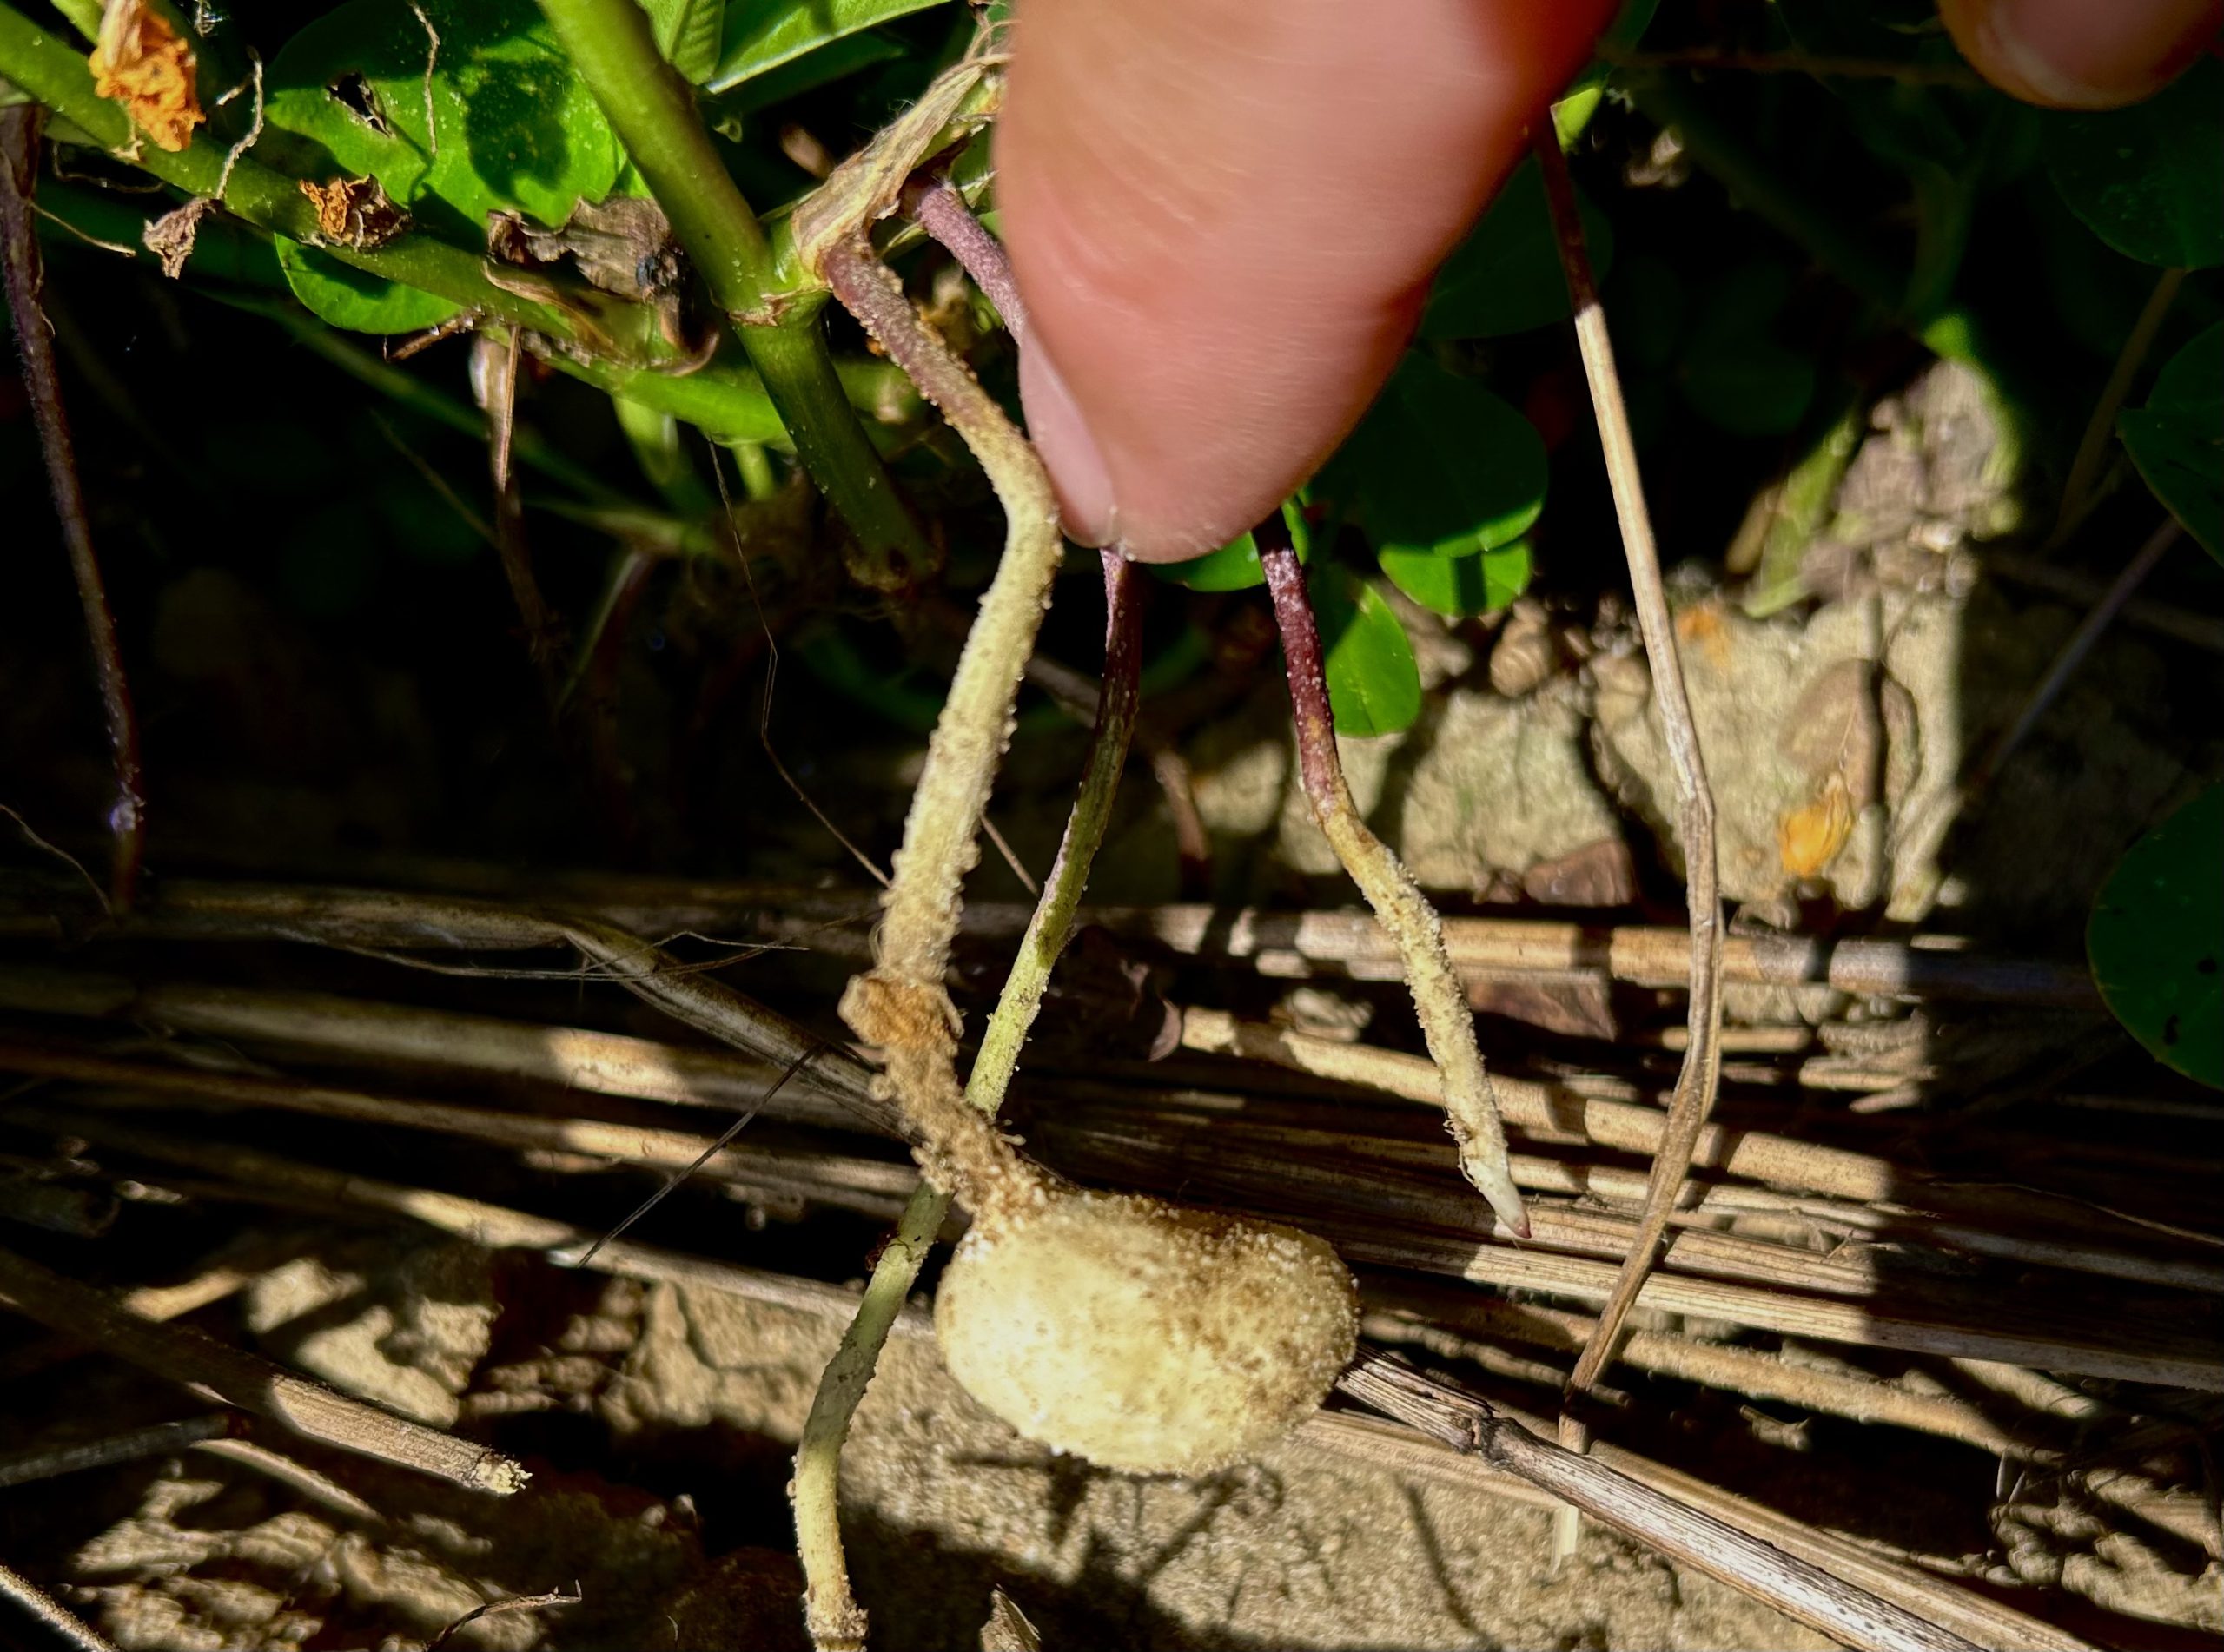
GA 06G peanuts were planted on June 6th due to wet field conditions. The peanuts are 86 Days After Planting (DAP), as of September 1st, and have accumulated 2190Growing Degree Units (GDUs).They are currently in the pegging stage developing peanut pods. Maturity tests will begin when they reach 2500 GDUs, based on the UGA Peanut Production Guide.Figure 2 shows operational costs and projected income of the field since the last row crop was harvested. Figure 3 shows images of the current crop stage.
Figure 2: Front field peanut operational cost and project income
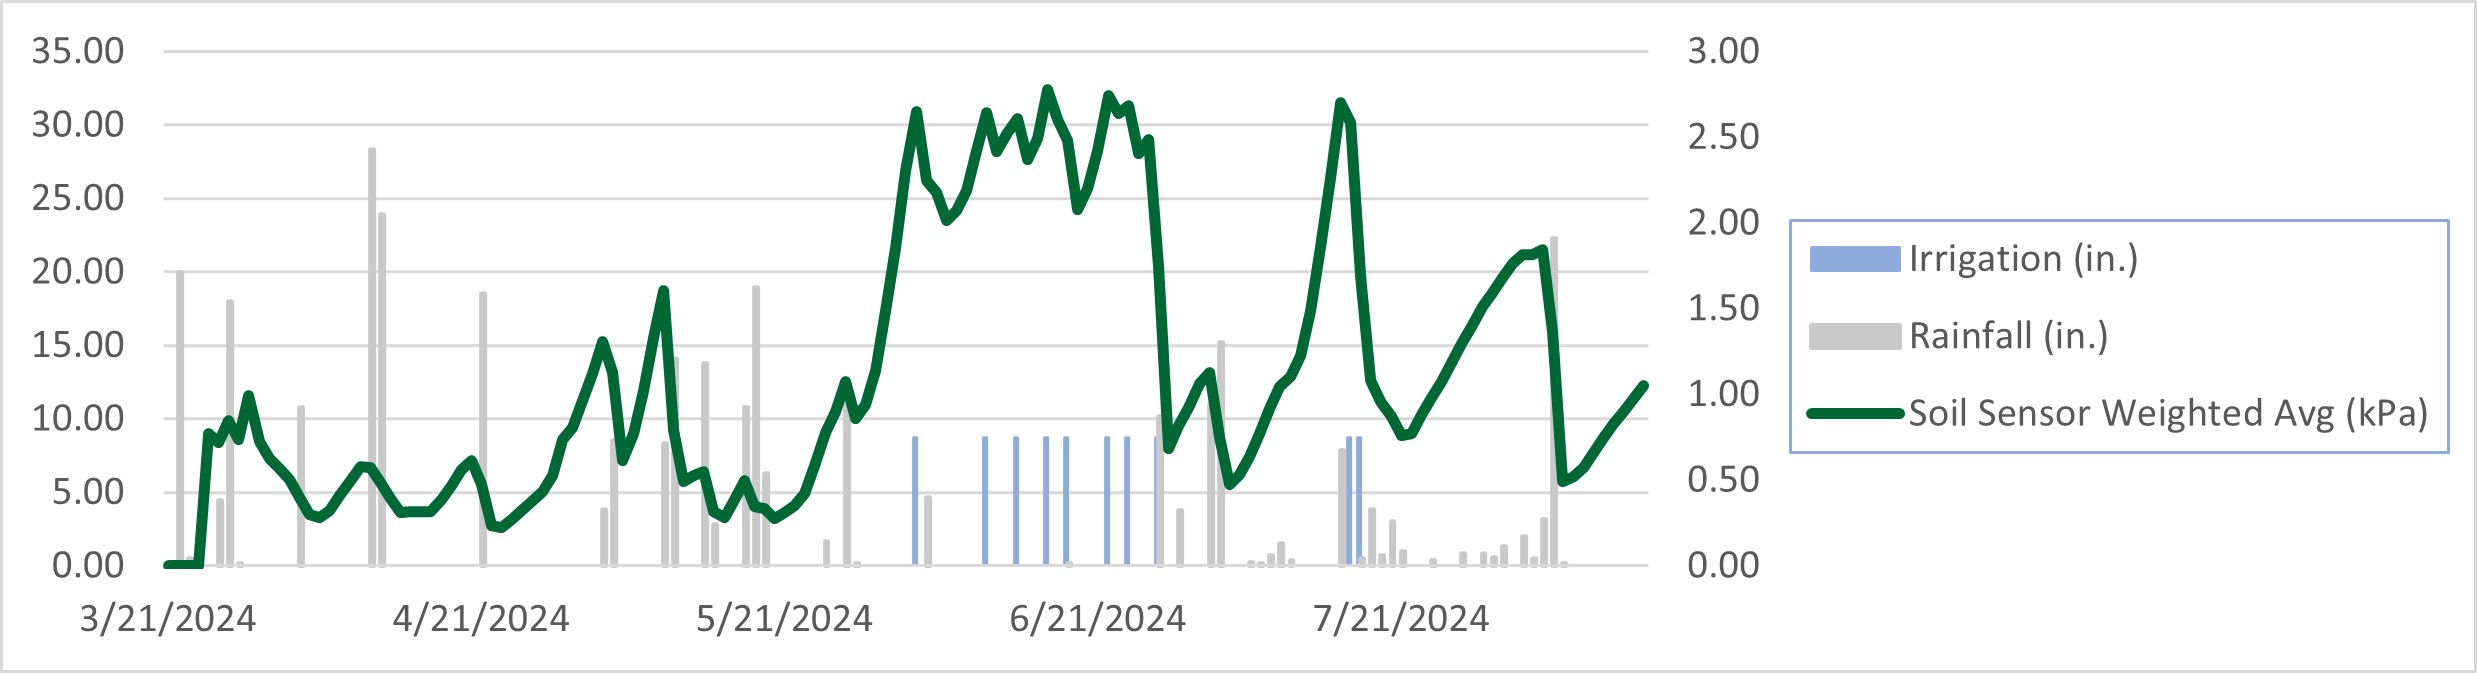
Corn was planted on the 21st of March. North Pivot is an irrigated field with four soil moisture sensors that measure at three depths (see 2024 Corn Crop Plan. Irrigation was triggered based on a weighted soil moisture threshold of 30 kPa. Figure 5 shows the rainfall and irrigation events for the growing season. Total irrigation applied was 7.5 inches, resulting in a total 35.2 inches of water on the field when combined with rainfall.The corn in North Pivot reached full maturity on July 30th, at which point moisture levels were monitored to schedule harvest when the corn moisture approached 15 percent. On August 27th a harvest crew came with a John Deere 9660 combine to harvest the corn. Members of the project from ABAC and UGA performed a moisture and yield sensor calibration before the corn was harvested. Figure 4 shows the rainfall, irrigation, and soil sensor data.
Figure 4: North Pivot Rainfall, Irrigation, and Soil Sensor Data
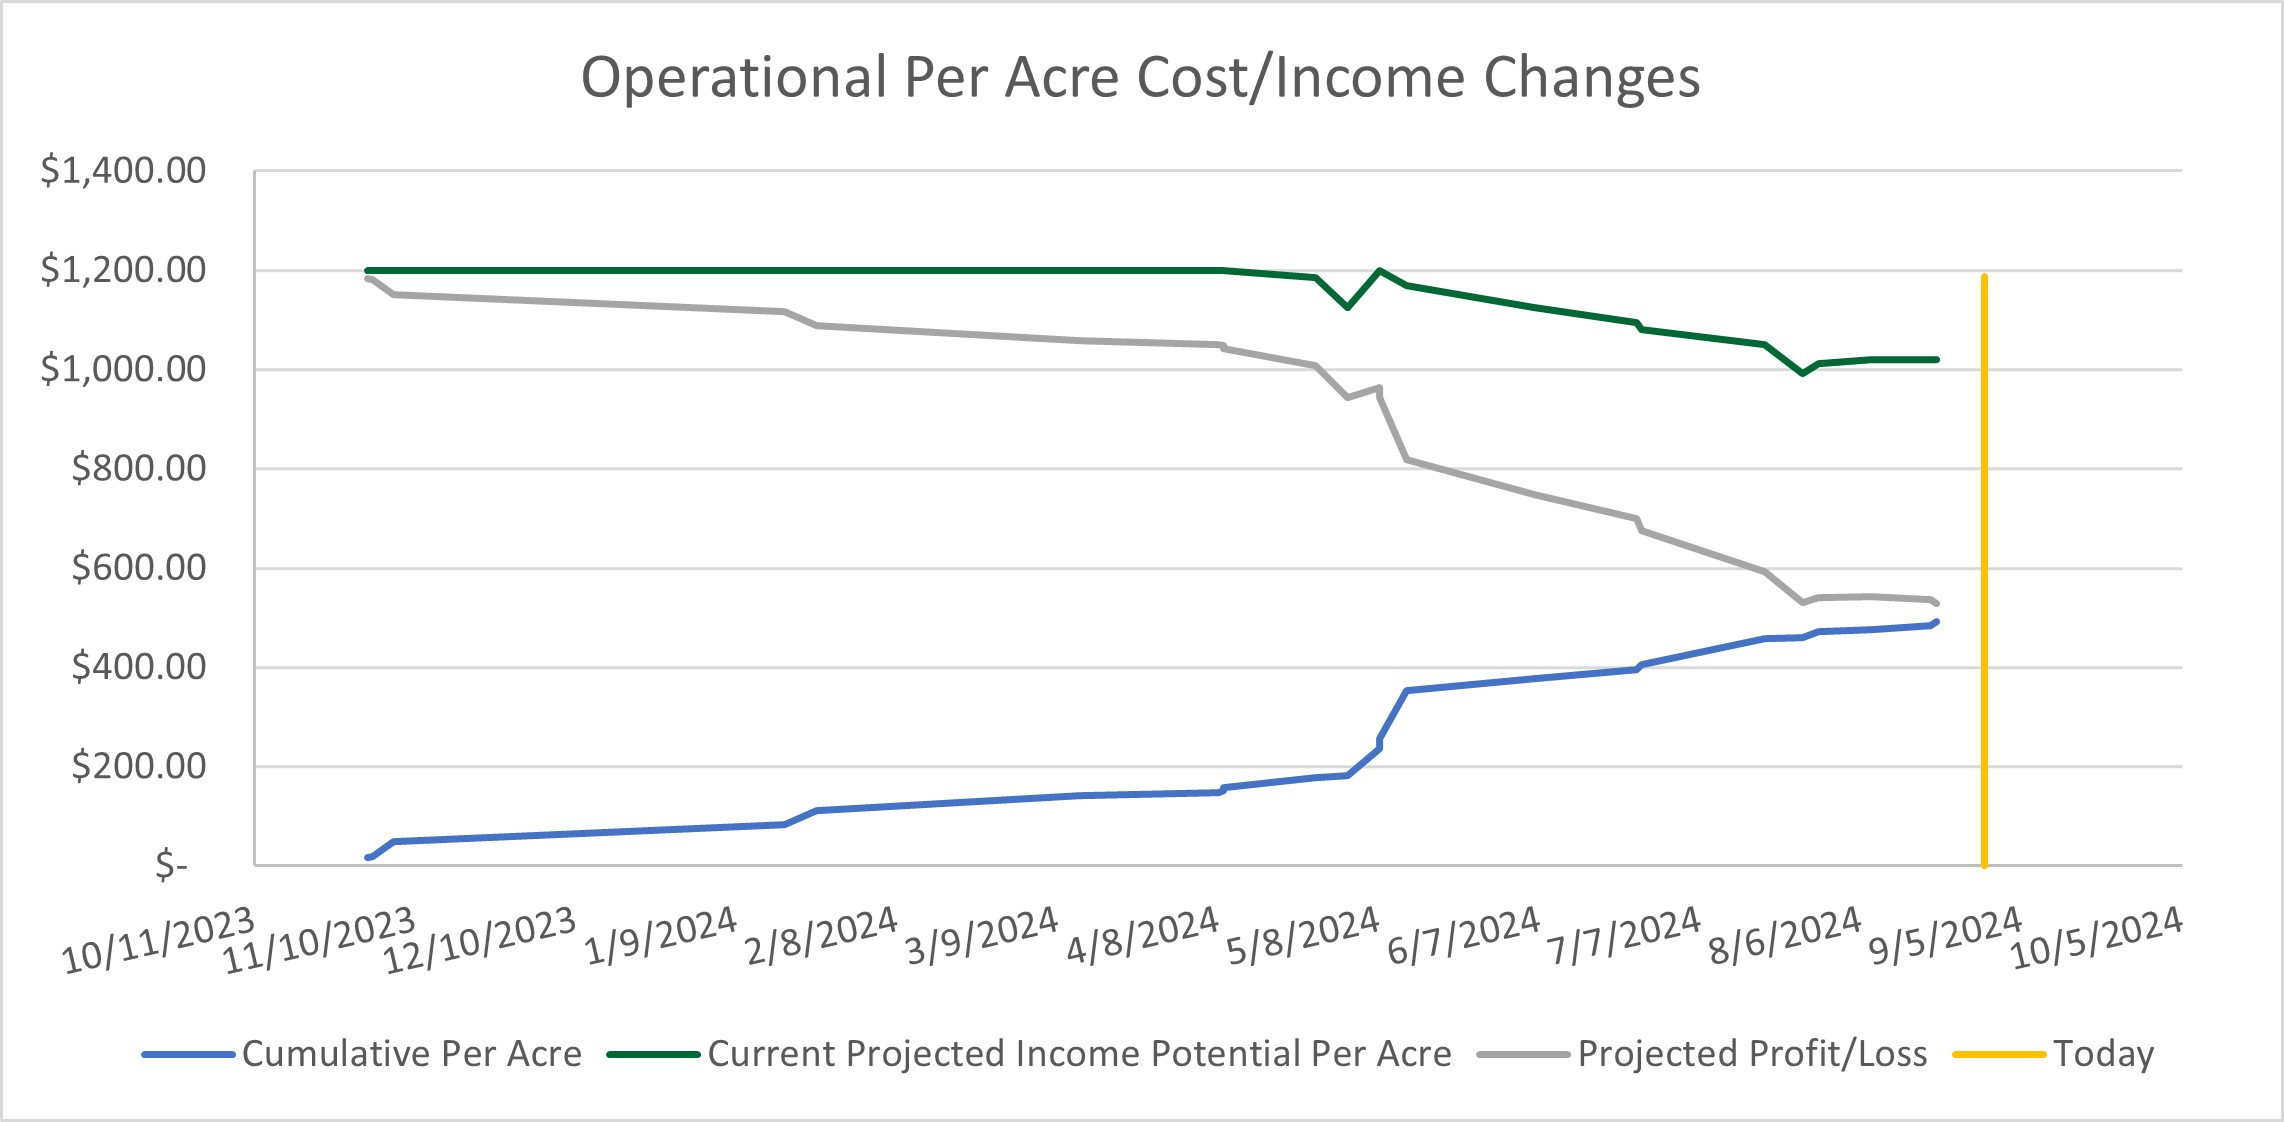
Figure 5 shows data tracking the operational costs and projected income from the crop, and the corn harvest on August 27th.Unfortunately, the corn price dropped over the growing season. At planting the market price for corn was $4.75/bushel and by harvest the price dropped to $3.92/bushel.The 2025 season on the field will begin with burn down operation for weeds and prep for the winter cover crop of cereal rye.
Figure 5: North Pivot Corn Cost/Income
South Pivot
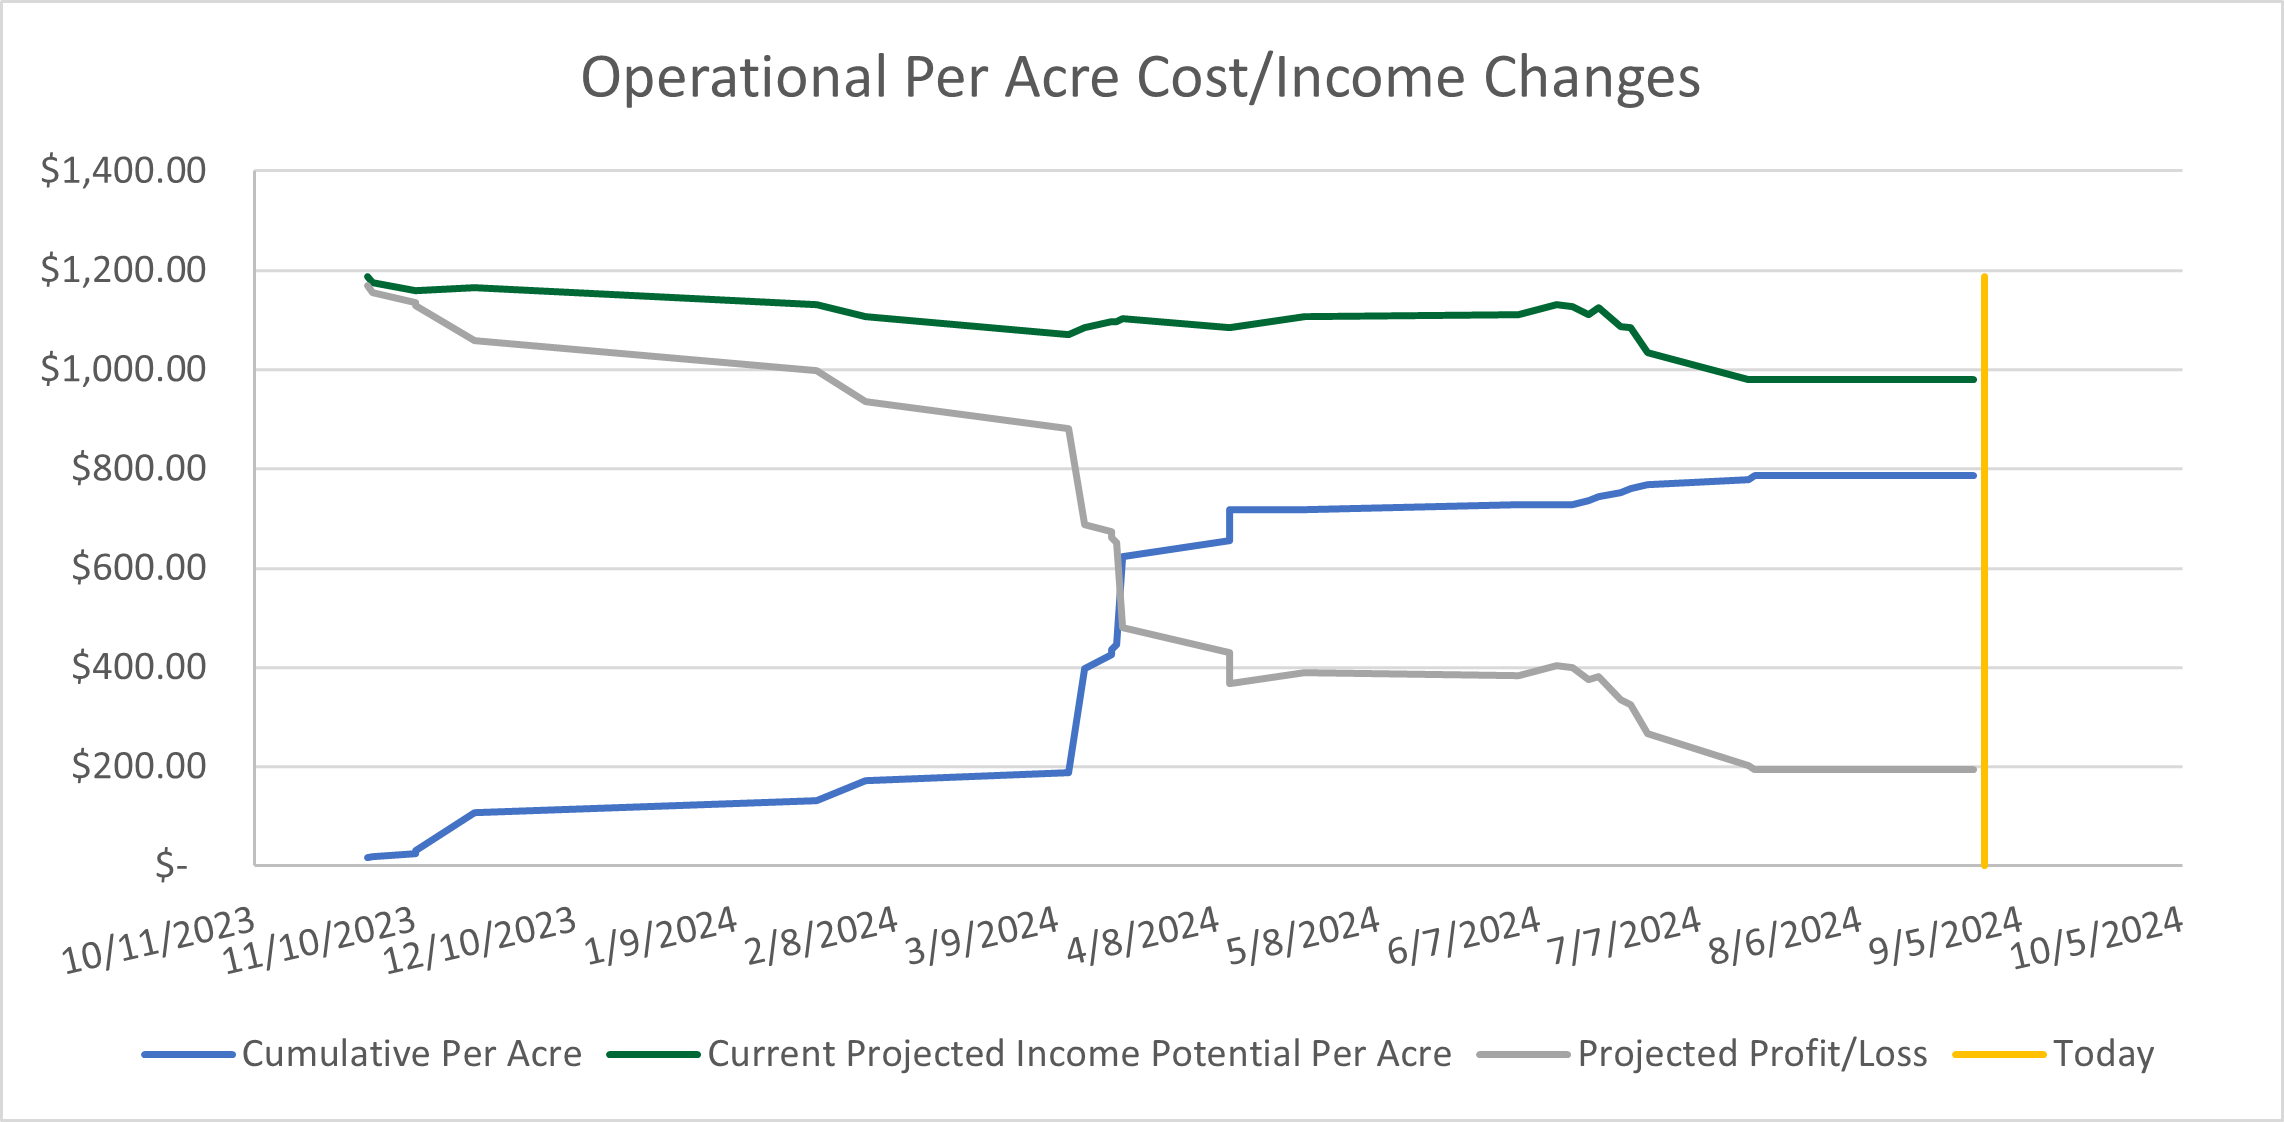
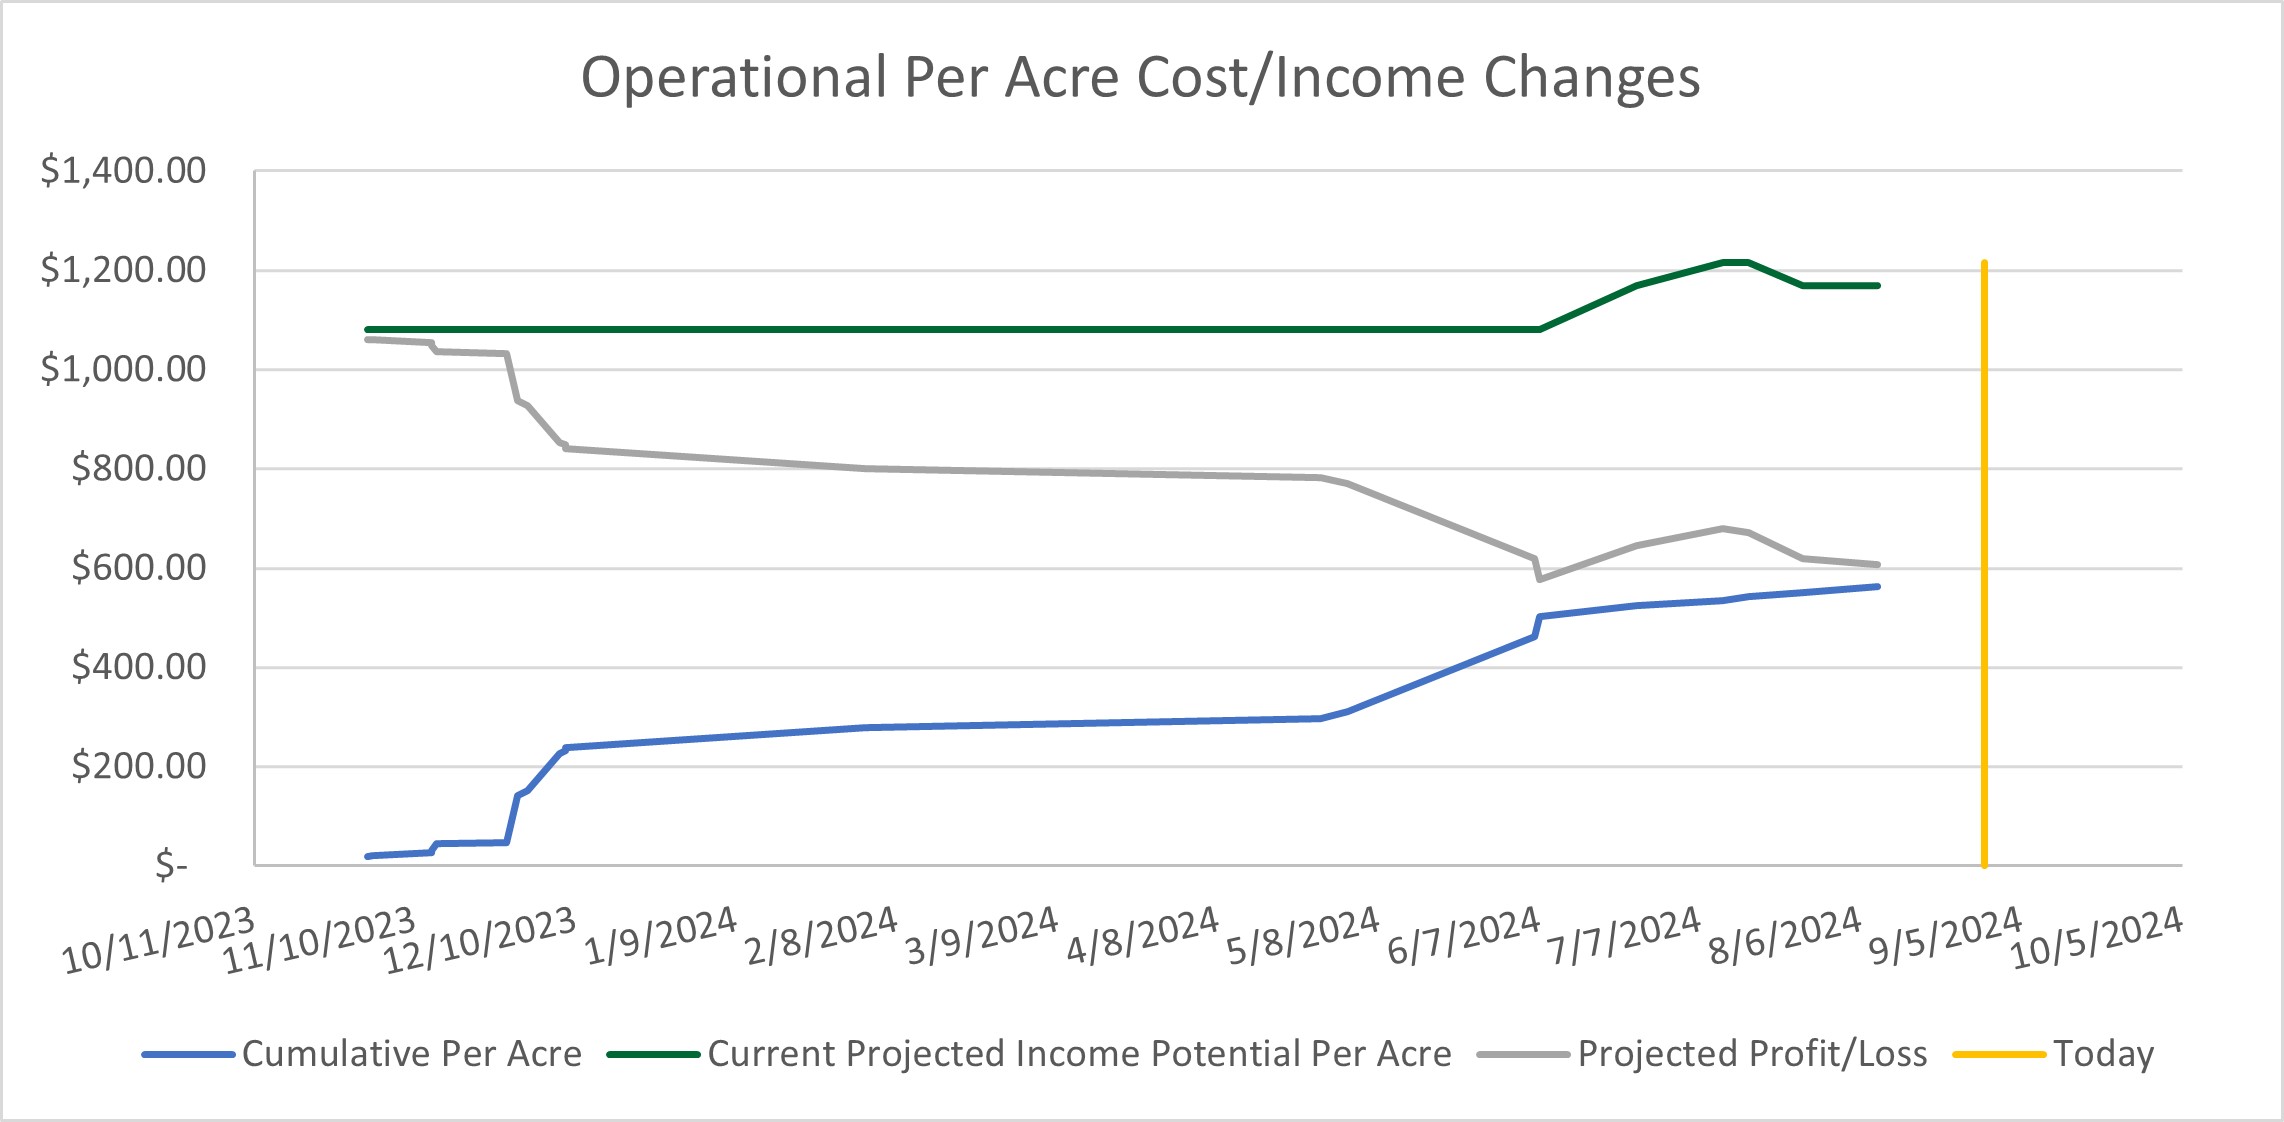
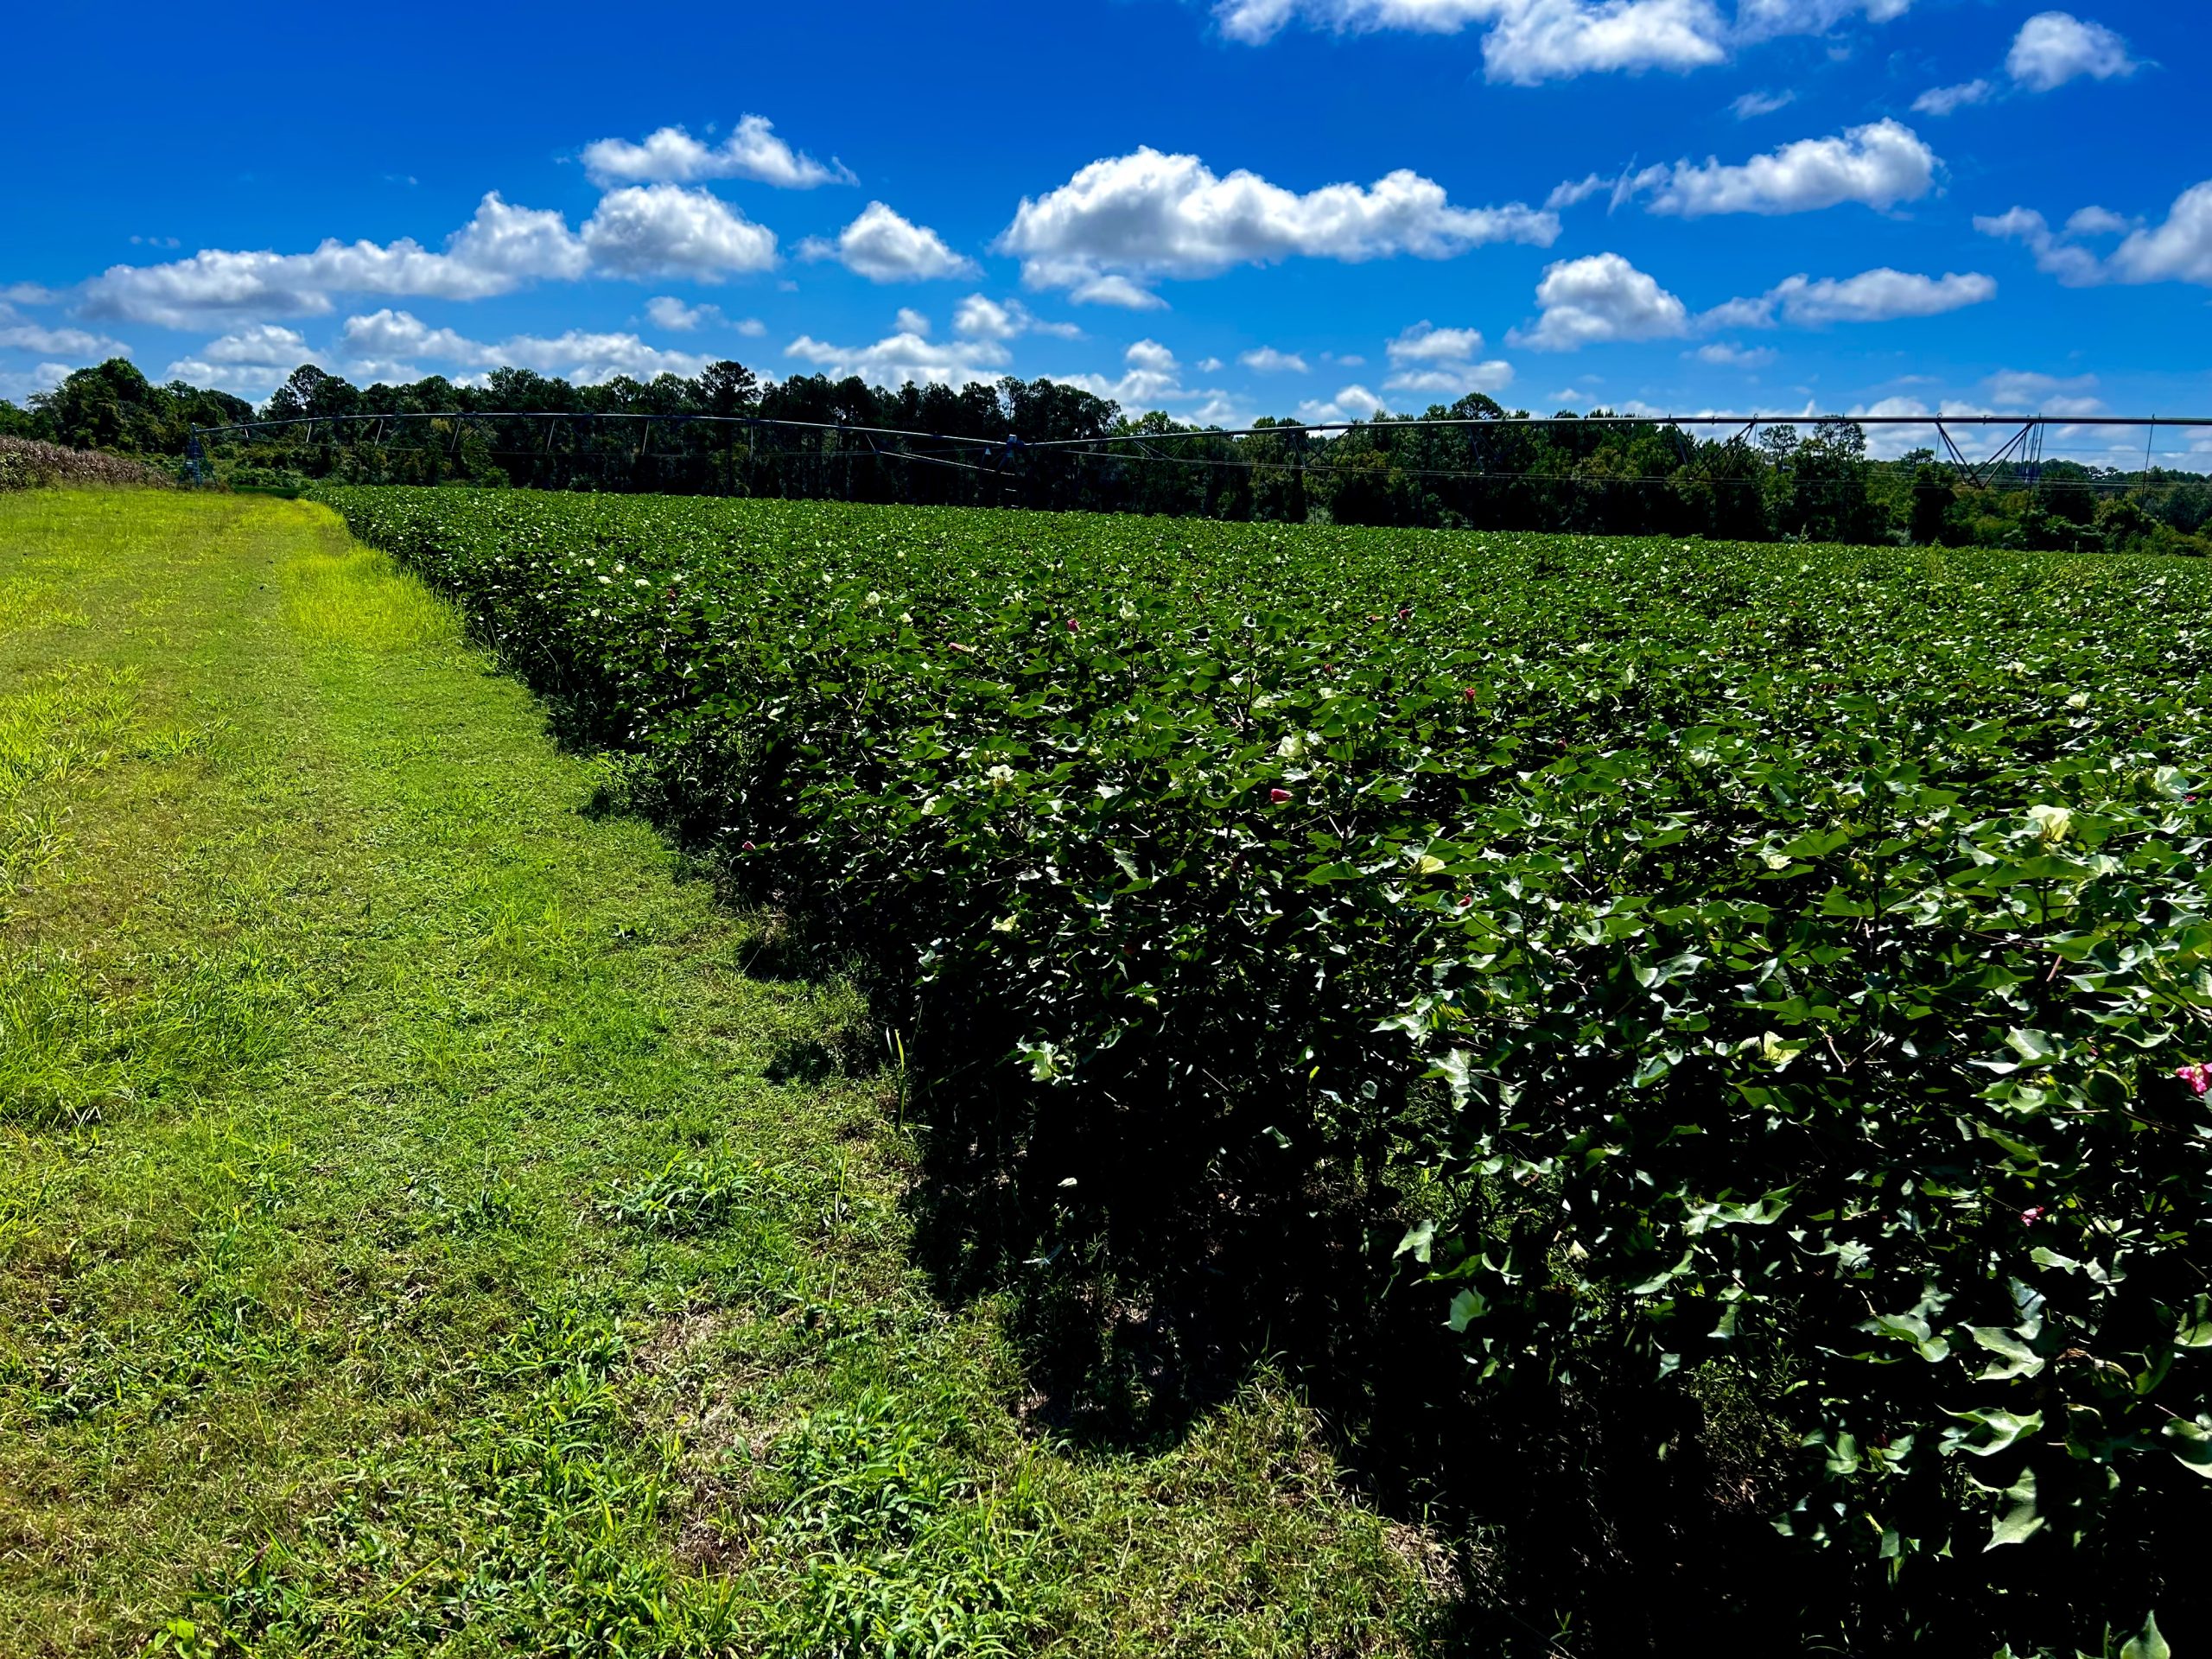
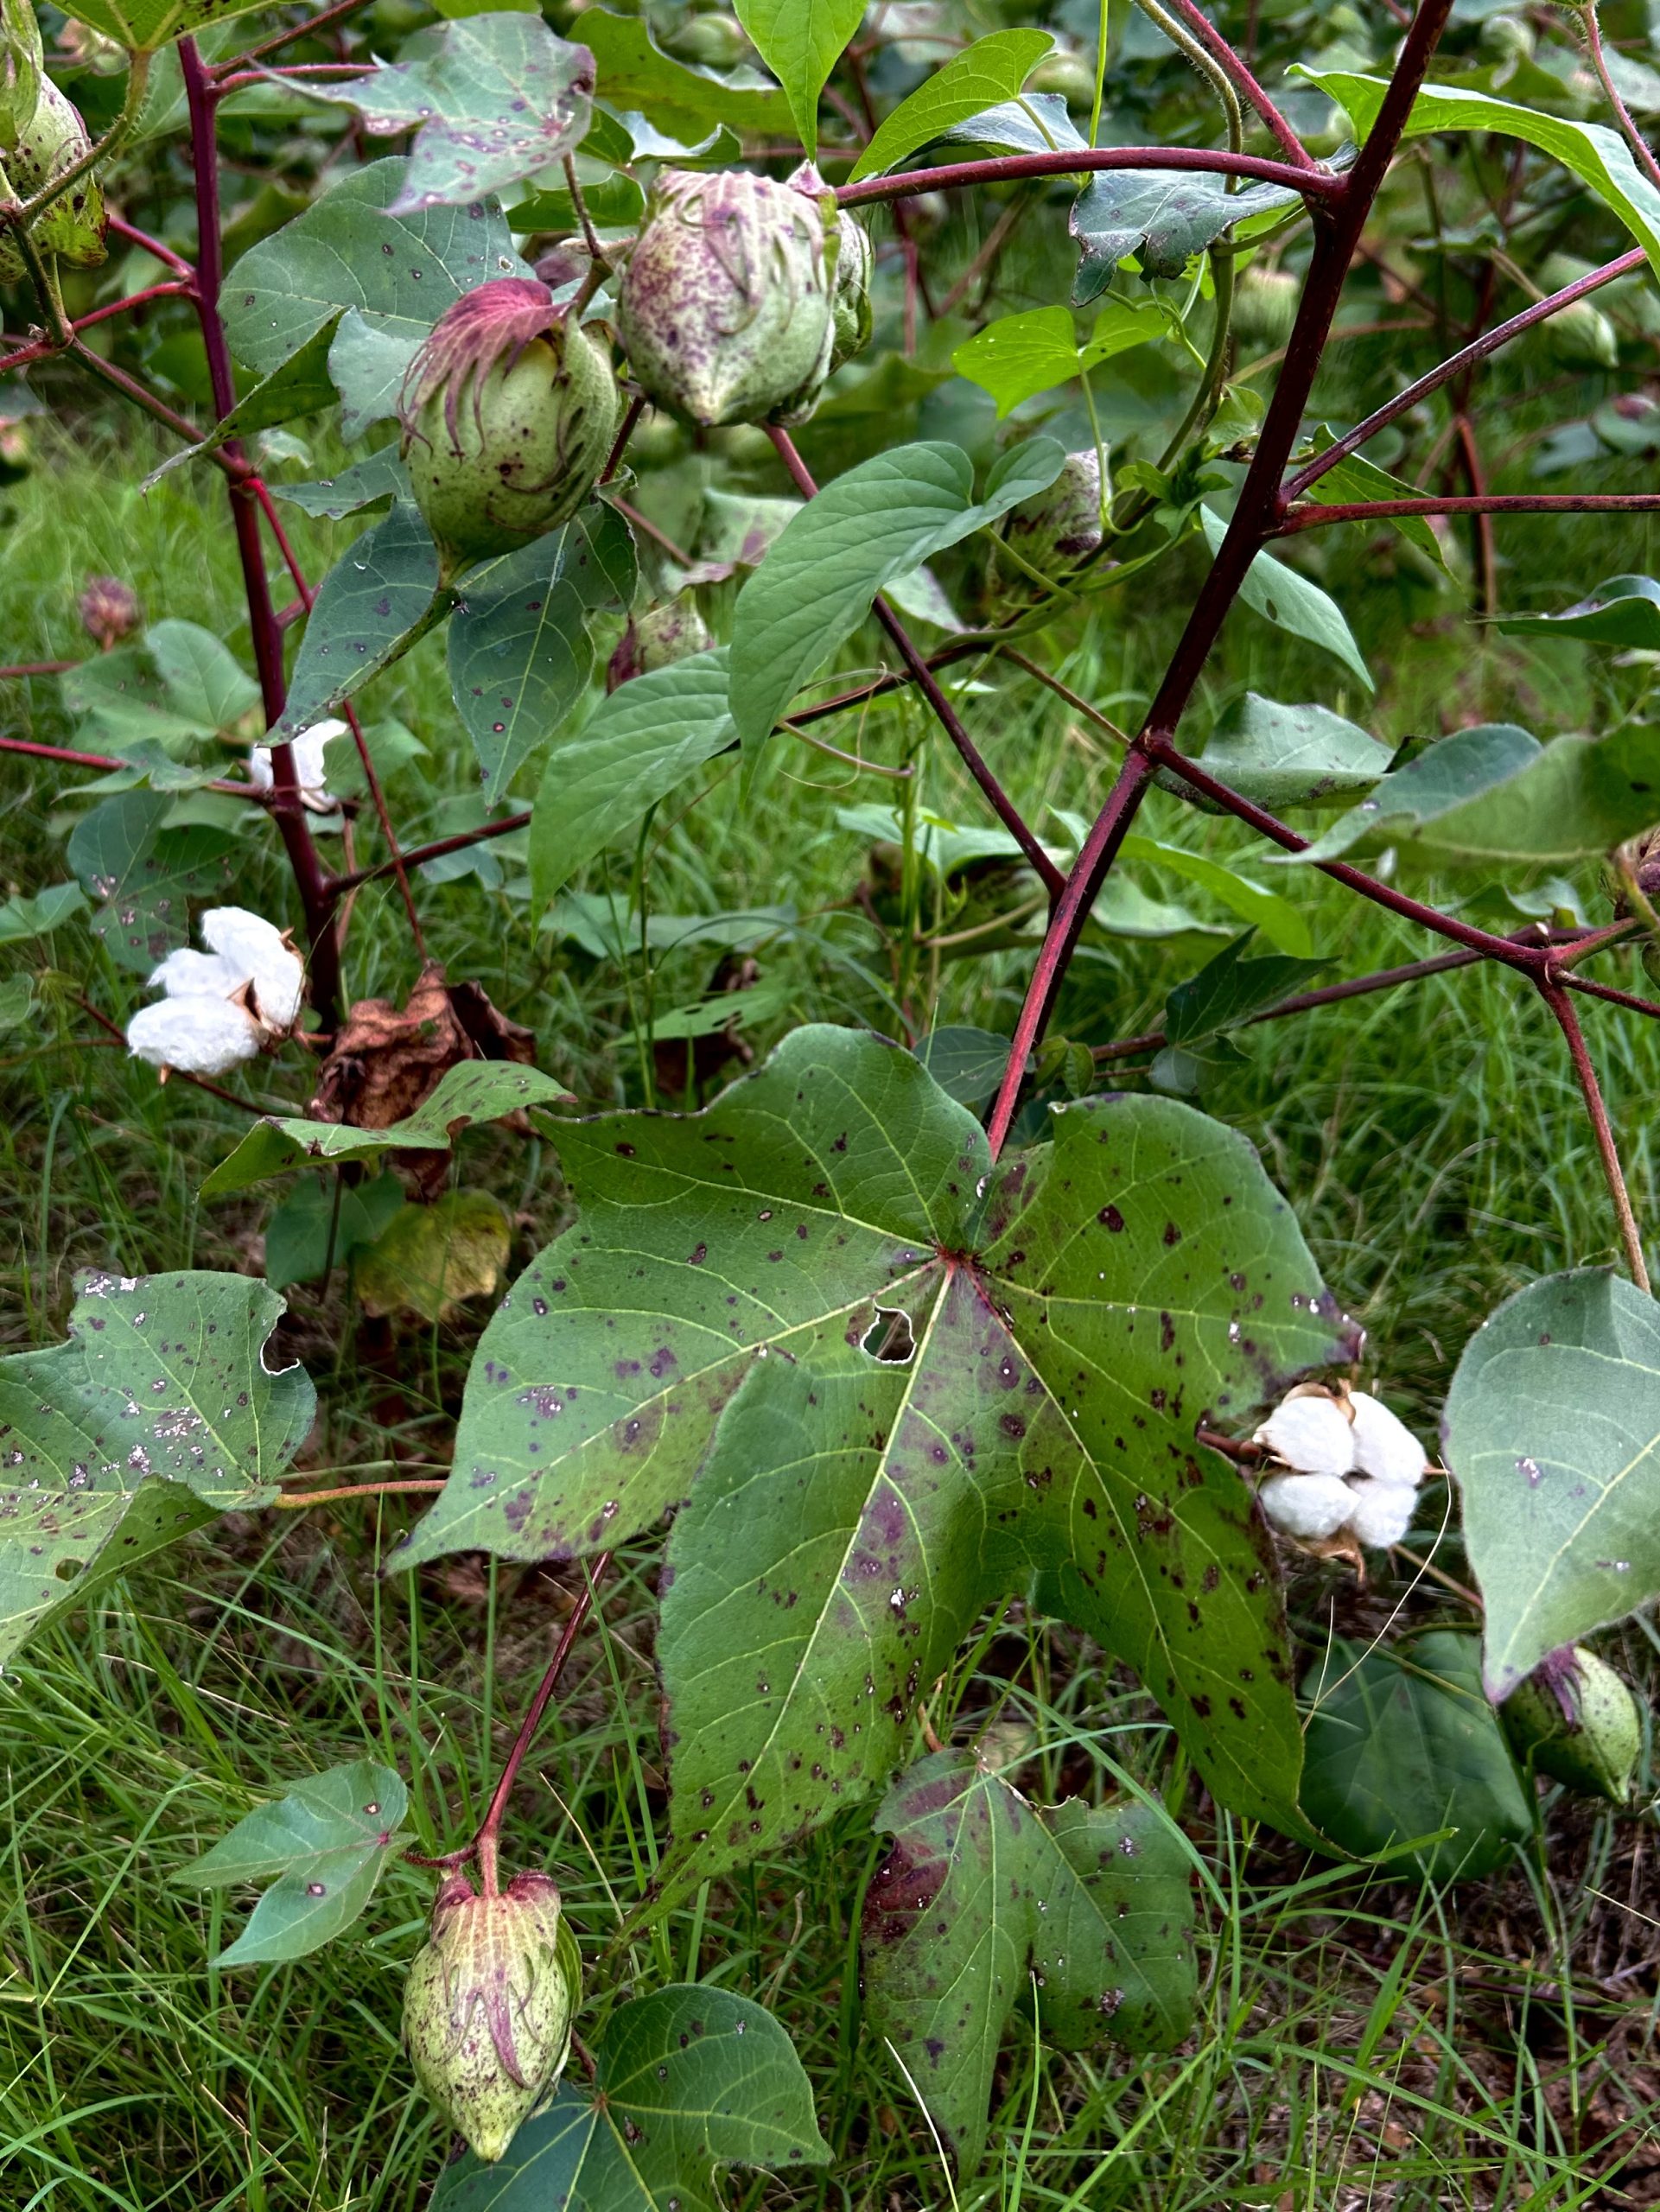
South Pivot was planted in cotton on May 13th just before the rainy period. Planting had a major impacton the cost per acre (~$96 per acre). Notice the jump of the cumulative per acrecost in Figure 6. Since planting, twoherbicide applications (6/6/2024 and 6/25/2024), a single irrigation event of 0.75 inches (6/26/2024), and a side dressapplication of nitrogen (7/19/2024)have occurred. The associated cost of these operations is shown inthe increases to the cumulative per acre cost in Figure 6. On August 26th open bolls were observedon the lower areas of the cotton plants. At that point the crop had accumulated 2132 GDUs, which is right in line with the UGA Cotton Production Guide’s timeline of first open bolls around 2150 GDUs.A PGR application occurred on August 26th and another irrigation (0.75 inches) event on August 29th. Figure 7 shows images of the current crop stage.
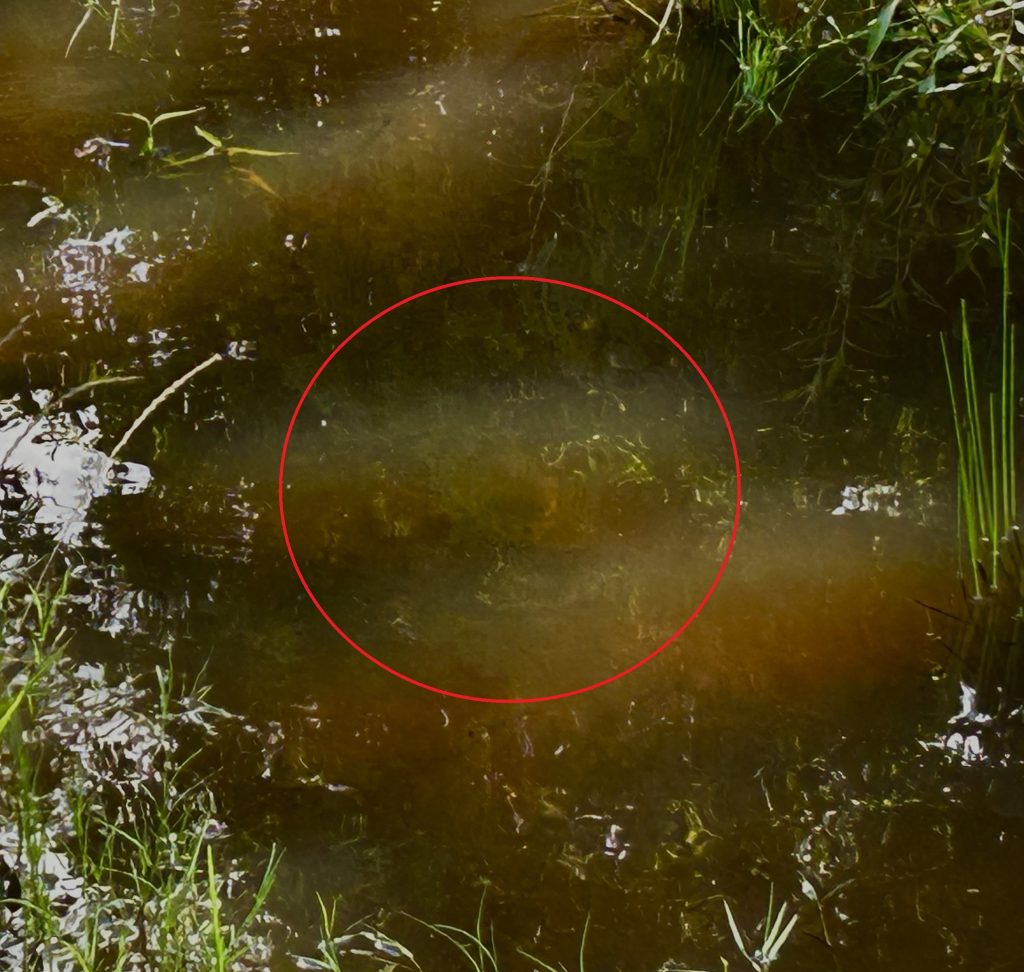
Planting of GA 06G peanuts was delayed until June 6th due to severely wet field conditions. The pond adjacentthe DATA Farm flooded into the field, and in May a small bass was observed in the field which is shown in figure 8.
Figure 9: West Field Peanuts Cost/Income
Maturity tests will begin when they reach 2500 GDUs1.Figure 9 shows data tracking the operational costs and projected income from the crop, and figure 10 shows images of the current crop stage.


